Changes in Temperature Trends and Extremes over Saudi Arabia for the Period 1978–2019
Abstract
Climate change is posing severe threats to human health through its impacts on food, water supply, and weather. Saudi Arabia has frequently experienced record-breaking climate extremes over the last decade, which have had adverse socioeconomic effects on many sectors of the country. The present study explores the changes in average temperature and temperature extremes over Saudi Arabia using an updated daily temperature dataset for the period 1978–2019. Also, changes in frequency and percentile trends of extreme events, as well as in absolute threshold-based temperature extremes, are analyzed at seasonal and annual time scales. The results are robust in showing an increase in both temperature trends and temperature extremes averaged over the second period (2000–2019) when compared to the first period (1980–1999). Over the period 1978–2019, the minimum temperature for the country increased (0.64°C per decade) at a higher rate than the maximum temperature (0.60°C per decade). The rate of increase in the minimum and maximum temperatures was reported as 0.48 and 0.71°C per decade, respectively, for the period 1978–2009. The minimum temperature increased by 0.81°C per decade for the second period compared to an increase of 0.47°C per decade for the first period. The significant increase in minimum temperature has resulted in a decreasing linear trend in the diurnal temperature range over recent decades. The maximum (minimum) temperature increased at a higher rate for Jan-Mar (Jun-Nov) with the highest increase of 0.82 (0.89)°C per decade occurring in March (August). The analysis shows a substantial increase (decrease) in the number of warm (cold) days/nights over the second period compared to the first period. The number of warm days (nights) significantly increased by about 13 (21) days per decade, and there is a significant decrease of about 11 (13) days per decade of cold days (nights). The seasonal analysis shows that this increase in warm days/nights is enhanced in boreal summer, with a reduction in the number of cold days/nights in winter. These results indicate that the warming climate of Saudi Arabia is accelerating in recent decades, which may have severe socioeconomic repercussions in many sectors of the country.
1. Introduction
The increase in concentrations of atmospheric greenhouse gases has brought about an increase in the global mean surface temperature [1, 2]. Extreme climate events such as heatwaves, droughts, and floods have substantial adverse effects on habitats and the environment. In the context of ongoing global climate change, extreme temperature (ET) events are of great concern nowadays. Many changes have been observed in extreme weather and climate events, including “an increase in warm temperature extremes” in different parts of the globe [3]. For example, the record-breaking temperatures of 2010 made that summer one of the most extremes in history, particularly in Eastern Europe and Russia [4]. Simmons et al. [5] show that global temperature has increased in the recent decades, whereas Hansen et al. [6] reported that this warming is faster in the latest decade compared to the prior two decades. Overall, most regions in the Northern Hemisphere faced record high summer temperatures in 2010 [7]. These ETs have noticeably intensified and are occurring more frequently over the last decade [8, 9], leading to serious adverse socioeconomic and environmental impacts [10–12]. For instance, many studies report that heatwaves (HWs), one form of ET, have caused calamitous damage. The damages include water shortages, widespread crop loss, wildfires, and loss of lives in different parts of Europe over the last two decades [4, 13–15]. South Asian countries, including Afghanistan, Bangladesh, Bhutan, India, Maldives, Nepal, Pakistan, and Sri Lanka, are experiencing an increasing linear trend of greater temperature extremes [16]. These extremes have caused more frequent and more severe extreme flooding events.
Middle Eastern countries have observed adverse impacts of extreme temperatures on socioeconomic activities and human health [17–22]. Saudi Arabia, the largest country in the Middle Eastern region, has experienced several ET events and their aftermaths in the context of regional climate change. For example, the temperature reached 52°C in summer in Jeddah city on 22nd June in 2010 [23–25]. This high temperature forced eight power stations throughout the country to shut down, resulting in a loss of power for several cities [26]. The highly adverse impacts of ETs mean that detailed investigation of temperature extremes using up-to-date records is essential for any region and country. This is particularly important for Saudi Arabia, where the climate is characterized as semiarid and arid [25, 27].
Statistical variability in the mean and extreme values, as well as their spatial distribution, can be used to characterize climate change. Although understanding climate extremes is essential to implement and manage emergency plans, the study of climate change using climate extremes is rather complex. Many climate change studies use conventional climate indices to explain climatic extremes. More recently, studies have examined temperature extremes such as the number of warm days/nights and cold days/nights, diurnal temperature range, annual summer days, tropical nights, and warm/cold spells all over the world. For example, Sheikh et al. [28] used datasets from 210 observation stations to analyze temperature extremes for South Asia over the period 1965–2000. They reported that warm extremes are becoming more common in the region. Ling et al. [29] calculated temperature extremes over China using data from 653 stations for the period 1971–2013. They observed an increase in warm extremes for most parts of China. Fang et al. [30] analyzed extreme temperature indices over China for the period 1971–2000 and concluded that warm indices are rising faster than cold indices. In Egypt, temperature extremes were calculated from both observations and model simulations for the period 1950–2017 and exhibited increasing (decreasing) warm (cold) days and nights [31]. Linear trends in temperature for the period 1965–2015 over Iraq are reported by Salman et al. [32], and Ilori and Ajayi [33] presented similar trends over west Africa for the historical period 1961–2000 and projected period 2020–2099. Deniz and Gönençgil [34] reported on percentile-based temperature extremes over Turkey. In the semiarid region of Algeria, the temperature linear trend was calculated for the period 1980–2019 [35] and for the period 1961–2016 for Ghana by Abungba et al. [36]. Temperature extremes from climate model data for the CORDEX-MENA domain was also reported by Driouech et al. [37].
There are few similar studies found over the Middle East using old datasets from 1981 to 2010. For example, Almazroui et al. [38] analyzed linear trends in temperature extremes over Saudi Arabia using datasets from 27 observation stations for the period 1981–2010. They reported that the climate of Saudi Arabia is warming, and the warming trend is of greater magnitude for the second half of the 1981–2010 period than for the first half. Alghamdi and Moore [22] analyzed trends in extreme temperature indices for two stations in Riyadh city for the period 1985–2010. Analyzing 13 extreme temperature indices, they concluded that the city’s climate is warming locally and that the rural areas are warming faster than the urban areas. Krishna [24] used observational data from four cities in Saudi Arabia to assess warming trends for the period 1984–2013. They reported a significant rise in temperature in all cities. AlSarmi and Washington [39] used data from eight stations to calculate temperature extremes over Saudi Arabia for the period 1978–2008. Extreme temperature trends in Western Saudi Arabia were analyzed by Rahman and Al Hadhrami [40], who used data from the Jeddah station for the period 1970–2006. Islam et al. [41] reported seasonal temperature extremes over Saudi Arabia using daily temperatures from 27 stations for the period 1981–2010. They reported variations in warming for different seasons and regions across the country. However, they found a clear indicator of warming over Saudi Arabia from 1997 onwards, irrespective of season and region.
It is important to note that all of these studies of temperature extremes in Saudi Arabia used data up to 2010, except for one study which used data up to 2013 from four stations only [24, 37, 40]. However, in a recent publication, Almazroui [42] reported that, in the most recent decade, observed temperatures in the country have been increasing at a faster rate. This provides the motivation for an investigation of temperature extremes over Saudi Arabia using up-to-date data covering the whole country.
Previous studies of temperature extremes over Saudi Arabia mostly focused on daily data up to 2010; however, the rate of increase in temperature during the second period (2010–2019) is higher (linearly) than during the previous decades. Therefore, this paper investigates recent changes in temperature linear trends and extremes over Saudi Arabia using quality-controlled surface observations for the period 1978–2019. The main aims of this study are as follows: (i) to examine the distribution of temperature extremes over Saudi Arabia from 1978 to 2019 and (ii) to compare the changes in extreme temperature linear trends over Saudi Arabia in the second period with the first period. Moreover, the surface observational daily data analyzed in the present study have passed very thorough quality control. The outcomes of this paper are expected to facilitate not only a better understanding of temperature extremes and their linear trends over Saudi Arabia but also validate data for climate models in the calculation of temperature extremes over the region.
2. Data and Methods
2.1. Study Area
Saudi Arabia is the largest country (80%) in the Arabian Peninsula. It is surrounded by water bodies to the west (the Red Sea), the east (the Arabian Gulf), and to the south by the Arabian Sea. The climate of Saudi Arabia is hot and dry with annual rainfall ∼93 mm [25]. Temperature ranges from 8.57°C to 28.32°C in the north and from 26.68°C to 33.97°C in the south of the country [43]. However, mountains play a vital role in controlling the local climate in Saudi Arabia. Elevations of about 1500 m or more above sea level exist on the southwest side of the country (Figure 1). This high-elevation mountain range extends into Yemen and slopes gradually on the eastern side [25].
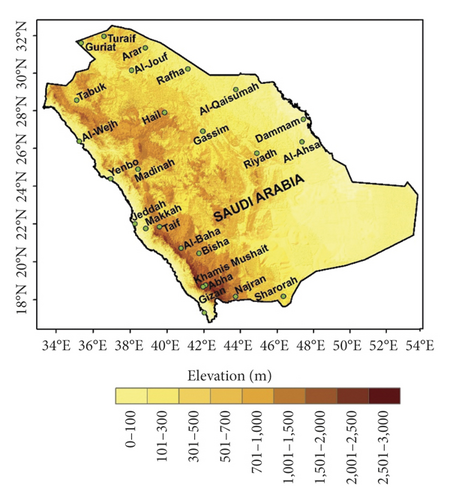
2.2. Data Used
In the analysis of temperature extremes over Saudi Arabia, datasets of the daily maximum and minimum temperatures for the period 1978–2019 were used from 25 stations across the country. These data are collected and provided by the General Authority of Meteorology and Environmental Protection (GAMEP). The locations of the 25 meteorological stations with the topographic features of Saudi Arabia are depicted in Figure 1. Of the 25 stations, six have data available from 1985 (Table 1). Following Almazroui et al. [37, 40], daily maximum and minimum temperature data are quality controlled for the entire period 1978–2019. The outliers are verified with metadata and corrected where applicable. The metadata and weather underground data are also used to fill in for missing data. Some basic criteria, such that minimum temperature should not exceed the maximum temperature, and that the difference between daily temperatures remains within 4-5 C, are strictly checked. Knowledge from local experts on climatology is also taken into account. Besides these, RClimDex, recommended by the Expert Team on Climate Change Detection and Indices (ETCCDI), is used in data quality checking [44, 45].
| Sr. | Station | Coordinate | Mean temperature (°C) | Maximum temperature (°C) | Minimum temperature (°C) | ||||||
|---|---|---|---|---|---|---|---|---|---|---|---|
| Code | Name | Elevation | Lat | Lon | Average | Trend | Average | Trend | Average | Trend | |
| 1 | 40375 | Tabuk | 778 | 28.38 | 36.60 | 22.37 | 0.45a | 29.94 | 0.29a | 14.80 | 0.62a |
| 2 | 40356 | Turaif | 855 | 31.68 | 38.73 | 19.10 | 0.38a | 26.15 | 0.28a | 12.04 | 0.47a |
| 3 | 40360 | Guriat ∗ | 509 | 31.40 | 37.28 | 20.27 | 0.42a | 28.64 | 0.22b | 11.90 | 0.62a |
| 4 | 40362 | Rafha | 449 | 29.62 | 43.48 | 23.57 | 0.59a | 31.23 | 0.34a | 15.91 | 0.83a |
| 5 | 40357 | Arar | 555 | 30.90 | 41.13 | 22.46 | 0.68a | 29.76 | 0.68a | 15.15 | 0.69a |
| 6 | 40361 | Al-Jouf | 689 | 29.78 | 40.10 | 22.26 | 0.81a | 29.24 | 0.63a | 15.27 | 1.00a |
| 7 | 40394 | Hail | 1015 | 27.43 | 41.68 | 22.15 | 0.63a | 29.64 | 0.65a | 14.66 | 0.62a |
| 8 | 40405 | Gassim | 648 | 26.30 | 43.77 | 25.18 | 0.73a | 32.88 | 0.93a | 17.48 | 0.53a |
| 9 | 40437 | Riyadh ∗ | 614 | 24.93 | 46.72 | 25.71 | 0.64a | 33.37 | 0.35a | 18.05 | 0.93a |
| 10 | 40373 | Al-Qaisumah | 358 | 28.32 | 46.13 | 25.58 | 0.55a | 32.99 | 0.62a | 18.18 | 0.47a |
| 11 | 40417 | Dammam | 22 | 26.45 | 49.82 | 27.36 | 0.40a | 34.48 | 0.10 | 20.24 | 0.70a |
| 12 | 40420 | Al-Ahsa ∗ | 179 | 25.30 | 49.48 | 27.51 | 0.68a | 35.17 | 0.71a | 19.85 | 0.65a |
| 13 | 40400 | Al-Wejh | 20 | 26.20 | 36.48 | 25.25 | 0.49a | 30.21 | 0.51a | 20.30 | 0.48a |
| 14 | 40430 | Madinah | 654 | 24.55 | 39.70 | 28.37 | 0.47a | 35.04 | 0.33a | 21.69 | 0.60a |
| 15 | 40439 | Yenbo | 8 | 24.13 | 38.07 | 28.04 | 0.58a | 34.81 | 0.67a | 21.28 | 0.50a |
| 16 | 41024 | Jeddah | 15 | 21.70 | 39.18 | 28.90 | 0.41a | 34.54 | 0.15 | 23.26 | 0.67a |
| 17 | 41036 | Taif | 1478 | 21.48 | 40.55 | 23.20 | 0.41a | 30.07 | 0.56a | 16.33 | 0.26a |
| 18 | 41030 | Makkah ∗ | 240 | 21.43 | 39.77 | 31.68 | 0.76b | 37.91 | 0.60b | 24.71 | 0.89a |
| 19 | 41055 | Al-Baha ∗ | 1672 | 20.30 | 41.65 | 23.27 | 0.45a | 29.63 | 0.49a | 16.92 | 0.42a |
| 20 | 41140 | Gizan | 6 | 16.88 | 42.58 | 30.79 | 0.24a | 35.26 | 0.08 | 26.32 | 0.40a |
| 21 | 41114 | Khamis Mushait | 2066 | 18.30 | 42.80 | 20.11 | 0.67a | 27.15 | 0.50a | 13.08 | 0.84a |
| 22 | 41112 | Abha | 2090 | 18.23 | 42.65 | 19.22 | 0.62a | 25.80 | 0.62a | 12.64 | 0.62a |
| 23 | 41084 | Bisha | 1167 | 19.98 | 42.63 | 25.35 | 0.51a | 33.51 | 0.50a | 17.20 | 0.53a |
| 24 | 41128 | Najran | 1214 | 17.62 | 44.42 | 25.21 | 0.54a | 33.10 | 0.65a | 17.31 | 0.42a |
| 25 | 41136 | Sharorah ∗ | 720 | 17.47 | 47.10 | 27.90 | 0.38a | 36.14 | 0.28a | 19.67 | 0.48a |
| Country | 24.64 | 0.63a | 31.67 | 0.60a | 17.62 | 0.64a | |||||
- ∗Stations start from year 1985. The superscripts a, b, and c represent statistical significance at 99%, 95%, and 90% levels, respectively.
2.3. Data Analysis
The climate indices are calculated using the RClimDex developed by Zhang and Yang [44]. The RClimDex can calculate a total of 27 indices, including temperature and precipitation indices, of which only 11 are computed using temperature data. Following Choi et al. [1] and Almazroui et al. [38], the average value plus 5°C is used as a user-defined threshold temperature for each station to run the RClimDex. Note that user-defined temperature is sensitive to only four threshold indices: ice days (ID0, daily maximum temperature <0°C), frost days (FD0, daily minimum temperature <0°C), summer days (daily maximum temperature >25°C), and tropical nights (daily minimum temperature >20°C), and one duration index: growing season (GSL, six days with mean temperature >5°C after 1st July for six days with mean temperature <5°C), which are not analyzed in this study due to the specific climatic characteristics of Saudi Arabia.
The outcomes of air temperature indices were analyzed through the linear trends. The linear trends and their statistical significance are also calculated using the regression equation and F-test for each station at annual and seasonal scales, respectively [35, 40]. For temperature, the four standard seasons winter (DJF), spring (MAM), summer (JJA), and autumn (SON) are used in this study. In addition to linear regression, the nonparametric Mann–Kendall and Sen’s slope test are also used to determine the sign of the slope and the significance of the linear trends [46–49]. The average of all stations provides the daily maximum and minimum temperatures used to calculate the national average index of the country.
This study focuses on a few extreme values (absolute), relative (percentiles), and duration indices, which are particularly important for the region and recommended by the Expert Team on Climate Change Detection and Indices (ETCCDI, [45]). Among the absolute indices, the study focuses on five of them (Table 2). Besides these five extreme value indices, 22 absolute thresholds are used to calculate temperature extremes. These absolute indices are TX ≥ 40°C to TX ≥ 50°C and TN ≤ 10°C to TN ≤ 0°C at an interval of 1°C. The absolute threshold indices are used to understand the number of days when Saudi Arabia was above or below a particular temperature. On the contrary, seven relative and two duration indices are focused on Table 2. Note that, for relative indices, the value of the percentage of days metric is converted to number of days [38, 41, 50, 51].
| Index | Indicator name | Definition | Unit |
|---|---|---|---|
| Absolute indices | |||
| TXx | Maximum of maximum temperatures | Monthly maximum value of daily maximum | °C |
| TNx | Maximum of minimum temperatures | Monthly maximum value of daily minimum | °C |
| TXn | Minimum of maximum temperatures | Monthly minimum value of daily maximum | °C |
| TNn | Minimum of minimum temperatures | Monthly minimum value of daily minimum | °C |
| DTR | Diurnal temperature range | The difference between the maximum and minimum temperature | °C |
| Relative indices | |||
| TX90p | Warm days | Percentage of days when TX > 90th percentile | Days |
| TX95p | Very warm days | Percentage of days when TX > 95th percentile | Days |
| TX99p | Extreme warm days | Percentage of days when TX > 99th percentile | Days |
| TN90p | Warm nights | Percentage of days when TN > 90th percentile | Days |
| TN90p | Very warm nights | Percentage of days when TN > 90th percentile | Days |
| TN90p | Extreme warm nights | Percentage of days when TN > 90th percentile | Days |
| TX10p | Cold days | Percentage of days when TX < 10th percentile | Days |
| TN10p | Cold nights | Percentage of days when TN < 10th percentile | Days |
| Duration indices | |||
| WSDI | Warm spell duration | Annual count of days with at least 6 consecutive days when TX > 90th percentile | Days |
| CSDI | Cold spell duration | Annual count of days with at least 6 consecutive days when TN < 10th percentile | Days |
3. Results and Discussion
3.1. Temperature Climatology
The temperature in Saudi Arabia varies from region to region: with low temperature in the north and southeast and high temperature in the central and coastal regions along the Red Sea and the Arabian Gulf [25, 27]. For brevity, the spatial distribution of temperature climatology is not shown in this study (for instance, see [25, 27]). Station-wise temperatures and their associated linear trend values are shown in Table 1. The annual mean temperature (TM) of the country is 24.64°C and is the lowest in the northern station of Turaif (19.10°C) and the highest in the western station of Makkah (31.69°C). Maximum temperature (TX) ranges from 25.80°C (Abha) to 37.91°C (Makkah), while the average is 31.67°C for the country. Minimum temperature (TN) ranges from 11.90°C (Gurait) to 26.32°C (Gizan), while the average is 17.62°C for the country. The annual mean maximum and minimum temperatures over Saudi Arabia show an increasing gradient from north to south (Table 1).
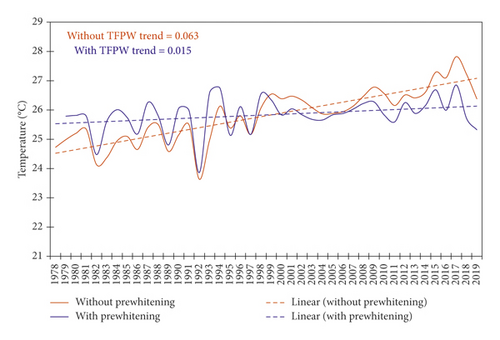
Linear regression analysis shows that, for the entire period 1978–2019, the warming rate is higher for TN (0.64°C per decade) than TX (0.60°C per decade), while the mean temperature is increasing at the rate of 0.63°C per decade (Figure 2 and Table 1). The linear trends are significant at 99% level of confidence. The Mann–Kendall test shows the trend for TM, TX, and TN as 0.58, 0.56, and 0.65°C per decade, respectively. Hence, the Mann–Kendall test indicates a very similar linear trend and significance, and so, for brevity, the results are not shown. The author then employed the trend-free prewhitening (TFPW) method [52, 53] for removing the effects of any positive autocorrelation in temperature time series for linear trend detection. TFPW provides the trend slope estimation and removes the trend component and reinstalls the trend component prior to the application of Mann–Kendall test. However, in the presence of positive serial correlation coefficient, the variance of slope estimator is rather exaggerated. The author found that, with the use of the TFPW method, the magnitude of the temperature linear trend reduced to almost one-fourth, compared to nonuse of the TFPW method. Sample time series data from one station are shown in Figure 3. Furthermore, it is observed that the temperature time series follows the normal distribution assumption. Therefore, the linear trend is used throughout the rest of the manuscript. This is necessary to make this study comparable with other studies in the literature.
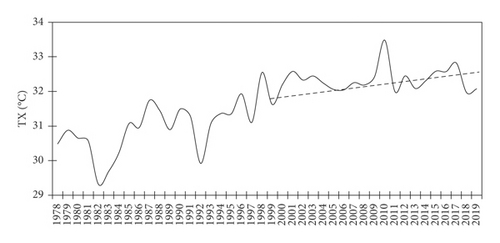
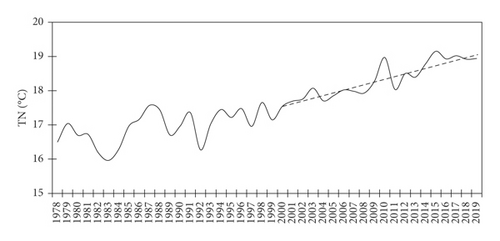
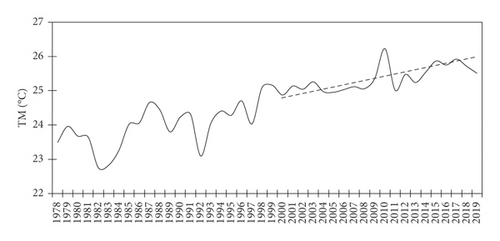
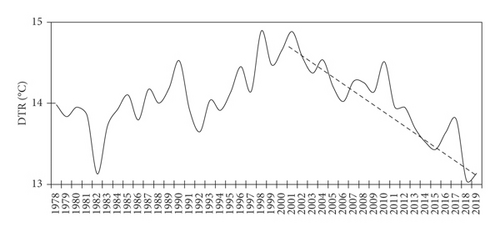
It is important to note that the rates of increase in maximum and minimum temperatures for the period 1978–2019 are different from those obtained by an earlier study for the period 1978–2009 [27], who reported a higher rate of increase (0.71°C per decade) for TX than for TN (0.48°C per decade). The difference in the temperature range (DTR) shows an obvious decreasing linear trend (−0.78°C per decade) in the last second period (2000–2019). In fact, in the second period, 2000–2019, the rate of increase in TX is slower (0.03°C per decade) than the rate of increase (0.81°C per decade) in TN. The faster increase in TN than of TX is also reported in Iraq [31]. Hence, there are clear indications of climate warming in the country, and substantially, more warming occurs in the wintertime than in the summertime.
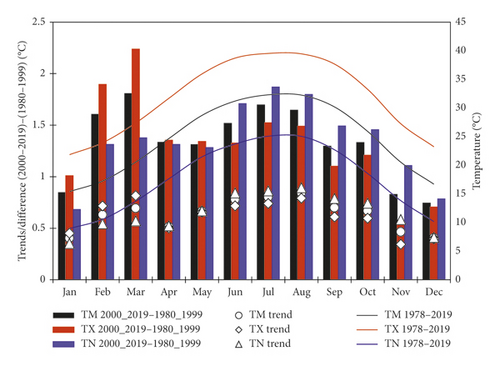
The country-average monthly temperature climatology for the period 1978–2019 is shown in Figure 4. As expected, the annual temperature cycle over Saudi Arabia is higher in the summer and lower in the winter months. The TX is increasing at a higher rate in January-March, while the TN is increasing at a higher rate in June-November. The highest rate of increase in TX is observed in March (0.82°C per decade) and in August (0.89°C per decade) for TN. The temperature difference between the second period 2000–2019 and the first period 1980–1999 indicates that the increase in TX is highest in March (2.24°C) followed by February (1.90°C) and lowest in November (0.55°C). For the TN, the highest increase observed is in July (1.87°C) followed by August (1.08°C) and lowest in January (0.68°C).
3.2. Extreme Value Indices
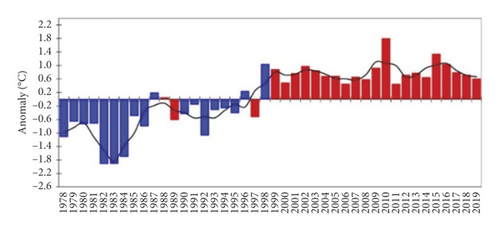
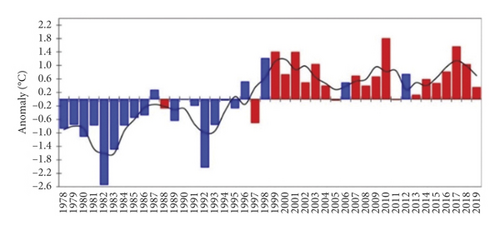
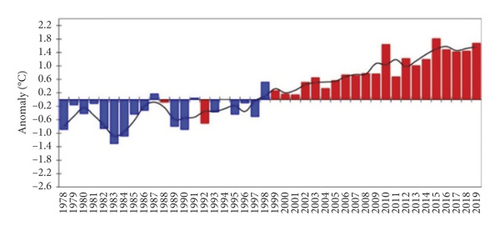
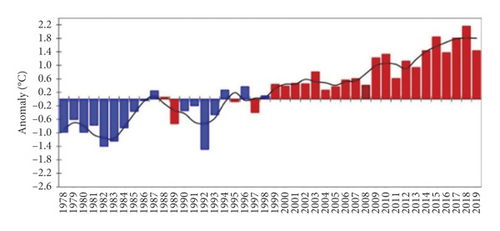
Observations indicate that the maximum of maximum temperatures (TXx) is above normal for all years after 1997 (Figure 5). It was below normal before that except for 1987, 1988, and 1995. The minimum of maximum temperatures (TXn) is above normal after 1998 except for 2006 and 2011. It was below normal for all years before that except for 1987 and 1996. For both TXx and TXn, the largest increase is found in 2010. The maximum of minimum temperatures (TNx) is above normal after 1998 and is below normal before then except for 1987 and 1991. In the case of the minimum of minimum temperatures (TNn), it is found to be above normal after 1998, where it is below normal before 1998, except for 1987, 1988, 1994, and 1996. Hence, it is evident that a large increase in temperature occurred in the second period compared to the first period.
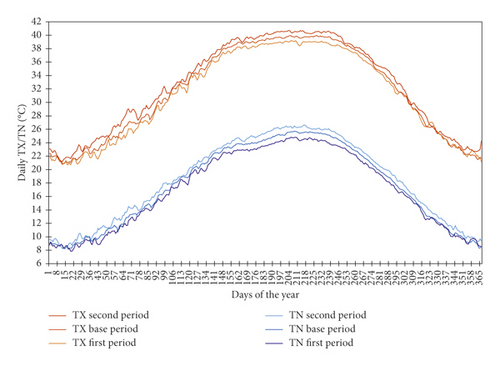
As shown in Figure 6, both TX and TN are warmer for the second period (2000–2019) than for the base period (1981–2010), which is normal, while cooler in the first period (1980–1999). There is a clear indication of summertime warming in the second period for both TX and TN, while a change in the usual wintertime cooling is not observed.
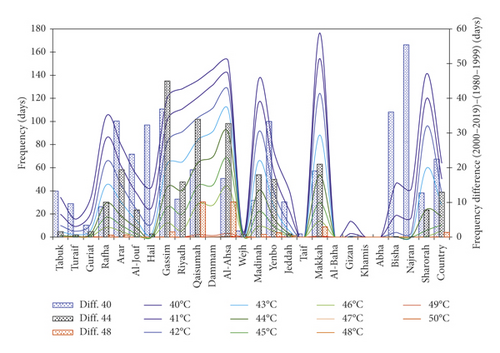
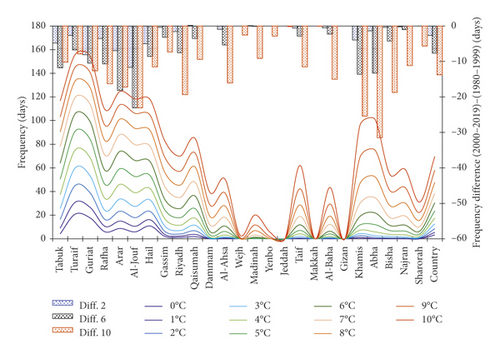
The number of extreme days above and below some temperature thresholds, along with the difference in numbers in the second period compared to the first period at each station, is shown in Figure 7. The frequency of TX above different absolute thresholds for the 25 stations in Saudi Arabia indicates that extreme temperature highs occur at most of the stations except for Wejh, Taif, Al-Baha, Gizan, Khamis, and Abha (Figure 7(a) and Table 3). Extreme temperature highs occur mainly at Rafha, Gassim, Riyadh, Qasumah, Dammam, Al-Ahsa, Madinah, Yenbo, Makkah, and Sharorah.
| Station | ≥40°C | ≥41°C | ≥42°C | ≥43°C | ≥44°C | ≥45°C | ≥46°C | ≥47°C | ≥48°C | ≥49°C | ≥50°C |
|---|---|---|---|---|---|---|---|---|---|---|---|
| Tabuk | 6.65a | 4.50a | 3.32a | 1.70a | 0.58b | 0.17 | 0.06 | 0.00 | 0.00 | 0.00 | 0.00 |
| Turaif | 4.73a | 3.24a | 1.94a | 0.77b | 0.17 | 0.02 | 0.00 | 0.00 | 0.00 | 0.00 | 0.00 |
| Guriat ∗ | 2.55a | 3.22c | 2.39c | 1.13 | 0.44a | −0.01 | 0.04 | −0.03 | 0.01 | 0.01 | 0.00 |
| Rafha | 5.61a | 7.76a | 8.55a | 7.97a | 5.44a | 3.48b | 1.66c | 0.52 | 0.03 | −0.03 | 0.00 |
| Arar | 14.64a | 15.25a | 14.21a | 11.73a | 8.41a | 5.83a | 3.09a | 1.13c | 0.26 | 0.02c | 0.00 |
| Al-Jouf | 12.88a | 11.30a | 9.18a | 6.55a | 4.19a | 1.62a | 0.38 | 0.07 | 0.00 | 0.00 | 0.00 |
| Hail | 15.39a | 11.33a | 6.42a | 1.87a | 0.27c | 0.02 | 0.02 | 0.00 | 0.00 | 0.00 | 0.00 |
| Gassim | 17.89a | 22.59a | 25.85a | 26.29a | 21.55a | 15.05a | 8.13a | 3.16a | 0.74 | 0.00 | 0.00 |
| Riyadh ∗ | 5.27a | 7.03a | 9.26a | 9.08a | 7.94a | 4.17c | 1.31 | 0.16 | 0.02 | 0.00 | 0.00 |
| Al-Qaisumah | 8.92a | 11.18a | 13.51a | 16.78a | 16.46a | 15.03a | 11.08a | 7.29a | 4.68a | 1.48a | 0.13b |
| Dammam | −2.24 | 1.20 | 2.11 | 4.17 | 2.69 | 2.20 | 1.88 | 1.11 | 0.62 | −0.02 | −0.06 |
| Al-Ahsa ∗ | 7.54a | 9.22a | 9.96a | 13.44a | 16.41a | 18.17a | 15.69a | 11.05a | 5.47a | 1.83a | 0.45b |
| Al-Wejh | 0.71 | 0.44 | 0.30 | 0.19 | 0.19c | 0.10 | −0.05 | 0.00 | 0.03 | 0.00 | 0.00 |
| Madinah | 4.27a | 6.70a | 8.73a | 9.60a | 8.53a | 4.89a | 3.16b | 1.22b | 0.30 | 0.01 | 0.00 |
| Yenbo | 18.36a | 14.16a | 12.29a | 10.06a | 7.51a | 4.92a | 2.75b | 1.57b | 0.55 | 0.18b | 0.00 |
| Jeddah | 4.15c | 2.92b | 1.00 | 0.26 | 0.21 | 0.39c | 0.11 | 0.14 | 0.11 | 0.06 | 0.06 |
| Taif | 0.46 | 0.04 | 0.00 | 0.00 | 0.00 | 0.00 | 0.00 | 0.00 | 0.00 | 0.00 | 0.00 |
| Makkah ∗ | 10.88b | 13.95a | 17.52a | 16.99a | 11.66a | 8.30a | 5.01b | 2.88a | 1.56a | 0.62a | 0.22a |
| Al-Baha ∗ | 0.00 | 0.00 | 0.00 | 0.00 | 0.00 | 0.00 | 0.00 | 0.00 | 0.00 | 0.00 | 0.00 |
| Gizan | −1.12 | −0.36 | 0.06 | −0.02 | 0.01 | 0.00 | 0.01 | 0.00 | 0.00 | 0.00 | 0.00 |
| Khamis Mushait | 0.00 | 0.00 | 0.00 | 0.00 | 0.00 | 0.00 | 0.00 | 0.00 | 0.00 | 0.00 | 0.00 |
| Abha | 0.00 | 0.00 | 0.00 | 0.00 | 0.00 | 0.00 | 0.00 | 0.00 | 0.00 | 0.00 | 0.00 |
| Bisha | 16.27a | 7.61a | 1.87b | 0.24a | 0.03 | 0.00 | 0.00 | 0.00 | 0.00 | 0.00 | 0.00 |
| Najran | 22.18a | 11.59a | 3.19a | 0.37b | −0.02 | 0.00 | 0.00 | 0.00 | 0.00 | 0.00 | 0.00 |
| Sharorah ∗ | 7.04a | 8.52a | 10.64a | 10.77a | 7.50a | 2.59c | 0.27 | 0.00 | 0.00 | 0.00 | 0.00 |
| Country | 11.37a | 10.52a | 9.43 | 8.06a | 6.17a | 4.23a | 2.53a | 1.32b | 0.59b | 0.17b | 0.03 |
- The superscripts a, b, and c represent statistical significance at 99%, 95%, and 90% levels, respectively. ∗Station name start year 1985.
The difference in the number of TX days between the second and the first periods shows that there is an apparent increase in extreme warm days. A large increase in days ≥40°C is observed for some northern (e.g., Arar, Al-Jouf, Hail, and Gassim), western (e.g., Yenbo and Makkah), and southern (Bisha and Najran) stations. The most significant increase in extreme days ≥44°C is observed for Gassim, Qasumah, Al-Ahsa, and Makkah. In the case of ≥48°C, the most substantial increase in extreme days is for Qaisumah and Al-Ahsa.
There is a high frequency of TN in the northern stations and a few southern stations. TN frequency is almost zero for Wejh, Yenbo, Jeddah, Makkah, and Gizan (Figure 7(b) and Table 4). The difference in TN frequency between the second period and the first period clearly shows a decrease in extreme cold days. The largest decrease ≤10°C, ≤6°C, and ≤2°C is observed in southwestern Abha, Khamis, and Bisha and in many northern (e.g., Al-Jouf, Arar, and Rafha) and central stations (e.g., Hail, Riyadh, and Al-Ahsa). The increase in TX extreme days and decrease in TN extreme days in the last two decades is an indicator of warming of the country occurring mainly in the northern, central, and southwestern regions.
| Station | ≤10°C | ≤9°C | ≤8°C | ≤7°C | 6≤°C | ≤5°C | ≤4°C | ≤3°C | ≤2°C | ≤1°C | ≤0°C |
|---|---|---|---|---|---|---|---|---|---|---|---|
| Tabuk | −5.48a | −5.79a | −5.92a | −6.82a | −7.02a | −6.85a | −5.94a | −4.82a | −2.93b | −1.65c | −0.98 |
| Turaif | −3.38a | −2.82b | −2.68c | −3.23b | −2.64c | −3.04b | −2.60c | −2.39 | −1.92 | −1.68 | −0.62 |
| Guriat ∗ | −7.29a | −7.05a | −7.54a | −7.97a | −7.22a | −6.20a | −5.37b | −5.17a | −5.22b | −4.12b | −3.32b |
| Rafha | −9.46a | −9.07a | −9.15a | −8.33a | −7.41a | −6.45a | −4.96a | −3.25b | −2.26b | −1.50c | −1.00 |
| Arar | −7.29a | −7.68a | −8.25a | −9.05a | −9.51a | −9.01a | −7.58a | −6.19a | −4.59b | −2.56b | −1.82b |
| Al-Jouf | −11.70a | −11.44a | −12.32a | −12.74a | −12.16a | −11.60a | −9.70a | −7.28a | −5.61b | −3.72a | −1.95b |
| Hail | −5.46a | −6.01a | −6.28a | −6.30a | −5.78a | −4.74a | −4.23a | −3.54b | −3.22b | −2.22b | −1.23 |
| Gassim | −3.53b | −3.73b | −3.34b | −2.55 | −2.15 | −1.51 | −1.56 | −1.06 | −0.13 | 0.10 | 0.06 |
| Riyadh ∗ | −10.95a | −8.63a | −8.39a | −5.90a | −5.31a | −4.12a | −3.29a | −2.16a | −1.16c | −0.88c | −0.31 |
| Al-Qaisumah | −3.32b | −2.97c | −2.30 | −2.33 | −1.66 | −0.89 | −0.40 | 0.14 | −0.06 | 0.04 | 0.00 |
| Dammam | −6.74b | −6.10b | −5.10a | −2.77 | −1.64 | −0.51 | −0.29 | 0.17 | 0.12 | −0.01 | 0.00 |
| Al-Ahsa ∗ | −7.79a | −6.82a | −5.45a | −3.86a | −2.65b | −1.73c | −1.29c | −0.86 | −0.50 | −0.33c | −0.11 |
| Al-Wejh | −0.89 | −0.28 | −0.05 | −0.03 | −0.01 | 0.00 | 0.00 | 0.00 | 0.00 | 0.00 | 0.00 |
| Madinah | −4.68a | −2.51b | −1.04 | −0.32 | 0.01 | −0.02 | −0.03 | 0.00 | 0.03 | 0.02 | 0.00 |
| Yenbo | −1.02 | −0.34 | −0.02 | −0.03 | −0.02 | −0.02 | 0.00 | 0.00 | 0.00 | 0.00 | 0.00 |
| Jeddah | −0.04 | 0.00 | 0.00 | 0.00 | 0.00 | 0.00 | 0.00 | 0.00 | 0.00 | 0.00 | 0.00 |
| Taif | −2.68 | −2.48 | −1.27 | −0.62 | −0.77 | −0.65 | −0.36 | −0.16 | −0.12 | −0.04 | 0.01 |
| Makkah ∗ | −0.03 | 0.00 | 0.00 | 0.00 | 0.00 | 0.00 | 0.00 | 0.00 | 0.00 | 0.00 | 0.00 |
| Al-Baha ∗ | −7.53a | −4.83a | −2.56c | −1.66 | −1.23 | −1.14c | −0.87b | −0.45c | −0.28c | −0.11 | −0.03 |
| Gizan | 0.00 | 0.00 | 0.00 | 0.00 | 0.00 | 0.00 | 0.00 | 0.00 | 0.00 | 0.00 | 0.00 |
| Khamis Mushait | −18.95a | −18.32a | −15.28a | −13.38a | −10.86a | −8.13a | −5.83a | −3.71a | −2.59a | −1.23a | −0.38 |
| Abha | −15.51a | −12.88a | −11.13a | −9.12a | −6.45a | −3.63a | −1.97a | −1.09a | −0.58a | −0.16c | −0.07b |
| Bisha | −7.15a | −6.30a | −4.48a | −3.20a | −1.87b | −0.46 | −0.18 | −0.26 | −0.12 | −0.06 | −0.04 |
| Najran | −4.15a | −3.28b | −1.99 | −1.68 | −0.59 | 0.05 | 0.01 | −0.02 | −0.05 | −0.16 | −0.04 |
| Sharorah ∗ | −2.57 | −0.95 | 0.08 | −0.24 | 0.29 | 0.21 | 0.35 | 0.45 | 0.20 | 0.06 | 0.00 |
| Country | −6.57a | −5.90a | −5.27a | −4.80a | −4.15a | −3.39a | −2.67a | −1.97a | −1.41a | −0.87b | −0.48c |
- The superscripts a, b, and c represent statistical significance at 99%, 95%, and 90% levels, respectively. ∗Station name start year 1985
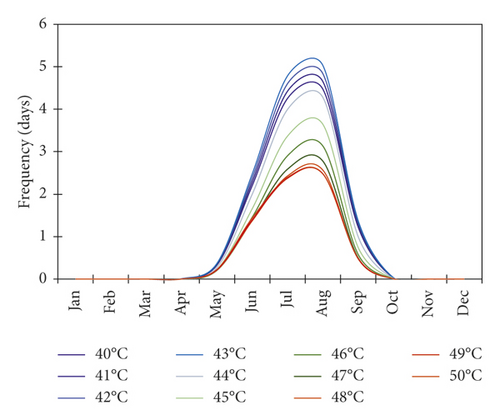
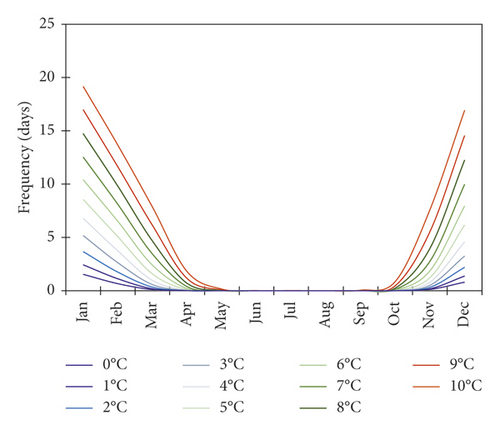
Analysis of the annual cycle of TX extreme days indicates that the frequency is highest in summer (May-September) and is almost zero in winter (Figure 8(a)). The highest TX frequency is observed in August from 3 days (≥50°C) to 5 (≥40°C) days. For TN extreme days, a situation opposite to TX extreme days is observed and TN frequency is higher between November and March and is almost nil in summer (Figure 8(b)). The highest TN frequency is observed in January from 2 (≤0°C) to 20 (≤10°C) days. The increased number of TX extreme days in the summertime and TN extreme days in the wintertime are observed over the country.
3.3. Relative Indices
The spatial pattern of changes in temperature extremes is analyzed using the daily time series indices from each station. As discussed, the observed linear trend patterns in the number of warm days/nights and cold days/nights are enhanced during the second period when compared to the first period, similar to what were observed for the maximum and minimum temperatures (see Figure 5). The spatial distribution of cold days (TX10p), warm days (TX90p), cold nights (TN10p), and warm nights (TN90p) shows that warm nights are the most frequent (Figure 9). There is less spatial variability between the extremes; however, more cold days are observed (TX10p) across southwestern regions compared to the central and northern regions (Figure 9(a)). Warm days (TX90p) are more prevalent in the central, northern, and eastern parts (Figure 9(b)). Similarly, cold nights (TN10p) are more frequent in the central and northeastern parts (Figure 9(c)), while warm nights (TN90p) are more frequent in the northern and coastal regions (Figure 9(d)).
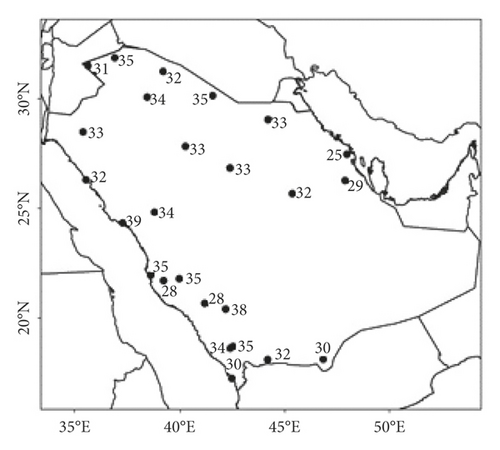
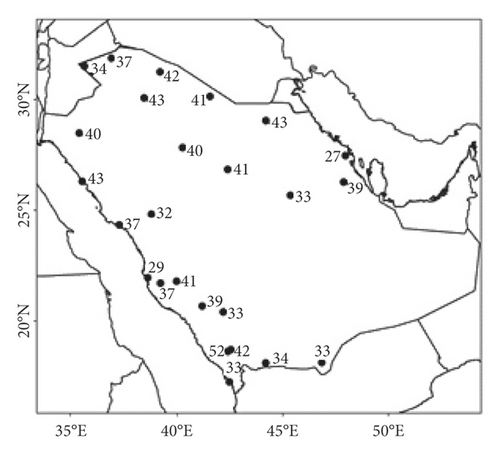
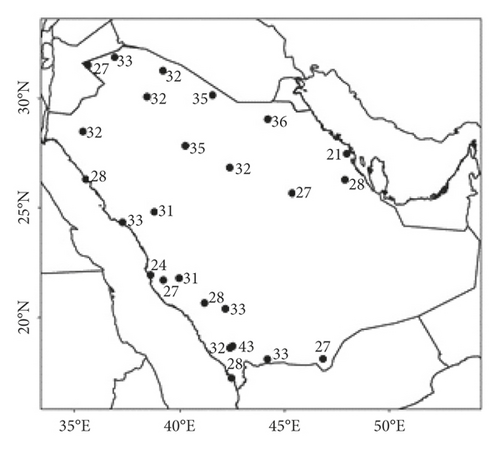
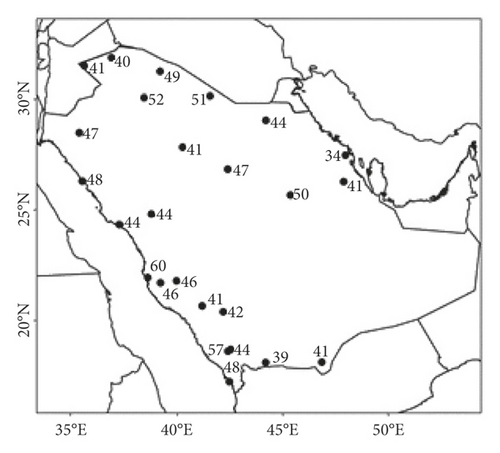
The rate of increase in warm days/nights is highest in the central, eastern, and southwestern regions (Figures 10(b) and 10(d). The warm days have highest increase of 30 days per decade at Abha, while warm nights highest increase is about 40 days per decade at Dammam (Figures 10(b) and 10(d)). The linear trend of a decreasing number of cold days is largest in the northern, central-western, and southern regions, and the rate of decrease in cold nights is similar. The cold days highest decrease occurs over 19 days per decade at Yenbo, while cold nights highest decrease have 37 days per decade at Khamis Mushait (Figures 10(a) and 10(c)). There is homogeneity in the linear trend patterns of cold (warm) days from north to south over Saudi Arabia as cold (warm) days follow significantly decreasing (increasing) linear trends (Figures 10(a) and 10(b)). Cold days/nights in Dammam represent an exception as they increase in number rather than decrease. This might be due to the short analysis limited to the years since this station started operations in 1999.
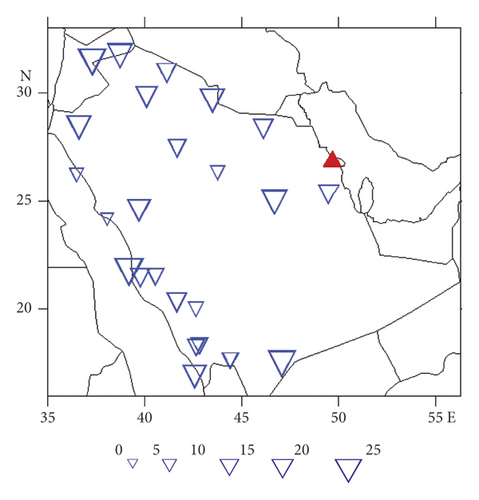
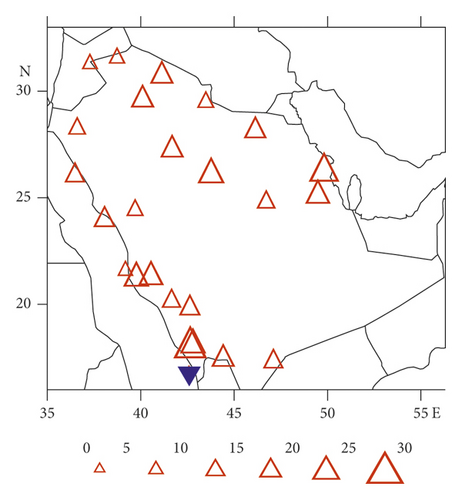
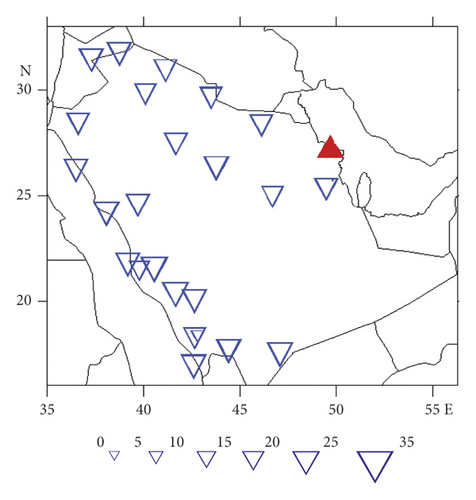
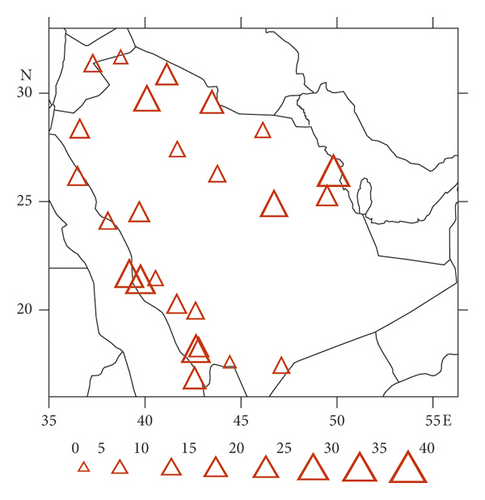
Similarly, homogeneity is also observed in the pattern of significantly decreasing (increasing) linear trends of cold (warm) nights over Saudi Arabia (Figures 10(c) and 10(d)). An exception is observed for warm nights at the southwest station (Gizan), which exposes a decrease instead of an increase. This discrepancy is due to the characteristics of the station, as reported by Islam et al. [41].
Statistical analysis of time series indices shows a high variation in the linear trend of extremes at each station (Table 5). Homogeneity is evident in linear trends from north to south over Saudi Arabia for cold/warm days and cold/warm nights. For example, the linear trend in Abha (Gizan) in the southwestern region shows the highest increase (lowest decrease) of warm days (Table 5). Similarly, the linear trends in Dammam in the eastern region and Najran in the southwestern region imply the highest increase (lowest decrease) on warm nights.
| Station | TN10p | TX10p | TN90p | TN95p | TN99p | TX90p | TX95p | TX99p |
|---|---|---|---|---|---|---|---|---|
| Tabuk | −14.47a | −7.74a | 18.48a | 10.70a | 3.53a | 7.18a | 4.27a | 1.56a |
| Turaif | −11.19a | −7.00a | 9.54a | 5.91a | 2.45a | 4.65b | 3.26a | 1.38b |
| Guriat | −11.57a | −4.66b | 15.73a | 9.09a | 3.24a | 3.82c | 2.58c | 0.52 |
| Rafha | −15.71a | −7.60a | 25.38a | 16.12a | 5.30a | 5.76a | 3.56b | 1.74b |
| Arar | −12.97a | −12.16a | 22.98a | 15.31a | 4.67a | 15.58a | 9.92a | 3.52a |
| Al-Jouf | −16.76a | −10.83a | 29.97a | 20.39a | 7.40a | 15.33a | 10.96a | 4.49a |
| Hail | −14.25a | −13.64a | 12.54a | 8.21a | 2.80a | 15.49a | 9.37a | 2.73a |
| Gassim | −10.27a | −17.35a | 14.49a | 9.64a | 3.53a | 20.49a | 12.23a | 3.71a |
| Riyadh | −16.19a | −7.00a | 31.20a | 20.74a | 6.87a | 8.33a | 4.49b | 1.29 |
| Al-Qaisumah | −14.11a | −12.11a | 12.18a | 6.17a | 1.63a | 14.11a | 9.40a | 3.57a |
| Dammam | 7.60c | 15.02b | 40.09a | 23.74a | 0.00 | 25.85a | 14.84a | 0.00 |
| Al-Ahsa | −13.59a | −12.66a | 21.21a | 12.68a | 3.30a | 17.83a | 11.09a | 3.20a |
| Al-Wejh | −11.93a | −17.83a | 18.53a | 12.15a | 4.49a | 11.23a | 4.44a | 1.59a |
| Madinah | −11.86a | −9.00a | 20.50a | 12.85a | 4.87a | 5.99a | 3.55b | 1.62a |
| Yenbo | −8.68a | −19.12a | 15.44a | 9.98a | 3.26a | 13.12a | 7.43a | 2.12a |
| Jeddah | −11.34a | −4.16 | 34.09a | 24.54a | 10.98a | 3.42c | 1.73 | 1.11b |
| Taif | −5.34b | −14.68b | 11.95a | 6.87a | 2.85a | 18.25a | 9.89a | 3.11a |
| Makkah | −19.55a | −12.19a | 35.22a | 21.17a | 6.35a | 19.36a | 12.36a | 5.08a |
| Al-Baha | −7.23a | −12.33a | 18.91a | 12.47a | 5.77a | 9.72b | 3.12 | 0.36 |
| Gizan | −10.02a | −8.88a | 23.75a | 14.14a | 3.81a | −4.28 | −3.34 | −1.00 |
| Khamis Mushait | −36.97a | −14.70a | 19.48a | 11.40a | 3.33a | 19.17a | 11.90a | 5.50a |
| Abha | −15.91a | −14.90a | 33.85a | 22.66a | 7.28a | 30.76a | 21.00a | 9.80a |
| Bisha | −10.76a | −16.61a | 15.23a | 9.44a | 3.09a | 12.38a | 6.24a | 1.66b |
| Najran | −11.52a | −15.52a | 7.13a | 3.40a | 0.82c | 15.51a | 8.24a | 2.51a |
| Sharorah | −9.11a | −5.25b | 13.80a | 8.07a | 2.29b | 10.66a | 5.40a | 2.75a |
| Country | −12.55a | −10.52a | 20.87a | 13.11a | 4.16a | 12.79c | 7.52a | 2.56a |
- The superscripts a, b, and c represent statistical significance at 99%, 95%, and 90% confidence level, respectively.
The averaged time series of the annual number of cold days (TX10p), warm days (TX90p), cold nights (TN10p), and warm nights (TN90p) at all stations shows strong warming linear trends between 1978 and 2019 (Figure 11). There is considerable year to year and month to month variability in the frequency of these extremes. In some years, the frequency of cold days/nights is high in winter, while in other years, it is high in summer. In recent decades, the frequency of cold days/nights is high in winter. The frequency of warm days/nights has increased in recent decades, both in summer and winter.
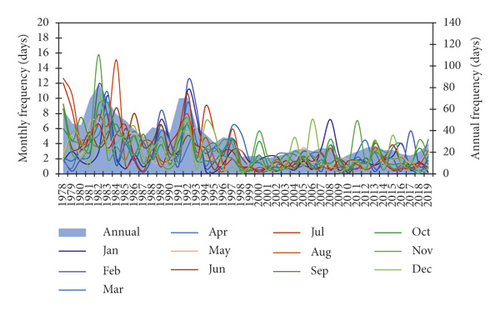
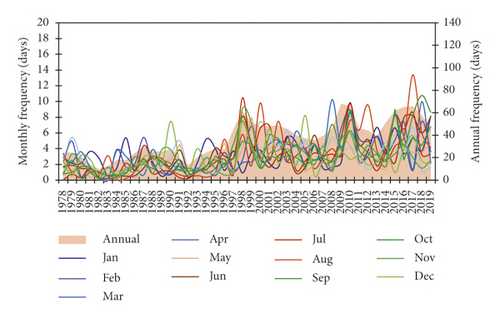
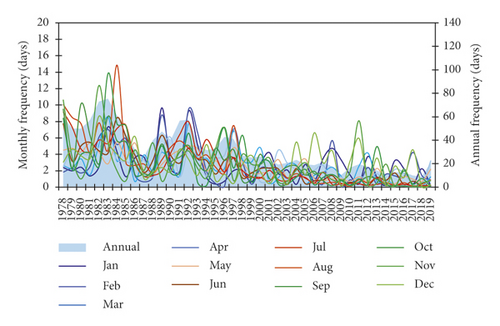
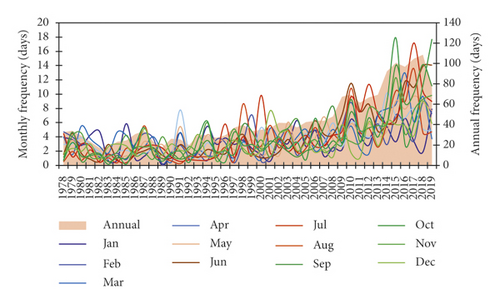
For cold days, the summer (winter) monthly average linear trend is −1.86 (−1.08) and 0.28 (−0.02) days per decade during the period 1980–1999 and 2000–2019, respectively. For warm days, the summer (winter) monthly average linear trend is 1.59 (0.71) and 1.34 (0.71) days per decade during the period 1980–1999 and 2000–2019, respectively. The linear trend of cold nights is −2.03 (−0.50) and −0.87 (−0.59) days per decade for summer (winter) during the period 1980–1999 and 2000–2019, respectively. The linear trend of warm nights is 0.94 (−0.31) and 4.23 (2.78) days per decade for summer (winter) during the period 1980–1999 and 2000–2019, respectively.
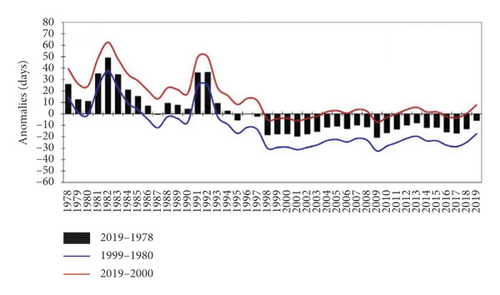
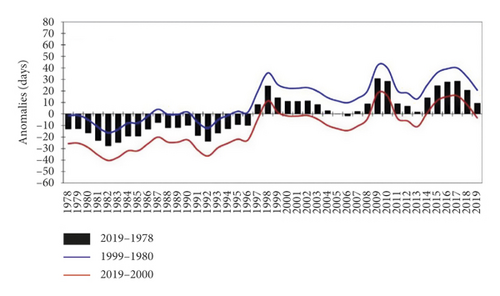
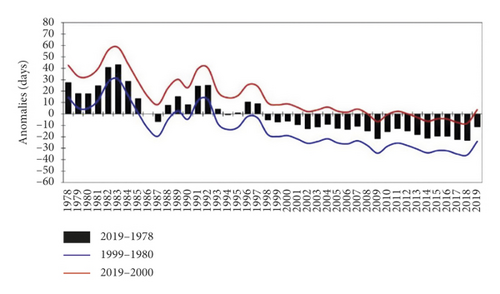
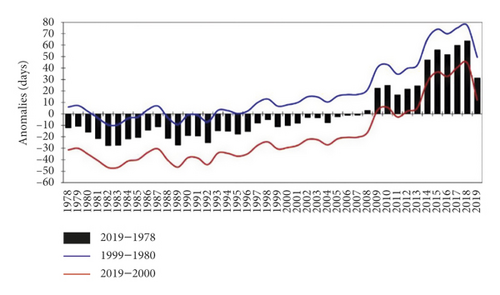
Cold day anomalies relative to the entire period show that the number of cold days is below normal after 1995 although it was above normal before that year (Figure 12(a)). The warm anomalies in the period 2000–2019 and the cold anomalies in the period 1980–1999 present patterns similar to those of 1978–2019 although recent decades indicate a smaller number of cold days during the warm period than in the cold period. Taking warm days for the entire period, all years in the latest decades are above normal except for 2005 and 2006 (Figure 12(b)). The number of cold nights is below normal after 1998 relative to the total period, and there are fewer cold nights in the warm period than in the cold period (Figure 12(c)). The number of warm nights is above normal after 2009, relative to the entire period (Figure 12(d)). To summarize, the results confirm warming in the last decade over Saudi Arabia.
The annual cycle of warm and cold indices, along with their linear trends, is shown in Figure 13. The number of warm days (TX90p), very warm days (TX95p), and extreme warm days (TX99p) is high in July, while the number of cold days (TX10P) is high in August (Figure 13(a)). The number of all types of warm days is found to be increasing, and a higher rate of increase is observed between June and September for TX90p (1.43 days per decade in Sep) as well as for TX95p (0.87 days per decade in Jul), while September showed the highest rate of increase for TX99p (0.32 days per decade). The number of cold days was found to be decreasing, and the most significant decrease (−1.78 days per decade) was observed in August.
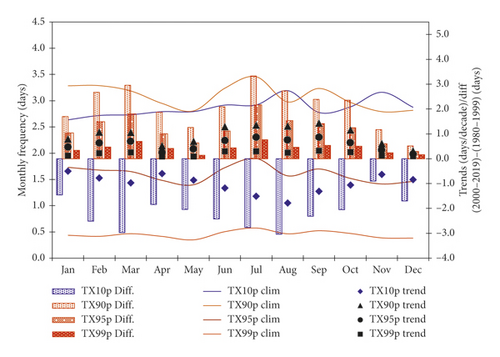
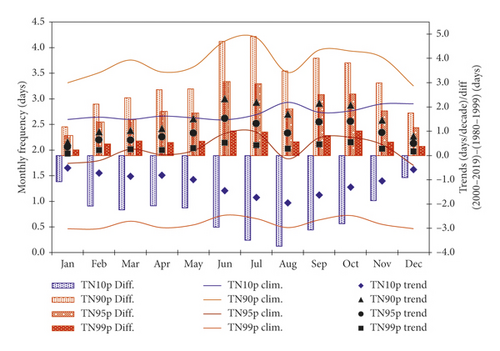
The difference between the second period and the first period indicates that, in recent decades, there are more warm days in Jul-Sep and Feb-Mar and fewer in Nov-Dec and May. There are more cold days in Nov-Jan and fewer in Jul-Aug and Mar. The numbers of warm nights (TN90p), very warm nights (TN95p), and extreme warm nights (TN99p) are high in Jun-Jul and Oct (Figure 13(b)). There is an increase in warm nights and a decrease in cold nights. The increase in warm nights is high in Jun-Jul and Sep-Oct (2.33 days per decade in Jun), while the rate of decrease in cold nights is largest in Jul-Sep (−1.95 days per decade in Aug). The difference between the second and the first periods indicates that warm nights increase more in Jun-Jul and Sep-Oct, while cold nights decrease more in Dec-Jan and decrease less in Jul-Sep. Therefore, these indices show the increased warming over Saudi Arabia in the most recent decade.
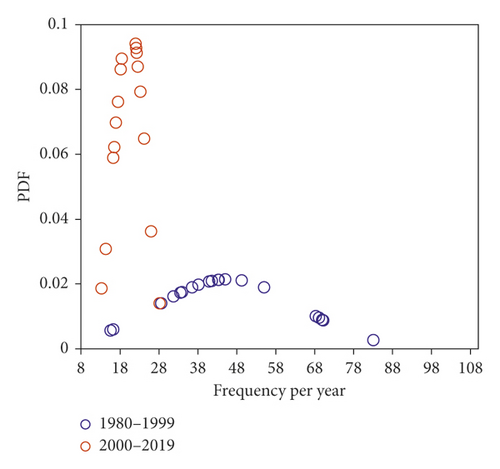
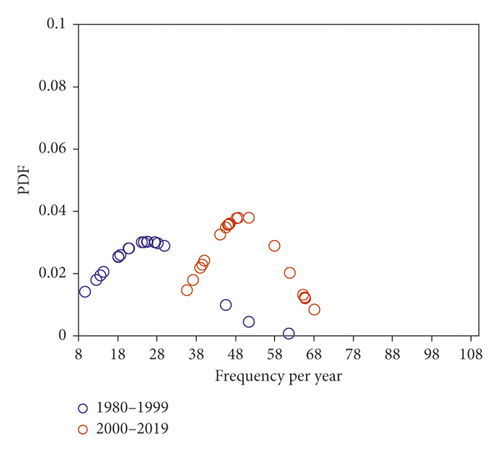
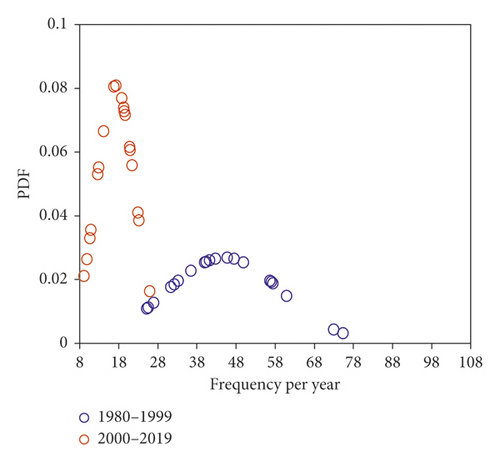
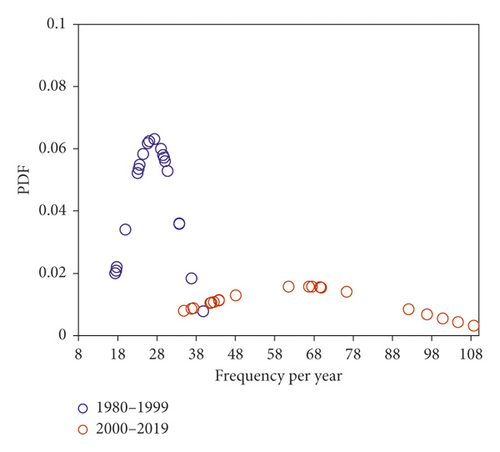
The probability distribution function (PDF) indicates that, in the second period, the cold day variance decreased compared to the first period (Figure 14(a)). Cold day extremes are not evident in recent decades. The warm days PDF shows an increase in the most recent decades as the mean shifted towards warmer temperatures, and higher frequency of TX90p is observed (Figure 14(b)). The variance in the number of cold nights is less in the second period than in the first period, and there is a clear indication of a decrease in cold nights in recent decades (Figure 14(c)). There is a large variance in the number of warm nights, and the mean has shifted towards a higher frequency of them (Figure 14(d)). There is a clear indication of an increase in warm nights in the second period when compared to the first period.
3.4. Duration Indices
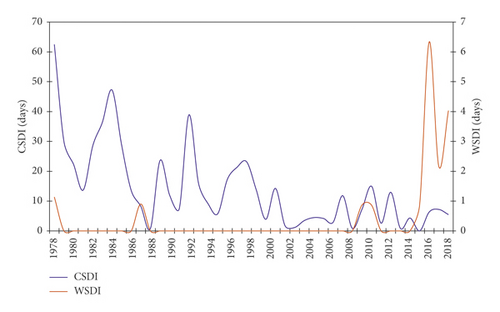
The warm spell duration indicator (WSDI) and cold spell duration indicator (CSDI) reflect that, in the recent period, the average WSDI has increased (0.39 days per decade) insignificantly, and the average CSDI has decreased (7.35 days per decade) significantly (95% level) for the country (Figure 15). In the calculation of WSDI and CSDI, six consecutive days are considered over a duration, which is typical for Saudi Arabia and thus may cause a smaller number of periods of this duration [54]. The CSDI time series implies a pronounced fluctuation between 1978 and 2019. The linear trend is a steady decrease until the start of the 21st century. After 2002, the linear trend of the CSDI time series is weak and becomes almost flat. However, there are nearly no linear trends in the WSDI time series before 2010, but subsequently, there is a sudden rise in the index values after 2015.
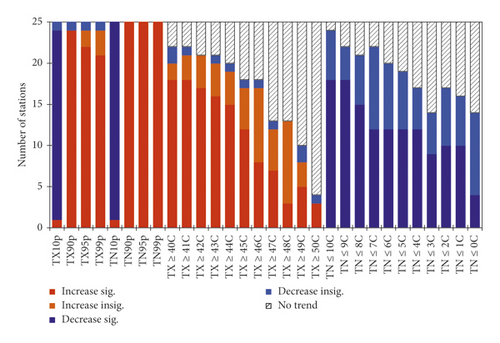
The linear trends of 30 extreme events (Figure 16) exhibit that cold days are decreasing while warm days, very warm days, and extreme warm days are increasing for 24 stations (96%). There is a decrease in cold nights for 24 stations (96%), while there is an increase in warm nights, very warm nights, and extreme warm nights for 25 stations (100%). There is no linear trend for TX ≥ 50°C in 21 stations (84%) and for TX ≥ 49°C in 15 stations (60%). Increasing linear trends for TX ≥ 40°C to TX ≥ 43°C are observed for about 20 stations (80%). On the contrary, decreases in TN ≤ 10°C are found for 24 stations (96%), and decreases in TN ≤ 0°C are seen at 14 stations (56%). All the statistics indicate a significant increase in warming over Saudi Arabia in recent decades. Hence, minimum temperature-based cold extremes are decreasing in most stations, while maximum temperature-based warm extremes are increasing. In other words, there are no linear trends for more stations at high TX extremes (TX ≥ 47°C to TX ≥ 50°C) than at low temperature extremes (TN ≤ 3 to TN ≤ 0°C). Overall, most of the stations indicate a warming climate over Saudi Arabia.
4. Conclusions
- (i)
The mean seasonal and annual temperatures display significantly enhanced positive linear trends over Saudi Arabia in recent decades.
- (ii)
The TN is increasing at a faster rate than the TX, leading to a linear trend of a decreasing DTR.
- (iii)
The magnitude of the warming linear trend is more pronounced in winter as compared to the summer, an opposite result to the one found in the previous study with the data for the period 1978–2009. This has happened because in recent decades, the maximum and minimum temperatures are above normal in most years compared to previous decades.
- (iv)
In the latest 20 years (2000–2019), a large increase in maximum (minimum) temperatures was observed in Feb-Mar (June-Aug) compared to the previous 20 years (1980–1999).
- (v)
All stations show significant warming linear trends for TX90p, TN90p, TX10p, and TN10p.
The results of this study present an overview of the pattern of linear trends in extreme temperatures over Saudi Arabia. Overall, the results indicate that warm extremes have increased during the recent two decades (2000–2019) over Saudi Arabia. The number of warm days/nights has increased, whereas cold days/nights have decreased in the second period compared to the first period decades (1980–1999). Moreover, cold spell duration has also decreased in recent decades. Overall, the increase in temperature extremes will have an impact on environmental sectors, including the water resources, agriculture, power generation, and pilgrims service sectors of the country. The pattern of increasing temperature linear trends, if it continues, will lead to an increase in intensity, frequency, and duration of warm temperature extremes in the future. Furthermore, temperature extremes over Saudi Arabia may also be influenced by the large-scale circulations and diverse topography of the country [55–57]. Therefore, it is expected that future changes in climate and the associated changes in large-scale circulation will also influence extreme temperatures over Saudi Arabia. In this regard, further studies are needed to explore the relationship between large-scale circulations and changes in temperature extremes over Saudi Arabia, along with the use of climate model data.
Disclosure
Computation work described in this paper was performed using Aziz Supercomputer at King Abdulaziz University’s High-Performance Computing Centre, Jeddah, Saudi Arabia.
Conflicts of Interest
The author declares that there are no conflicts of interest.
Acknowledgments
The author would like to acknowledge the Centre of Excellence for Climate Change Research (CECCR), King Abdulaziz University, for supporting this research work. The GAMEP is acknowledged for providing the observational dataset.
Open Research
Data Availability
The data used to support the findings of this study are available from the corresponding author.


