Prediction Model and Experimental Study on Braking Distance under Emergency Braking with Heavy Load of Escalator
Abstract
In order to study the relationship between the braking distance and the load of escalator and realize the prediction of the rated load braking distance with a little load, the method of combining theoretical analysis and experimental research is used. First, the dynamic characteristics of the escalator during emergency braking are analyzed, and the prediction model of the braking distance of the escalator under different loads is derived based on the law of conservation of energy. Furthermore, the influence coefficients under different loads were determined through experimental studies, the model was revised, and the concept of equivalent no-load kinetic energy (ENKE) was proposed. The research shows that the braking distance of the escalator increases nonlinearly with the increase in load. When the no-load braking distance and the 25% rated load braking distance change greatly, the braking distance increases faster as the load increases; the escalators with large brake force have a small ENKE and are easy to stop. Otherwise, it is difficult to stop. The test results show that the comparison between the predicted value of the prediction model and the measured value has a maximum error of 2.7%, and the maximum error at rated load is only 2.0%, which fully meets the needs of engineering measurement. And the prediction method reduces test costs, enhances test security, and improves test coverage.
1. Introduction
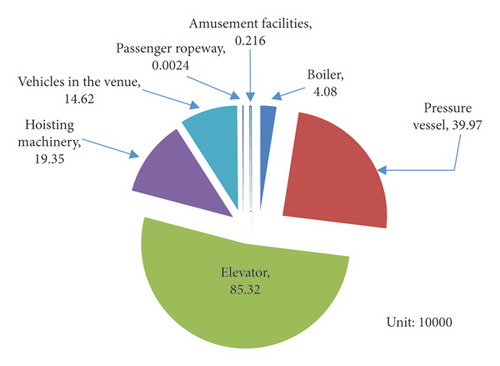
As an important means of transportation in modern buildings, escalator greatly saves physical strength and time and improves traffic efficiency. As a kind of elevator, the escalator is used to transport passengers up or down in an oblique way. It has cyclic steps which are characterized by continuous operation. Compared with the vertical elevator, it has a greater transport capacity and is widely used in airports, shopping malls, stations, and other places with large passenger flow. In recent years, with the rapid development of economy, the number of elevators in China has increased rapidly, especially in the coastal areas. According to the market supervision administration of Guangdong Province website [1], by the end of 2019, the number of special equipment in Guangdong Province was 1.6356 million, 7.33% more than in 2018, 40800 boilers, 399700 pressure vessels, 853200 sets of elevator, 193500 sets of hoisting machinery, 146200 special motor vehicles, 24 passenger ropeways, and large-scale amusement equipment 2160 units (sets), as shown in Figure 1.
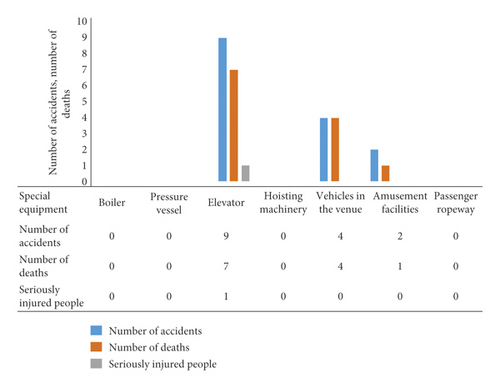
Due to the large amount and high risk, accidents of special equipment occur from time to time. In 2019, there were 15 special equipment accidents in Guangdong Province, including 9 elevator accidents, accounting for 60%. Figure 2 shows the accidents of special equipment in Guangdong Province in 2019. It can be seen that the elevator is not only a large number but also a special equipment with a high incidence of accidents.
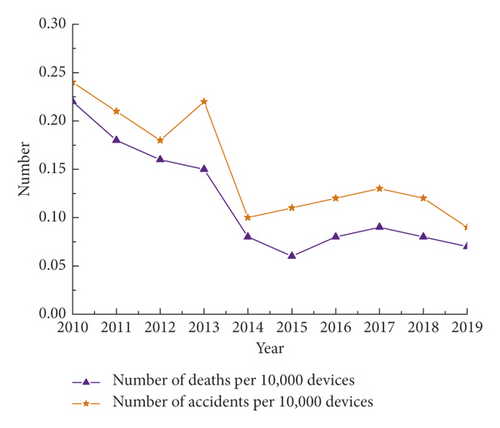
Guangdong Provincial government attaches great importance to the safety of special equipment. With the contribution of technical personnel to safety technology, the deaths number of 10,000 special equipments in Guangdong Province has been decreasing year by year. However, due to the large base, the safety situation is still grim. Figure 3 shows the trend of accidents per 10,000 devices special equipment in Guangdong Province.
As a special equipment, the safety and reliability of escalators have always been the focus of managers and technicians [2–6]. Most escalator accidents occur in crowded public places, causing great personal injury and social impact [7–11]. Therefore, how to prevent accidents and reduce the loss and social impact brought by accidents has been the research direction of scholars in the industry [10, 12–14].
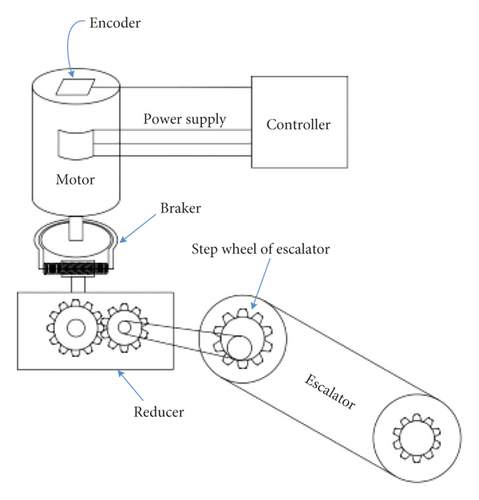
As an important part of escalator safety protection, the brake is used to quickly stop the escalator in the event of an emergency and protect the personal safety to the greatest extent. The principle of the brake is shown in Figure 4. The quality of the brake’s performance directly affects the safety level of escalators [15–17]. Therefore, in order to improve the safety of escalator brake, domestic and foreign scholars have done a lot of research [18–20].
As an important indicator of brake performance, braking distance is a necessary test item for inspection and maintenance [21, 22]. GB16899-2011 5.4.2.1 has clearly stipulated the range of braking distance under different rated speeds and takes the detection items of braking distance into one of the items of escalator safety detection [23]. Table 1 shows the standard values of the braking distances of escalators at different nominal speeds.
| Nominal speeds V0(m/s) | Minimum braking distance Smin(m) | Maximum braking distance Smax(m) |
|---|---|---|
| 0.5 | 0.2 | 1.0a |
| 0.65 | 0.3 | 1.3a |
| 0.75 | 0.4 | 1.5a |
- aExcluding endpoint values.
In Table 1, the minimum braking distance is the limit value with no load, while the maximum braking distance is the limit value with rated load. The traditional rated load test of the braking distance of escalators is mainly carried out by loading. When the escalator comes to an emergency stop under the rated load, the braking distance is measured to judge the braking performance of the brake. Rated load is required during the experiment. Due to the need to reserve the braking distance, the load will generally be concentrated on the upper part of the escalator, which can cause excessive load concentration. There are two problems in the load test: first, it is difficult to carry the weight that is required by the test, and the cost of handling is high; second, the brake performance of the escalator with a long service life may not meet the requirements of the rated load test. And the escalator cannot be stopped reliably under rated load, which is a great potential safety hazard. The loading test situation is shown in Figure 5(a). Especially, in some shopping malls, there is a human activity space under the escalator, as shown in Figure 5(b). Once the brake is unable to stop the escalator reliably at rated load, in some cases, the escalator is damaged, and in other cases, personal injury or death will be caused.
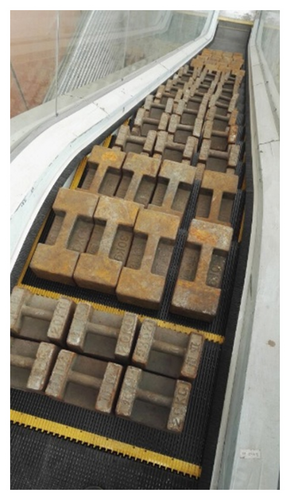

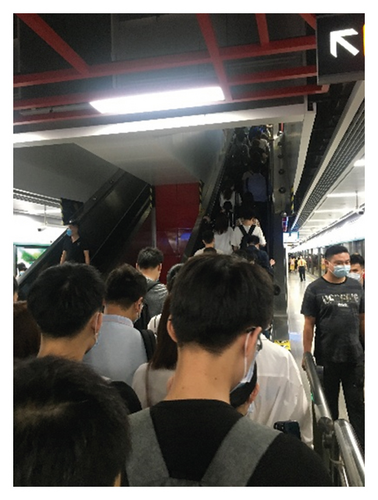
Consider the high cost and risk of rated load test of braking distance. At present, for the annual inspection and maintenance of escalators, there is no rated load test, only the measurement of no-load braking distance. However, the actual situation is that escalators in China often operate under heavy load, as shown in Figure 5(c). This brings great safety hazard to passengers. In order to reduce the cost of rated load test and reduce the test risk, it is particularly important to study the equivalent test method under the condition of light load. By establishing the relationship model between the braking distance and load, the braking distance of escalator under heavy load will be predicted.
Some scholars have studied the relationship between the test of the braking distance and safety. Wang and Lu proposed a method for calculating the braking capacity of escalators and moving walkways. The braking torque is selected through braking deceleration and then proofread stop distance [24]. Based on the design requirements of the escalator braking system, Pan studied the influencing factors of the braking distance and put forward proposed improvements to the inspection requirements of the braking distance [25]. Hu established a new method for calculating the mathematical model of the escalator braking distance and used this method to calculate some structural parameters of the escalator [26]. Liu analyzed the calculation of the braking distance of the escalator and established the relevant calculation formula [27]. Park and Gschwendtner proposed an efficient multibody dynamics simulation modeling approach. The approach also covers a comprehensive simulation modeling of drive machine with gearbox, main drive chain band, operational brake system, and auxiliary brake system to evaluate the escalator brake performance at the system level [21]. The work of the researchers provided an important reference for the study of the braking distance of escalators. However, most of the research on the braking distance of escalators is carried out from the aspects of checking and influencing factors, and there are few studies on how to predict the braking distance under various loads without loading or adding light load. In view of this, this paper studies the law of movement in the process of escalator operation, analyzes the energy change during the escalator braking process, analyzes and summarizes a large number of test data, and puts forward a method for braking distance prediction.
In this paper, the braking distance prediction model of the escalator under heavy load is obtained by light load. The method can reduce the test cost and risk, increase the coverage of the braking distance test of rated load, and improve the safety of the escalator. The structure of the paper is as follows: Section 2 is the theoretical analysis, starting from the general equation of mechanical motion, analyzes the law of the movement of the escalator, and constructs the equivalent dynamic model of the escalator system. And the relationship between the braking distance and the load is formed. Section 3 establishes the escalator braking distance prediction model. Through the analysis of the law of energy change in the braking process and according to the conservation of energy, a simpler relationship between the braking distance and the load is deduced and tested. Section 4 is the improved prediction model of the braking distance of the escalator. The prediction model derived in the Section 3 is improved, and the calculation method of the influence coefficient is given. Section 5 is the calculation results of the improved model. Three escalators with different parameters are tested, and compared with the predicted data, the results are basically consistent to meet the needs of engineering measurement. In the fifth section, the test results of three escalators are analyzed. The sixth section is the conclusion.
2. Theoretical Analysis
2.1. General Equations of Mechanical Motion
Equation (1) shows that, for complex systems, there are many components and it is difficult to solve. However, single-degree-of-freedom mechanical systems can be simplified by equivalent.
2.2. Equivalent Dynamic Model of Escalator System
For the escalator system shown in Figure 6, let the angular speed of the step sprocket be ω1, the mass is m1, the moment of inertia is J1, the mass of all the steps is m2, the speed of the step is v2, the load mass is m3, and the speed of load is v3.
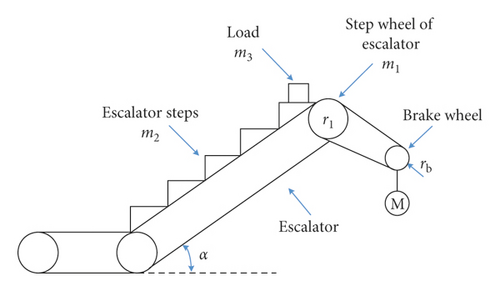
Make and Me0 = M1, where Je0 is the moment of inertia equivalent to the step sprocket, Me0 is the equivalent torque of the step sprocket, and M1 is the electromagnetic torque converted to the step sprocket.
Make and Me1 = ((m3g sin α · v/ω1) − M1), where Je1 is the equivalent moment of inertia of the step sprocket and Me1 is the equivalent torque of the step sprocket.
In equation (7), n1 is the speed of the step sprocket, m/s; nb is the speed of the brake wheel, m/s; and η is the transmission efficiency.
It can be seen from equation (12) that when applying brake, the motor power is disconnected, and the electromagnetic torque is zero. The braking distance is related to the mass of the load. As the load increases, the numerator increases, the denominator decreases, and the braking distance increases rapidly. Although the values such as moment of inertia and braking torque can be measured, they involve many and complicated parameters. For the installation site of the escalator, even some parameters cannot be obtained. Therefore, it is very difficult to calculate the braking distance with rated load and can only be measured by loading. This article attempts to analyze the relationship between the braking distance and the load from another angle to achieve the purpose of predicting the braking distance with rated load. By the analysis of energy changes during braking, a mathematical model of braking distance and load is established based on energy conservation, and the influence of some intermediate details is equivalent to a coefficient. Finally, the braking distance prediction of the escalator with rated load and various loads is realized.
3. Prediction Model of Braking Distance of Escalator
3.1. Energy Analysis of Escalator Braking Process
The brakes of escalator products are currently mechanical; that is, the brake system relies on the friction torque to stop the system that drives the main engine to run. Applying brake to an escalator or moving walkway running at a rated speed is the mechanics to consume all the inertial energies of moving parts of the stairway and the load through the frictional resistance between the brake wheel and the brake shoe and stop it within a distance. Taking an escalator as an example, the energy change during braking is shown in Figure 7.
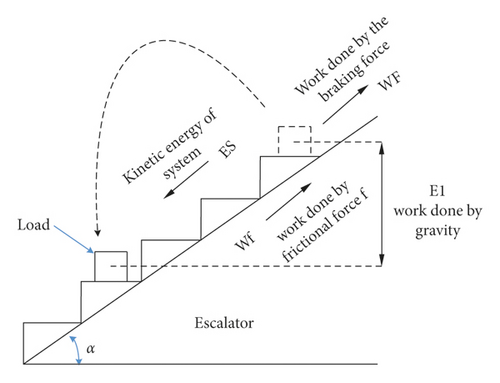
In Figure 7, the energy of the escalator movement process includes the following: the kinetic energy of the system (including all linear moving parts and rotating moving parts), the work done by the friction of the system, the work done by the gravity of the load, and the work done by the braking force during braking.
3.2. Mathematical Model of Relationship between Braking Distance and Load
The escalator is driven by the motor through the gears to drive the steps and the handrails to make a circular movement. When the fault occurs or the safety switch is activated, the safety circuit is disconnected and the motor loses its power source. At this time, the brake coil is deenergized, and the brake decelerates the brake wheel to stop. During braking, the kinetic energy and potential energy are reduced, the braking force does work, and finally reaches a state of equilibrium.
Equations (16) and (12) show the relationship between the braking distance and the load from two different angles. From the comparison between equations (16) and (12), it can be seen that they are similar in the following aspects: when the load increases, the numerator increases and the denominator decreases; the braking distance increases with the increase in load, and the closer to the rated load, the greater the increase in braking distance. However, the parameters to be measured in equation (16) are significantly less than those in equation (12), which shows that using equation (16) to predict the braking distance is more simple and convenient.
3.3. Test and Verification
The braking distance of the escalator under different loads can be obtained by equation (16). Although the ENKE in the model is a fixed value, it is related to many factors, and it is difficult to calculate accurately. In order to simplify the calculation, this paper proposed the back derivation method to obtain the ENKE. And then, substitute it into equation (16) to obtain the braking distance of the corresponding load. This not only avoids the high cost but also avoids the safety hazards of rated load testing.
Principle of back derivation method: for equation (16), braking distance with no load can be measured experimentally. v, g, and α are all fixed values, m1 is the mass of the load, and E0 is the ENKE, which is a constant related to the braking force. According to the analysis, when the load mass m1 is given, the braking distance S1 can be obtained. Conversely, by testing the value of S1 under load m1, the magnitude of the ENKE E0 can be calculated. If two braking distance tests are conducted under no-load and few-load conditions, respectively, the ENKE under the current conditions can be obtained by equation (16).
After calculating the ENKE by the back derivation method, only the braking distance S1 and the load m1 to be loaded are unknown in equation (16). This means that, as long as the load value is given, the braking distance under any load can be obtained. Take 3 different escalators as examples to verify equation (16).
The infrared-based ranging sensor tester is used for the braking distance test of escalator, which is designed independently. The parameters of the instrument are shown in Table 2.
| Sampling frequency | 25 Hz | Resolution | 0.1 mm |
|---|---|---|---|
| Measuring range | 0.1~100 m | Transmission interface | Bluetooth |
| Measurement accuracy | ±3 mm | Operating temperature | −10~+50°C |
3.3.1. Test Method
Place the instrument on the step, reserve enough braking distance, and start the escalator operation; when the escalator reaches a uniform speed, press the emergency stop button and test the relative distance of the instrument in real time during the braking process. Once the emergency stop signal is detected, the relative distance is recorded once. After the escalator stops, the relative distance is recorded again. The distance between the two measured values is the escalator braking distance. The test site is shown in Figure 8.
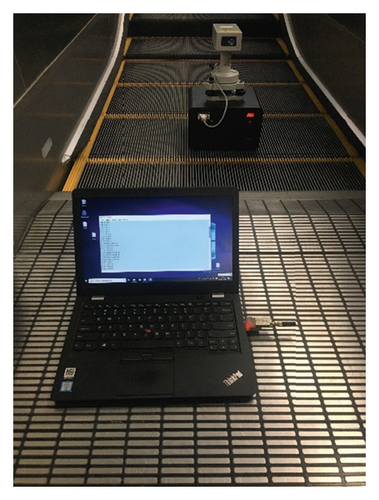

Figure 8(a) is the braking distance test when there is no load, and Figure 8(b) is the braking distance test when it is rated load.
The parameters of the three tested escalators are shown in Table 3.
| Parameters | Escalator 1 | Escalator 2 | Escalator 3 |
|---|---|---|---|
| Nominal speed | 0.5 m/s | 0.5 m/s | 0.5 m/s |
| Tilt angle | 35° | 35° | 35° |
| Lifting height | 4.2 m | 5.3 m | 4.8 m |
| Nominal width | 1000 mm | 1000 mm | 1000 mm |
| Rated load | 1800 kg | 2760 kg | 2400 kg |
| Power | 7.5 kw | 11 kw | 7.5 kw |
3.4. Verification and Analysis
The test of the three escalators was carried out using the test method of braking distance in Section 3.3. The braking distance of the escalators was measured under the conditions of no load and 25%, 50%, 75%, and 100% rated load, respectively. The measured results of the braking distance when there were different loads are shown in Table 4.
| Tested escalator | Load percentage (%) | |||||
|---|---|---|---|---|---|---|
| 0 | 25 | 50 | 75 | 100 | ||
| Escalator 1 (rated load 1800 kg) | Test result of braking distance (m) | 0.3 | 0.38 | 0.45 | 0.58 | 0.73 |
| Calculation result of ENKE (J) | — | 3353.06 | 4194.00 | 4291.55 | 4649.02 | |
| Escalator 2 (rated load 2760 kg) | Test result of braking distance (m) | 0.34 | 0.44 | 0.54 | 0.72 | 0.92 |
| Calculation result of ENKE (J) | — | 6059.34 | 7369.81 | 7680.53 | 8305.68 | |
| Escalator 3 (rated load 2400 kg) | Test result of braking distance (m) | 0.19 | 0.23 | 0.26 | 0.3 | 0.34 |
| Calculation result of ENKE (J) | — | 4062.84 | 5195.78 | 5662.83 | 6224.59 | |
As can be seen from Table 4, for the escalator 1, when the load is 0 kg, 450 kg, and 1800 kg, the measured braking distance is 0.3 m, 0.38 m, and 0.73 m, respectively. As the load increases, the braking distance increases, and when the load exceeds 50% of the rated load, the increase in braking distance increases significantly, which basically increases exponentially. For escalators 2 and 3, the same results as escalator 1 are obtained.
Equation (16) considers the ENKE to be a constant value. To verify, the back derivation method is used. Take escalator 1 as an example. Substitute the corresponding braking distance at 0 kg and at 450 kg into equation (16). The corresponding ENKE is calculated as 3353.0625 J. In the same way, the braking distances corresponding to 0 kg and other loads are substituted into equation (16), and the ENKE corresponding to the various loads calculated is 4194 J, 4291.553571 J, and 4649.023256 J. Similarly, the calculation results of escalators 2 and 3 are shown in Table 4.
It can be seen from the results in Table 4 that the calculated ENKE is inconsistent at different loads. As the load increases, the calculation result of the ENKE also increases. From 25% to 50% rated load stage, the ENKE increases faster; from 50% to 75% rated load stage, the ENKE increases slowly; and from 75% to 100% rated load stage, the ENKE increase rate increases again.
Through theoretical analysis, the ENKE proposed in this paper is related to the braking force. For an escalator, under the condition of a certain braking torque, the ENKE will not change. Then, the corresponding ENKE should be a certain value. However, from the calculation results of the no-load equivalent kinetic energy in Table 4, it can be seen that the ENKE becomes larger with the increase in the load. That is to say, the energy needs to be consumed by the brake in addition to the energy of the load itself, and the increased energy of the ENKE is noticed. It is caused by an increase in load. This is inconsistent with theoretical analysis. The analysis shows that, as the load increases, the friction and efficiency of the escalator system will change, so the impact coefficient of this model will also change with the increase in the load. The next section will improve the model.
4. Improved Model
4.1. Modification of the Model
According to the test results and theoretical analysis in the previous section, the calculated ENKE is not a constant but increases with the increase in the load. The analysis shows that, due to the existence of factors such as meshing and friction between the gears, the rated conversion efficiency of the work done by the braking force is deviated. The efficiency of the escalator in no-load and loading operation is different. This shows that the coefficients in equations (14) and (15) are not a constant value but change as the load increases.
Among them, k0 is the influence coefficient with no load, and k1 is the influence coefficient with loading, which varies with the load. E0 is the ENKE, which is related to , that is, the energy consumed in addition to the load energy.
4.2. Determination of Influence Coefficient and Analysis
For the calculation results of the ENKE of the test escalator in Section 3.4, it is actually assumed λ1 = (k0/k1) = 1. According to this assumption, substitute the test results of the braking distance of Table 4 into equation (22); the ENKE calculation results of the three escalators can be obtained, as shown in Table 4.
Since the improved mathematical model thinks that the value of λ1 is not 1, the next step is to calculate the value of λ1. Take escalator 1 as an example. Assuming that the 25% rated load is used as the reference, λ1 = 1, so the ENKE at this time is E0 = 3353.0625 J. Take E0 = 3353.0625 J as the ENKE of the system; that is to say, the ENKE of the system is a constant value 3353 J under any load (values after the decimal point are omitted). Then, the λ1 value under different loads can be obtained from equation (21), as shown in Table 5.
| Load percentage (%) | 25 | 50 | 75 | 100 |
|---|---|---|---|---|
| Equivalent no-load kinetic energy (J) | 3353 | 3353 | 3353 | 3353 |
| λ1 | 1.000003924 | 1.08360672 | 1.135131174 | 1.227679976 |
Similarly, for the escalator 2, substitute the test results of the braking distance in Table 4 into equation 22, and it can be calculated as E0 = 6059.34264. The corresponding calculation results of λ1 under different loads are shown in Table 6.
| Load percentage (%) | 25 | 50 | 75 | 100 |
|---|---|---|---|---|
| Equivalent no-load kinetic energy (J) | 6059 | 6059 | 6059 | 6059 |
| λ1 | 1.000012852 | 1.080126793 | 1.141245873 | 1.239476107 |
As can be seen in Table 6, the 25% rated load is used as the reference λ1 = 1. When the load is 50%, 75%, and 100% rated load, the calculated λ1 is 1.080, 1.141, and 1.239, respectively.
For the escalator 3, substitute the test results of the braking distance in Table 4 into equation (22), and it can be calculated as E0 = 4062.8403 J. The corresponding calculation results of λ1 under different loads are shown in Table 7.
| Load percentage (%) | 25 | 50 | 75 | 100 |
|---|---|---|---|---|
| Equivalent no-load kinetic energy (J) | 4062 | 4062 | 4062 | 4062 |
| λ1 | 1.000035977 | 1.075147415 | 1.144503496 | 1.234880806 |
It can be seen from Table 7 that when the load is 50%, 75%, and 100% rated load, the calculated λ1 is 1.075, 1.144, and 1.234, respectively.
This is approximately the same as the values of escalators 1 and 2 under the same load. Then, the comparison of the calculation results of the three escalators is shown in Figure 9.
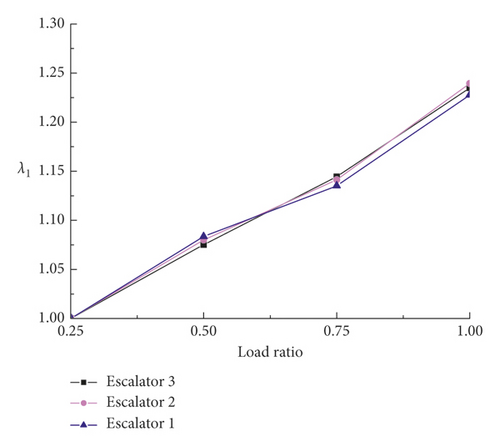
It can be intuitively seen from Figure 9 that the λ1 value change trend of the three escalators under different loads is very consistent and basically coincides at a specific point. Therefore, it can be obtained that when the load is 25%, λ1 ≈ 1; when the load is 50%, λ1 ≈ 1.08; when the load is 75%, λ1 ≈ 1.14; when the load is 100%, λ1 ≈ 1.234, as shown in Table 8.
| Load percentage (%) | 25 | 50 | 75 | 100 |
|---|---|---|---|---|
| λ1 | 1.000 | 1.080 | 1.140 | 1.234 |
The λ1 value corresponding to the load not listed in Table 8 is calculated by the piecewise interpolation method.
The test results of the above three escalators show that, with the increase in load, λ1 shows an increasing trend. But the growth rate decreases during the 50%–75% rated load stage, and the growth rate is faster at the 75%–100% rated load stage. The inflection point appears around 75% of the rated load. According to equation (20), as the load increases, the numerator becomes larger and the denominator becomes smaller. Due to the existence of λ1, after 75% rated load, the speed at which the denominator becomes smaller is slowed down. This suppresses the excessively rapid increase in the braking distance, and a reasonable braking distance value is obtained.
So far, the improved braking distance prediction model of escalator has been completed, and the influence coefficient has been determined. To verify the improved mathematical model, the next section will test the model and compare it with the measured value.
5. Test Results of Improved Model
Since the determination of the parameters in the improved model is based on the three escalator tests mentioned in Sections 3.3, the tilt angles are all 35°. In order to avoid interference, other three escalators with different models, different angles, and different rated loads were used as examples for testing. The parameters of the escalators are shown in Table 9.
| Parameters | Escalator 1 | Escalator 2 | Escalator 3 |
|---|---|---|---|
| Nominal speed | 0.5 m/s | 0.5 m/s | 0.5 m/s |
| Tilt angle | 30° | 35° | 35° |
| Lifting height | 3.6 m | 5.3 m | 5.0 m |
| Nominal width | 1000 mm | 1000 mm | 1000 mm |
| Rated load | 2000 kg | 2880 kg | 2640 kg |
| Power | 7.5 kw | 11.0 kw | 8.0 kw |
The loading test process is shown in Figure 10.
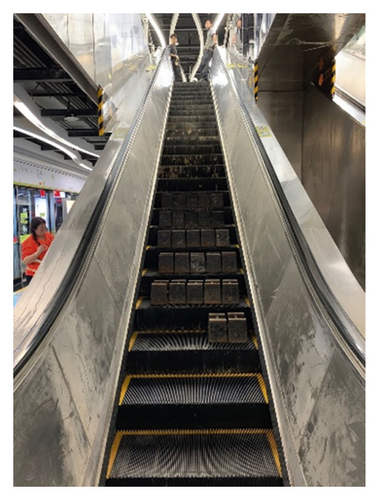


The actual measurement results of the braking distance are shown in Table 10.
| Load percentage (%) | 0 | 25 | 50 | 75 | 100 |
|---|---|---|---|---|---|
| Braking distance of escalator 1 (m) | 0.23 | 0.3 | 0.38 | 0.5 | 0.68 |
| Braking distance of escalator 2 (m) | 0.45 | 0.57 | 0.7 | 0.88 | 1.09 |
| Braking distance of escalator 3 (m) | 0.43 | 0.54 | 0.65 | 0.81 | 1.0 |
It can be seen from Table 10, for escalator 1, the braking distance with no load is small, and the increment between no-load and 25% rated load is small, so the braking distance increases slowly as the load increases, and the braking distance at rated load is also smaller, only 0.68 m; for escalator 2, the no-load braking distance is larger, and the increase in the braking distance between no-load and 25% rated load is larger, so with the increase in load, the braking distance increases rapidly. The braking distance at rated load is 1.09 m, which has exceeded the standard requirements. Therefore, it can be concluded that, as the load increases, the braking distance shows an upward trend. When the braking distance change between no-load and 25% rated load is greater, the braking distance increases faster and is likely to exceed the standard. On the contrary, the growth of the braking distance is relatively slow.
According to the back derivation method in Section 3.3, the actual measurement results of the no-load and 25% rated load in Table 10 are substituted into equation (22). And the ENKE of each escalator is calculated under the current braking force, as shown in Table 11.
| Escalator no. | Escalator 1 | Escalator 2 | Escalator 3 |
|---|---|---|---|
| Equivalent no-load kinetic energy (J) | 2620.35 | 10441.08 | 9879.85 |
The ENKE of each escalator calculated in Table 11 is substituted into equation (20), and the predicted results of the braking distance under different loads of each escalator are calculated, as shown in Table 12.
| Load percentage | 0 | 25% | 50% | 75% | 100% |
|---|---|---|---|---|---|
| Predicted braking distance of escalator 1 (m) | 0.230 | 0.300 | 0.370 | 0.498 | 0.674 |
| Predicted braking distance of escalator 2 (m) | 0.450 | 0.570 | 0.681 | 0.873 | 1.112 |
| Predicted braking distance of escalator 3 (m) | 0.430 | 0.540 | 0.637 | 0.803 | 0.997 |
It can be seen from Table 12 that, for an escalator of 0.5 m/s, when the braking distance with no load is close to 0.2 m, the braking distance with rated load is predicted to be 0.67 m. And there is space from the standard requirement of 1 m; when the braking distance with no load exceeds 0.4 m, the predicted value of the braking distance with rated load is basically close to the upper limit of the standard or even exceeds the standard. Relevant measures need to be taken to reduce the braking distance to ensure the safe of the escalator.
6. Analysis and Discussion
According to the test results in Section 5 above, the comparison between the predicted value of the improved braking distance prediction model and the measured value is shown in Figure 11.
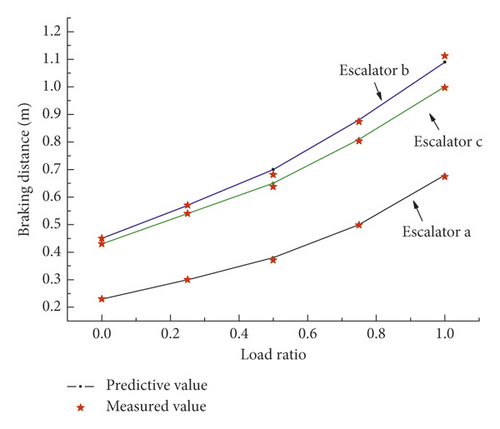
By combining Tables 10 and 12 and Figure 11, it can be seen that the difference between the predicted value and the measured value is 0.022 m at the maximum, and the maximum error is 2.7%. It can meet the needs of engineering measurement. At the same time, the error we are more concerned about at 100% of the rated load is smaller, the minimum difference is only 0.003 m, and the minimum error is 0.3%. This means that the predicted value is closer to the actual value at 100% of the rated load.
It can be seen in Figure 11 that, before 50% rated load, the slope of the curve of braking distance with load is smaller; after that, the slope of the curve of braking distance with load is larger, which means that, from 50% rated load, as the load increases, the braking distance increases faster. The analysis shows that, as the load increases, the kinetic energy of the escalator system continues to increase. At 50% rated load, on applying brake, due to the large impulse force, the critical point of friction is reached, causing the friction of the system to become sliding friction. The frictional force is reduced so that the braking distance increases more obviously.
Furthermore, in order to visually show the influence of the braking force on the braking distance, the braking force is adjusted on the escalator 1. The braking force is increased first, and then, the braking force is reduced. The braking distance test method in Section 3.3 has been used for testing. The measured results of the braking distance before and after adjustment are shown in Table 13.
| Load percentage (%) | 0 | 25 | 50 | 75 | 100 | Remarks |
|---|---|---|---|---|---|---|
| Braking distance of escalator (m) | 0.23 | 0.3 | 0.38 | 0.5 | 0.68 | Before adjustment |
| Braking distance of escalator (m) | 0.18 | 0.24 | 0.32 | 0.43 | 0.62 | Increase the braking force |
| Braking distance of escalator (m) | 0.26 | 0.34 | 0.42 | 0.6 | 0.8 | Decrease the braking force |
According to the back derivation method in Section 3.3, the actual measurement results of the no-load and 25% rated load in Table 13 are substituted into equation (22), respectively. The value of ENKE is calculated. And then, the predicted value of the braking distance can be obtained, respectively, according to equation (20) before and after adjustment. The comparison between the predicted value and the measured value is shown in Figure 12.
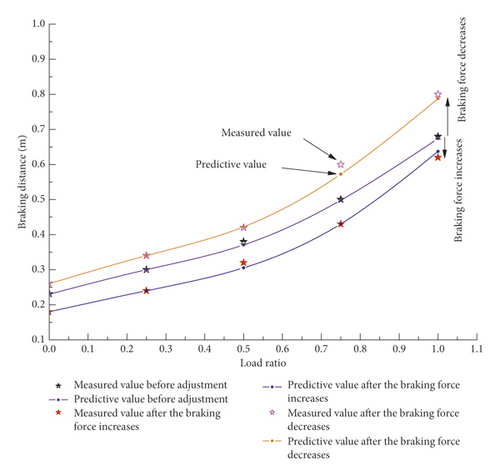
It can be seen from Figure 12 that the test value and the predicted value of the braking distance before and after the braking force adjustment are basically the same, indicating that the improved prediction model can meet the needs of engineering measurement. Before the braking force adjustment, the braking distance with no load is 0.23 m. After the braking force increases, the braking distance with no load is 0.18 m, indicating that the braking force will decrease when the braking force increases; after the braking force decreases, the braking distance with no load is 0.26 m, indicating that the braking force will increase if the braking force decreases. The same phenomenon happened when rated loaded. Further analysis, from the braking distance test results of Table 13 and equation (22), the ENKE can be calculated to be 2620 J, before the adjustment of the braking force. After the brake spring is tightened, that is, the braking force increases. Then, the result is that the braking distance becomes smaller. Correspondingly, from equation (22), the ENKE is 2223 J, which also becomes smaller. After the brake spring is loosened, it means that the braking force is reduced. Then, the result is that the braking distance becomes larger. Correspondingly, from equation (22), the ENKE is 2910 J, which also becomes larger. It can be concluded that the ENKE of an escalator with a large braking force is small; that is, the ENKE that needs to be consumed is small. In addition, the change in braking distance between no-load and 25% rated load is large, indicating that the braking force is small, and the braking distance increases faster as the load increases.
7. Conclusion
- (1)
The prediction model before improvement considers that the influence coefficients are equal whether no load or loaded. However, it has been verified by experiments that the influence coefficient increases nonlinearly with the increase in the load. The improved prediction model revises the influence coefficient and proposes the change law of the influence coefficient on the braking distance. The results show that the maximum error between the braking distance predicted by the improved model and the braking distance measured by the loading method is 2.3%, which meets the test error of engineering application.
- (2)
As the load increases, the braking distance is on the rise. When the difference of braking distance between no-load and 25% rated load is large, the braking distance increases faster and is likely to exceed the standard. On the contrary, the growth of the braking distance is relatively slow.
- (3)
The braking distance test is based on the power-off time, including the electrical and mechanical delay time of the brake. And the load influence coefficient is also obtained on this basis. If the braking distance test starts from braking, the load influence coefficient needs to be recalculated.
- (4)
The introduction of ENKE simplifies the model and ignores the influence of some intermediate quantities, which simplifies the calculation. At the same time, a back derivation method is proposed to calculate the ENKE, which avoids the complexity and uncertainty of the ENKE calculation.
- (5)
The improved prediction model shows that the escalator with a large braking force has a small ENKE; that is to say, for the braking force under this condition, the escalator is easy to stop. Conversely, the escalator with a small braking force has a large ENKE, so the escalator is not easy to stop, which is consistent with the actual situation.
Conflicts of Interest
The authors declare that they have no conflicts of interest.
Acknowledgments
This research was funded by the Guangzhou Market Supervision Administration, China (no. 2020kj26), and Guangzhou Science and Technology Bureau, China (no. 202002030121).
Open Research
Data Availability
The data used to support the findings of this study are available from the corresponding author upon request.


