Volume 2020, Issue 1 6153432
Erratum
Open Access

Erratum to “Frizzled-10 Extracellular Vesicles Plasma Concentration Is Associated with Tumoral Progression in Patients with Colorectal and Gastric Cancer”

Maria Principia Scavo

Corresponding Author

Maria Principia Scavo

Personalized Medicine Laboratory, National Institute of Gastroenterology “S. De Bellis” Research Hospital, Via Turi 27, Castellana Grotte, Bari, Italy

Search for more papers by this author
Antonio Cigliano

Antonio Cigliano

Personalized Medicine Laboratory, National Institute of Gastroenterology “S. De Bellis” Research Hospital, Via Turi 27, Castellana Grotte, Bari, Italy

Search for more papers by this author
Nicoletta Depalo

Nicoletta Depalo

Institute for Chemical-Physical Processes (IPCF)-CNR, SS Bari, Via Orabona 4, Bari 70125, Italy cnr.it

Search for more papers by this author
Elisabetta Fanizza

Elisabetta Fanizza

Institute for Chemical-Physical Processes (IPCF)-CNR, SS Bari, Via Orabona 4, Bari 70125, Italy cnr.it

Università Degli Studi di Bari Aldo Moro, Dipartimento di Chimica, Via Orabona 4, Bari 70125, Italy uniba.it

Search for more papers by this author
Maria Grazia Bianco

Maria Grazia Bianco

Personalized Medicine Laboratory, National Institute of Gastroenterology “S. De Bellis” Research Hospital, Via Turi 27, Castellana Grotte, Bari, Italy

Search for more papers by this author
Nunzio Denora

Nunzio Denora

Institute for Chemical-Physical Processes (IPCF)-CNR, SS Bari, Via Orabona 4, Bari 70125, Italy cnr.it

Università Degli Studi di Bari Aldo Moro, Dipartimento di Farmacia, Scienze Del Farmaco, Via Orabona 4, Bari 70125, Italy uniba.it

Search for more papers by this author
Valentino Laquintana

Valentino Laquintana

Università Degli Studi di Bari Aldo Moro, Dipartimento di Farmacia, Scienze Del Farmaco, Via Orabona 4, Bari 70125, Italy uniba.it

Search for more papers by this author
Maria Lucia Curri

Maria Lucia Curri

Institute for Chemical-Physical Processes (IPCF)-CNR, SS Bari, Via Orabona 4, Bari 70125, Italy cnr.it

Università Degli Studi di Bari Aldo Moro, Dipartimento di Chimica, Via Orabona 4, Bari 70125, Italy uniba.it

Search for more papers by this author
Dionigi Lorusso

Dionigi Lorusso

Surgical Gastroenterology Unit, National Institute of Gastroenterology “S. De Bellis” Research Hospital, Via Turi 27, Castellana Grotte, Bari, Italy

Search for more papers by this author
Claudio Lotesoriere

Claudio Lotesoriere

Oncology Unit, National Institute of Gastroenterology “S. De Bellis” Research Hospital, Via Turi 27, Castellana Grotte, Bari, Italy

Search for more papers by this author
Alba Panarese

Alba Panarese

Endoscopy Unit, National Institute of Gastroenterology “S. De Bellis” Research Hospital, Via Turi 27, Castellana Grotte, Bari, Italy

Search for more papers by this author
Gianluigi Giannelli

Gianluigi Giannelli

Personalized Medicine Laboratory, National Institute of Gastroenterology “S. De Bellis” Research Hospital, Via Turi 27, Castellana Grotte, Bari, Italy

Scientific Direction, National Institute of Gastroenterology “S. De Bellis” Research Hospital, Via Turi 27, Castellana Grotte, Bari, Italy

Search for more papers by this author
First published: 30 January 2020
Citations: 1

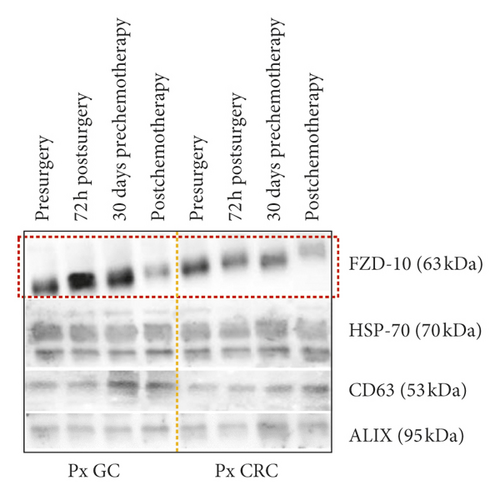
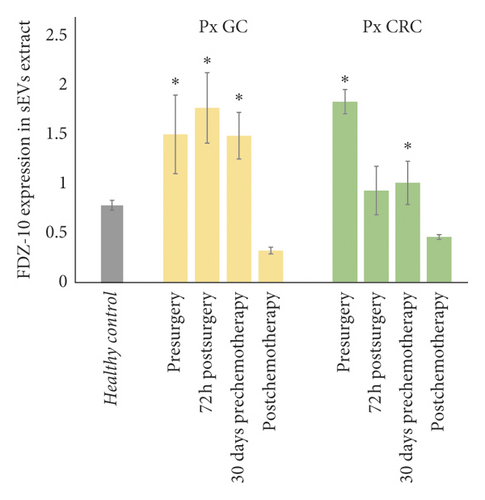
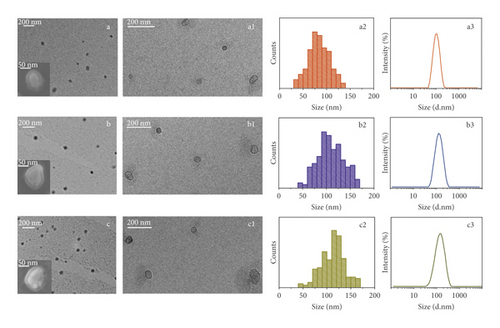
In the article titled “Frizzled-10 Extracellular Vesicles Plasma Concentration Is Associated with Tumoral Progression in Patients with Colorectal and Gastric Cancer” [1], there was an error in Figures 1 and 3. Because of an error in figure assembly after acceptance, in Figure 1, the two images (a1) and (b1) were identical, and in Figure 3, the expression of the CD63 was missing.

The correct figures should be as follows:
Details are in the caption following the image
Analysis of morphology and size distribution of freshly isolated sEVs performed by TEM, SEM, and DLS investigation. Representative TEM micrographs obtained with positive (a, b, c) and negative (a1, b1, c1) staining of sEVs extracted from plasma of the healthy donors (a, a1) and the CRC (b, b1) and GC (c, c1) patients, along with their corresponding SEM images (inset a, b, c). Related size distributions by TEM (a2, b2, c2) and DLS (a3, b3, c3) analysis.
Details are in the caption following the image
Detection and determination of FZD-10 expression levels in sEVs isolated from cancer patients with metastasis by Western blotting and densitometry analysis. Representative Western blotting of FZD-10 and three exosomal/EV protein markers (Hsp70, CD-63, and ALIX) in sEVs extracted from patients with metastatic GC (Px GC) and metastatic CRC (Px CRC), before surgery and at different treatment steps. Molecular mass markers are indicated on the right. The same load (20 μg) of samples based on total protein content (a). Semiquantitative evaluation of relative FZD-10 expression in sEVs extracts by densitometry analysis of protein bands in (a). FZD-10 bands were measured and normalized with corresponding housekeeping Hsp70 bands, for each CRC and GC patient (three replicates). Average value of FZD-10 expression levels among all CRC or GC or metastastic CRC patients reported in graph. p < 0.005 versus healthy control. n = 6 for CRC, n = 6 for GC, and n = 8 for healthy donors (b).

    The full text of this article hosted at iucr.org is unavailable due to technical difficulties.