CD40 is Positively Correlated with the Expression of Nucleophosmin in Cisplatin-Resistant Bladder Cancer
Abstract
Objective. To verify and evaluate the value of CD40 as a noninvasive biomarker of cisplatin-resistant bladder cancer, we studied the expression of CD40 and the correlation between nucleophosmin (NPM1) and CD40 in cisplatin-resistant bladder cancer. Methods. Three cisplatin-resistant bladder cancer cell lines (T24/0.8DDP, BIU87/0.3DDP, and PUMC-91/0.6DDP) were studied, and lentivirus was used to silence NPM1 expression. The expression of CD40 and NPM1 in three NPM1 silencing bladder cancer cell lines were detected by fluorescence microscopy and Western Blot. The effects and proteomic bioinformatics of NPM1 gene knockout on cisplatin-resistant bladder cancer cells were analyzed by liquid chromatography-mass spectrometry (LC-MS) and gene ontology analysis (GO analysis). Results. The NPM1 gene was successfully silenced in three drug-resistant bladder cancer cell lines by lentivirus infection. The knockdown efficiency was 70%. After NPM1 gene knockout, 492 differential proteins were detected by LC-MS, whose fold change was more than 1.5 (p < 0.05). A total of 57022 peptides, 54347 unique peptides, and 6686 protein groups were identified in all proteins of the tested cells (FDR < 0.01). Hierarchical clustering and principal component analysis showed that 264 functional proteins were downregulated and 228 functional proteins were upregulated in the gene silencing group compared with those of the negative controls. By GO analysis, the proteins affected by NPM1 cover a large number of proteins with biological functions, which may play an important role in the development of tumor in 492 differential proteins. The CD40 was the most significantly downregulated protein after NPM1 silencing, with a difference of 2.6-fold change in abundance. Conclusions. There is a positive correlation between CD40 protein and NPM1 protein in drug-resistant bladder cancer. Because NPM1 can reflect the characteristics of bladder cancer, CD40 may be a more sensitive marker for monitoring the prognosis of bladder cancer.
1. Introduction
Bladder cancer is one of the most common malignancies of the urinary system and is the most common urinary system tumor in men [1]. At present, the main clinical treatment of bladder cancer is surgery combined with postoperative chemotherapy. However, bladder cancer is prone to drug resistance and recurrence, which makes the cure of bladder cancer more difficult. Early detection and timely intervention can significantly improve the survival rate of patients with bladder cancer. Timely monitoring the progress of drug-resistant bladder cancer is helpful for early targeted treatment of bladder cancer recurrence [2].
At present, the diagnosis and monitoring methods of bladder cancer are mainly urine cytology and cystoscopy. Cystoscopy is an invasive method for detection of bladder cancer, which is easy to cause anxiety and discomfort in patients [3]. Moreover, the sensitivity of cystoscopy to bladder cancer in situ (TIS) is low. Urine cytology is a noninvasive diagnostic method, which is less sensitive to small mastoid tumors, satellite lesions, and CIS both in the initial diagnosis and in the monitoring of recurrence. The sensitivity of cystoscopy is low, as low as 28%, and the median is 44% [4]. In addition, the cytological results are also affected by many factors, such as low production of exfoliated cells, urinary tract infection, and calculus, which will affect the clinical interpretation [5].
Urine biomarker detection can greatly improve the sensitivity and specificity of bladder cancer detection, which is a valuable choice. The ideal biomarker of bladder cancer is defined as an objective and noninvasive marker with high sensitivity and specificity [5], but in the existing urine tumor markers, the false-positive results are very common. During hematuria, inflammation, or infection, it is often unable to accurately judge the bladder tumor [3, 6–9].
Nucleophosmin 1 (NPM1) is a kind of protein that mainly locates in the nucleolus and shuttles between the nucleolus and the cytoplasm. Previous studies in our laboratory have shown that NPM1 can reflect specific biological behavior such as recurrence and drug resistance in bladder cancer. The expression of NPM1 in bladder cancer cells increases when the recurrence and drug resistance of invasive bladder cancer cells increase, suggesting that NPM1 may be an important prognostic indicator of bladder cancer cells [10]. However, as a protein only existing in cells, NPM1 has limited sensitivity as early monitoring of bladder cancer. Therefore, it is urgent to find a real-time and effective way to monitor the progress and recurrence of bladder cancer after treatment.
CD40, a transmembrane glycoprotein, is a member of the tumor necrosis factor receptor superfamily. The studies have shown that the CD40 molecule was found on the surface of antigen presenting cells (APC) [11], normal bladder cancer [12], gastric cancer [13], colon cancer [14], and other solid tumors and hematological tumor cells. CD40 molecules are differentially expressed in the process of tumorigenesis and tumor development. CD40 has been regarded as an important biomarker to predict the development in many cancers, such as ovarian cancer [5], hepatocellular carcinoma [6], and other tumors. Ghamade et al. demonstrated that recombinant CD40 ligand therapy had significant antitumor effect on CD40-positive ovarian tumors in mice, and antagonizing CD40 could enhance the effect of cisplatin [8], which means CD40 has a high diagnostic and therapeutic value [7].
CD40 has a variety of oncological activities in tumors, which provides an attractive choice for future clinical applications. As a cell surface secretory molecule, CD40 has a high sensitivity to reflect the biological changes of cells and can predict the biological behavior of tumor cells in the early stage. However, up to now, the differential expression and predictive value of CD40 have not been verified in drug-resistant bladder cancer.
Because NPM1 is closely related to drug-resistant bladder cancer, this study intends to explore the differential expression of CD40 in drug-resistant bladder cancer by mass spectrometry and analyze the correlation between NPM1 and CD40 in drug-resistant bladder cancer, so as to determine whether CD40 is a noninvasive biomarker that can predict the progress of bladder cancer.
2. Materials and Methods
2.1. Subject and Groups
2.1.1. Drug-Resistant Cell Groups
The cisplatin-resistant bladder cancer cell lines (T24/0.8DDP, BIU87/0.3DDP, and PUMC-91/0.6DDP) were purchased from Beijing Shijitan Hospital Affiliated to Capital Medical University.
2.1.2. NPM1 Differential Expression Cell Groups
NPM1 silencing bladder cancer cell lines (T24/0.8DDP Lv-NPM1, BIU87/0.3DDP Lv-NPM1, and PUMC-91/0.6DDP Lv-NPM1): NPM1-silenced stable infection cell line was constructed by lentivirus infection containing NPM1 shRNA.
NPM1 silencing negative control groups (T24/0.8DDP Lv-NC, BIU87/0.3DDP Lv-NC, and PUMC-91/0.6DDP Lv-NC): the cell lines were constructed by lentivirus infection containing NPM1-negative shRNA.
2.2. Materials
0.25% of trypsin (17518012, Gibco Company, USA), RPMI 1640 (AE244464298, Hyclone Company, USA), fetal bovine serum (1861242, Gibco Company, USA), cisplatin (P4394, Sigma Company, USA), polyvinylidene fluoride (PVDF) membranes (ISEQ00010, Sigma Company, USA), mouse anti-nucleophosmin antibody (ab10530, Abcam Company, USA), rabbit anti-CD40 antibody (ab224639, Abcam Company, USA), goat anti-Mouse IgG H&L (HRP) (ab205719, Abcam Company, USA), and NPM1-silencing and NPM1 overexpressing and negative control lentivirus (GenePharma, China) were used.
2.3. Methods
2.3.1. Lentivirus Infection and Establishment of Stable Cell Lines
T24/0.8DDP, PUMC-91/0.6DDP, and BIU-87/0.3DDP cells were infected with lentivirus containing NPM1 shRNA (NPM1 interference group) and negative control shRNA (NPM1 negative control group), respectively. The related protein validation and functional experiments were carried out 72 hours after infection. The stable infected cells were screened by single cell cloning. Clones were isolated and screened for stable culture. The isolated clones were amplified and cultured to establish stable cell lines.
2.3.2. Cell Culture
(1) Drug Resistant Bladder Cancer Cell Groups. T24/0.8DDP, BIU-87/0.3DDP, and PUMC-91/0.6DDP were cultured in the RPM I1640 medium containing 20% FBS and 0.8 μg/ml DDP, 0.3 μg/ml DDP, or 0.6 μg/ml DDP and kept at 37°C in a 5% CO2 saturated humidity incubator, respectively. When cell growth fused into a single layer, the cells were digested and subcultured with 0.25% trypsin.
(2) NPM1 Silencing Bladder Cancer Cell Groups. T24/0.8DDP Lv-NPM1, BIU-87/0.3DDP Lv-NPM1, and PUMC-91/0.6DDP Lv-NPM1 were cultured in the RPM I1640 medium containing 20% FBS and kept at 37°C in a 5% CO2 saturated humidity incubator, respectively. When cell growth fused into a single layer, the cells were digested and subcultured with 0.25% trypsin.
(3) The Corresponding Negative Control Cell Groups. Human bladder cancer cell lines T24/0.8DDP Lv-NC, BIU-87/0.3DDP Lv-NC, and PUMC-91/0.6DDP Lv-NC were cultured in the RPMI 1640 medium containing 15% FBS and kept at 37°C in a 5% CO2 saturated humidity incubator, respectively. When cell growth fused into a single layer, the cells were digested and subcultured with 0.25% trypsin.
2.3.3. Western Blot
The total protein was extracted by a RIPA protein lysate. The protein was electrophoretized by SDS-PAGE at 120°V. Then, the protein was transferred to the nitrocellulose filter membranes. The nitrocellulose filter membranes were incubated overnight at 1 : 1,000 anti-NPM1 antibody, anti-CD40 antibody, and anti-β-actin antibody. The membranes were incubated at 4°C. The PBST buffer was used to rinse the membranes three times, each 20 minutes, 1 : 1,000 second antibody was added and incubated at room temperature for 90 minutes. The nitrocellulose filter membranes were rinsed by PBST and developed by the DAB kit. All experiments were repeated three times.
2.3.4. Mass Spectrometry
The cell samples were transferred to 1.5 ml microcentrifugal tubes. Then, the dissolving buffer (7 M urea, 2 M thiourea, and 0.1% CHAPS) was added to each sample, and the total protein was extracted by ultrasonic grinding. The supernatant was centrifuged for 30 minutes at 14,000 g for further experiments. Protein concentration was determined by the Bradford method. The appropriate amount of protein (100 µl) was taken for electrophoresis. Gel dyeing and staining were performed until the results were clear. The experiment was repeated three times.
The peptides were separated by a Thermo Scientific EASY-nLC 1,000 system. The peptide mixtures were grouped according to the experimental requirements and labeled with TMT reagents. The mixture of peptides was dissolved in solution A (98% DDH and 2% acetonitrile, pH = 10). Then, the gradient solution B (2% DDH and 98% acetonitrile, pH = 10) was separated in a Durashell-C18 column (4.6 m × 250 m, 5 µm, 100) at a flow rate of 0.7 ml/m. The separation gradient is shown in Table 1. The isolated peptide was detected by a Q-Exactive mass spectrometer (Thermo Scientific). The spray voltage of the ion source was set to 2.1 kV. Full-scanning MS with a resolution of 70,000 was obtained in MS with a resolution of over 350–1,800 m/z. The spectral resolution of HCD was 17500 fhm. Standardized collision energy was set to 29%.
| Time (min) | The ratio (%) of gradient solution B |
|---|---|
| 0 | 5 |
| 5 | 8 |
| 35 | 18 |
| 62 | 32 |
| 64 | 95 |
| 68 | 95 |
| 72 | 5 |
2.3.5. Proteomic Bioinformatics Analysis
Proteome Discoverer software was used to process the original mass spectrometry data. MS data were searched according to the human genome database and Uniprot website. The parameter settings for MaxQuant search are shown in Table 2.
| Parameters | Value |
|---|---|
| Enzyme | Trypsin |
| Static modification | C-carboxyamidomethylation (57.021 Da) |
| Dynamic modification | M oxidation (15.995 Da); |
| N-terminal TMT 9 plex | |
| Species | Homo sapiens |
| Precursor ion mass tolerance | +15 ppm |
| Fragmentation mass tolerance | +20 MMU |
| Max missed cleavages | 2 |
The biological processes, molecular functions, and cellular components of proteins were analyzed by gene ontology analysis (GO analysis). In addition, the Kyoto Encyclopedia of Genes and Genomes (KEGG) was used to study protein species in order to map the KEGG pathway for systematic functional biology interpretation (http://www.genome.jp/kegg/). Protein-protein interactions are obtained from a search tool that retrieves the Interacting Gene/Protein (String) database (http://string-db.org/), which contains known and predicted physical and functional protein-protein interactions.
2.4. Statistical Analysis
All independent experimental data were expressed as mean ± standard deviation (SD). Statistical analysis was carried out by using Graphpad prism 6.0 statistical software Inc. (Lajolla, USA). p values were calculated by ANOVA and the Bonferroni test (more than two groups) or t-test (two groups). When p value<0.05, the results are considered to be statistical.
3. Results
3.1. Establishment of NPM1 Silencing Stable Cell Lines
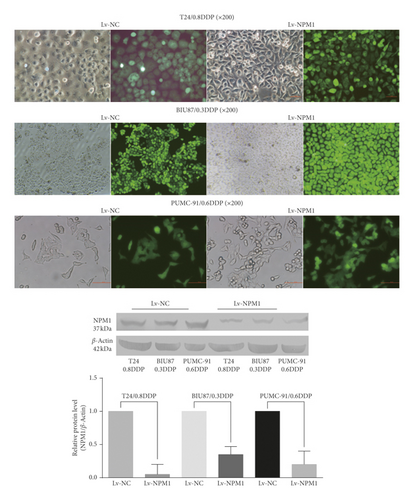
We successfully established stable NPM1 silencing drug-resistant bladder cancer cell lines: the fluorescence efficiency of GFP in six kinds of cells (T24/0.8DDP Lv-NPM1, BIU-87/0.3DDP Lv-NPM1, PUMC-91/0.6DDP Lv-NPM1, and the corresponding negative controls) was observed by fluorescence microscopy, which reached more than 80%. Western blot was used to detect NPM1 expression. In the western blot analysis, the level of NPM1 protein in the T24/0.8DDP Lv-NPM1 cell line was 0.05-fold as high as that in T24/0.8DDP Lv-NC (p value<0.05). The level of NPM1 protein in the BIU-87/0.3DDP Lv-NPM1 cell line was 0.35-fold as high as that in the corresponding negative control BIU-87/0.3DDP Lv-NC (p value<0.05). The level of NPM1 protein in the PUMC-91/0.6DDP Lv-NPM1 cell line was 0.20-fold as high as that in the corresponding negative control PUMC-91/0.6DDP Lv-NC (p value<0.05). The experimental results are shown in Figure 1.
3.2. Knockdown of NPM1 Gene Resulted in Significant Proteomic Changes in Drug-Resistant Bladder Cancer Cells
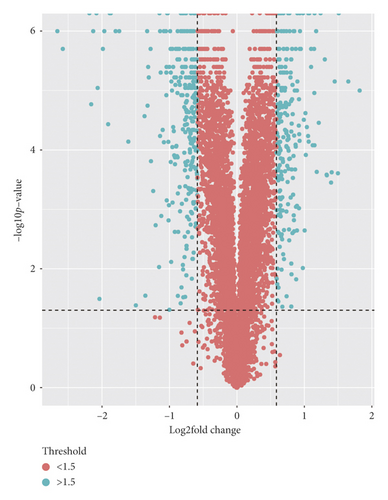
The effects of NPM1 gene knockout on cisplatin-resistant bladder cancer cells were analyzed by mass spectrometry. A total of 492 differential proteins were identified by principal component analysis. The identified proteins met the following requirements: fold change >1.5 (p value<0.05), as shown in Figure 2(a).
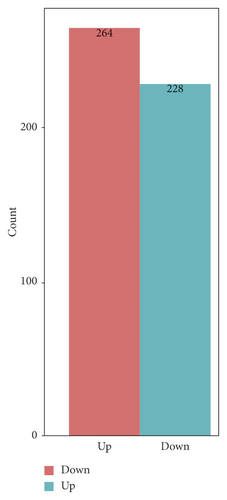
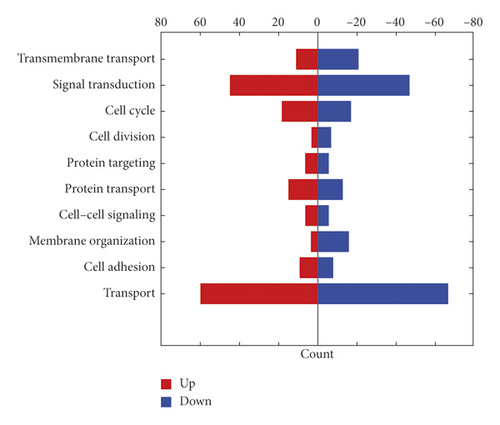
The changes of cell proteome were quantitatively recorded by tandem mass tag (TMT) technique. A total of 57022 peptides, 54347 unique peptides, and 6686 protein groups were identified in all proteins of the tested cells (FDR < 0.01). Hierarchical clustering and principal component analysis showed that there were significant protein differences between the gene silencing group and the negative control groups, as shown in Figure 2(b). A total of 264 functional proteins were downregulated and 228 functional proteins were upregulated in the gene silencing group compared with those of the negative controls. We further analyzed the biological functions of 492 differential proteins by GO analysis, as shown in Figure 2(c). These results confirmed that the proteins affected by NPM1 cover a large number of proteins with biological functions. We specifically analyzed the differential protein of the signal transduction protein in drug-resistant bladder cancer, as shown in Table 3.
| Id | Accession | Gene name | Description |
|---|---|---|---|
| TNR5_HUMAN | P25942 | CD40 | Tumor necrosis factor receptor superfamily member 5 |
| NPM_HUMAN | P06748 | NPM1 | Nucleophosmin |
| TNR6_HUMAN | P25445 | FAS | Tumor necrosis factor receptor superfamily member 6 |
| IF16_HUMAN | Q16666 | IFI16 | Gamma-interferon-inducible protein 16 |
| BID_HUMAN | P55957 | BID | BH3-interacting domain death agonist |
| E9PCH4_HUMAN | E9PCH4 | Uncharacterized protein | |
| DAP1_HUMAN | P51397 | DAP | Death-associated protein 1 |
| CNBP1_HUMAN | Q9NSA3 | CTNNBIP1 | Beta-catenin-interacting protein 1 |
| ASPH_HUMAN | Q12797 | ASPH | Aspartyl/asparaginyl beta-hydroxylase |
| A4_HUMAN | P05067 | APP | Amyloid-beta A4 protein |
| GNAQ_HUMAN | P50148 | GNAQ | Guanine nucleotide-binding protein G(q) subunit alpha |
| K2C8_HUMAN | P05787 | KRT8 | Keratin, type II cytoskeletal 8 |
| SP110_HUMAN | Q9HB58 | SP110 | Sp110 nuclear body protein |
| SDC4_HUMAN | P31431 | SDC4 | Syndecan-4 |
| CO1A2_HUMAN | P08123 | COL1A2 | Collagen alpha-2(I) chain |
| HNRDL_HUMAN | O14979 | HNRNPDL | Heterogeneous nuclear ribonucleoprotein D-like |
| CAB39_HUMAN | Q9Y376 | CAB39 | Calcium-binding protein 39 |
| ERLN2_HUMAN | O94905 | ERLIN2 | Erlin-2 |
| CY24 A_HUMAN | P13498 | CYBA | Cytochrome b-245 light chain |
| SLK_HUMAN | Q9H2G2 | SLK | STE20-like serine/threonine-protein kinase |
| CGL_HUMAN | P32929 | CTH | Cystathionine gamma-lyase |
| F5H6H0_HUMAN | F5H6H0 | HMGA2 | High-mobility group protein HMGI-C |
| SKI_HUMAN | P12755 | SKI | Ski oncogene |
| BI2L1_HUMAN | Q9UHR4 | BAIAP2L1 | Brain-specific angiogenesis inhibitor 1-associated protein 2-like protein 1 |
| RHG19_HUMAN | Q14CB8 | ARHGAP19 | Rho GTPase-activating protein 19 |
| PTEN_HUMAN | P60484 | PTEN | Phosphatidylinositol 3,4,5-trisphosphate 3-phosphatase and dual-specificity protein phosphatase PTEN |
| CCNA2_HUMAN | P20248 | CCNA2 | Cyclin-A2 |
| PARK7_HUMAN | Q99497 | PARK7 | Protein/nucleic acid deglycase DJ-1 |
| APOE_HUMAN | P02649 | APOE | Apolipoprotein E |
| IKKA_HUMAN | O15111 | CHUK | Inhibitor of nuclear factor kappa-B kinase subunit alpha |
| RO52_HUMAN | P19474 | TRIM21 | E3 ubiquitin-protein ligase TRIM21 |
| RWDD1_HUMAN | Q9H446 | RWDD1 | RWD domain-containing protein 1 |
| AATC_HUMAN | P17174 | GOT1 | Aspartate aminotransferase, cytoplasmic |
| ZFY27_HUMAN | Q5T4F4 | ZFYVE27 | Protrudin |
| SPTN2_HUMAN | O15020 | SPTBN2 | Spectrin beta chain, nonerythrocytic 2 |
| SRPRB_HUMAN | Q9Y5M8 | SRPRB | Signal recognition particle receptor subunit beta |
| KBTB7_HUMAN | Q8WVZ9 | KBTBD7 | Kelch repeat and BTB domain-containing protein 7 |
| DDX54_HUMAN | Q8TDD1 | DDX54 | ATP-dependent RNA helicase DDX54 |
| A0A0B4J1V8_HUMAN | A0A0B4J1V8 | PPAN-P2RY11 | HCG2039996 |
| STAT2_HUMAN | P52630 | STAT2 | Signal transducer and activator of transcription 2 |
| ITPR3_HUMAN | Q14573 | ITPR3 | Inositol 1,4,5-trisphosphate receptor type 3 |
| TM109_HUMAN | Q9BVC6 | TMEM109 | Transmembrane protein 109 |
| K7EM85_HUMAN | K7EM85 | ARHGAP45 | Rho GTPase-activating protein 45 |
| IDE_HUMAN | P14735 | IDE | Insulin-degrading enzyme |
| RADI_HUMAN | P35241 | RDX | Radixin |
| SEM7A_HUMAN | O75326 | SEMA7A | Semaphorin-7A |
| RHG24_HUMAN | Q8N264 | ARHGAP24 | Rho GTPase-activating protein 24 |
| ERLN1_HUMAN | O75477 | ERLIN1 | Erlin-1 |
3.3. CD40 Is the Most Significantly Downregulated Protein after NPM1 Silencing in Cisplatin-Resistant Bladder Cancer Cells
After NPM1 silencing, the differential expression of proteins was ranked from high to low in cisplatin-resistant bladder cancer cells and found that downregulation of CD40 expression was the most obvious (fold change: −2.66), as shown in Table 4.
| Differential protein | Ratio |
|---|---|
| Tumor necrosis factor receptor superfamily member 5 (CD40) | −2.66129 |
| Nucleophosmin (NPM1) | −1.98803 |
Western blot showed that the expression of CD40 in three NPM1 silencing bladder cancer cell lines was downregulated. In the western blot analysis, the level of CD40 protein in the T24/0.8DDP Lv-NPM1 cell line was 0.61-fold as high as that in T24/0.8DDP Lv-NC (p < 0.05). The level of CD40 protein in the BIU-87/0.3DDP Lv-NPM1 cell line was 0.65-fold as high as that in the corresponding negative control BIU-87/0.3DDP Lv-NC (p < 0.05). The level of CD40 protein in the PUMC-91/0.6DDP Lv-NPM1 cell line was 0.56-fold as high as that in the corresponding negative control PUMC-91/0.6DDP Lv-NC (p < 0.05). This results were consistent with those of mass spectrometry, as shown in Figure 3.
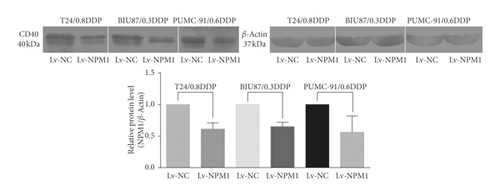
This results were consistent with those of mass spectrometry. This result was confirmed by western blot in three NPM1 silencing bladder cancer cell lines (T24/0.8DDP Lv-NPM1, BIU87/0.3DDP Lv-NPM1, and PUMC-91/0.6DDP Lv-NPM1).
4. Discussion
Because bladder cancer is prone to drug resistance and recurrence, it makes it difficult for a reasonable and targeted treatment strategy. Timely screening or monitoring can help doctors prevent and treat the disease as soon as possible.
In order to improve the sensitivity of early diagnosis and alleviate the pain of patients, the researchers are trying to find some noninvasive biomarkers of bladder cancer for clinical practice. Noninvasive biomarkers of bladder cancer have been found to monitor the prognosis of normal bladder cancer [15], such as cytokeratin 18 protein fragment [16]. But there no sensitive and specific biomarker has been found that can early monitor the progress of drug-resistant bladder cancer.
Nucleophosmin (NPM1) is a protein biomarker that can reflect the therapeutic effect of chemotherapy [17], which not only has the function of monitoring the progression in hematological diseases [18, 19], but also has differential expression in some solid tumors such as colon cancer [20] and lung adenocarcinoma [21]. In proteomic analysis of drug-resistant bladder cancer, the expression of NPM1 has been proved to be significantly different [22]. It has also been reported that NPM1 can be used as a valuable prognostic marker of disease [23, 24].
In our previous experiments [10], it has been confirmed that the differential expression of NPM1 can reflect the oncological characteristics of cisplatin-resistant bladder cancer. Downregulation of NPM1 can accelerate the invasion and the growth of cisplatin-resistant bladder cancer. In addition, NPM1 can also reflect the development of cisplatin-resistant bladder cancer. However, as the protein is located in the nucleolus, NPM1 can hardly be monitored as early as to be found as extracellular proteins, which limits its value as a biomarker of tumor in the urine.
CD40, a member of the superfamily of tumor necrosis factor receptors involved in cell differentiation [25], has been proved to be an effective tumor marker in many tumors [26–28], especially in non-B-cell-derived solid tumors, such as nasopharyngeal carcinoma [29], normal bladder cancer [12], cervical cancer [30], and renal cancer [11]. In addition, CD40 has gradually become an effective target for immunotherapy [31].
CD40 can be detected in the exosomes [32]. Some studies have confirmed that CD40 is easy to be monitored early and is related to urinary system diseases such as renal cell carcinoma [9]. However, the value of CD40 in drug-resistant bladder cancer has not yet been evaluated. If we can determine the relationship between CD40 and functional proteins in drug-resistant bladder cancer, we can greatly expand the application of CD40.
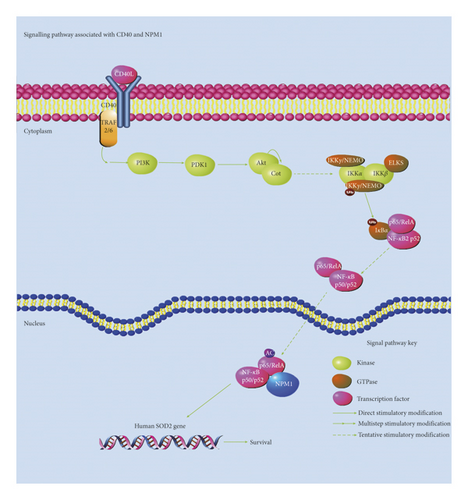
To evaluate the value of CD40 as a biomarker in cisplatin-resistant bladder cancer, we established NPM1 silencing stable cell lines by lentivirus infection in three cisplatin-resistant bladder cancer cell lines. According to the research experience, three kinds of drug-resistant bladder cancer can better illustrate the experimental results [33–35]. The results showed that the knockdown efficiency of the NPM1 gene was about 70%, which suggests that silencing the NPM1 gene by lentivirus is effective. The most representative T24 cell line in these three kinds of cell lines was further quantitatively analyzed by mass spectrometry. After NPM1 gene silencing, 492 differential proteins were detected by mass spectrometry, whose variation was more than 1.5 times (p < 0.05). A total of 57022 peptides, 54347 unique peptides, and 6686 protein groups were identified in all proteins of the tested cells (FDR < 0.01). Hierarchical clustering and principal component analysis showed that 264 functional proteins were downregulated and 228 functional proteins were upregulated in the gene silencing group compared with those of the negative controls. By GO analysis, the proteins affected by NPM1 cover a large number of proteins with biological functions, which may play an important role in the development of tumor in 492 differential proteins. The pathogenesis of oncology often needs to be explained by the changes of the protein in the signal transduction pathway. In MS analysis, the differential expression of NPM1 results in the change of a large number of functional proteins, in which most of them were signal transduction proteins. NF-kappa B signaling pathway can be involved in cell response of cells to external stimuli, such as the effect of cisplatin on drug-resistant bladder cancer. Interestingly, NPM1 has also been proved as an NF-kappaB coactivator for inducting human gene resistance to cell adverse factors [36]. It has been proved that CD40 can regulate the expression of the NF-kappa B signaling pathway through the noncanonical pathway [37, 38].
We further found that CD40 was the most significantly downregulated protein after NPM1 silencing, with a difference of 2.6 times change in abundance, whose expression was positively correlated with NPM1 expression.
The results showed that the variation characteristics of CD40 and NPM1 were consistent. Based on our experimental results and other research studies on NPM1 and CD40, we summarized the related pathways of CD40 and NPM1, as shown in Figure 4. CD40 can be related to the survival, growth, and prognosis of tumors and reflects the changes of the NF-kappa B pathway related to NPM1. In the future, we need further experiments, such as effects of overexpression of CD40 and inhibition of CD40 on the expression of NPM1, to support the claim that NPM1 and CD40 change consistently.
5. Conclusion
In view of the downregulation of CD40 expression in cisplatin-resistant bladder cancer cells after NPM1 silencing, CD40 can be related to the survival, growth, and prognosis of tumors and reflects the changes of the NF-kappa B pathway related to NPM1, which indicates CD40 could be used as a biomarker to monitor the progression of cisplatin-resistant bladder cancer.
Disclosure
Chenshuo Luo is the co-first author of this study.
Conflicts of Interest
The authors declare no conflicts of interest.
Authors’ Contributions
All authors participated in the design, interpretation of the studies, analysis of the data, and review of the manuscript; Chenshuo Luo was a major contributor in writing the manuscript. Ting Lei analyzed and interpreted the results of the experiments. Man Zhao, Qian Meng, and Man Zhang put forward ideas and assisted in the progress of experiments.
Acknowledgments
This work was supported by the Beijing Natural Science Foundation, Beijing Municipal Administration of Hospitals’ Ascent Plan (grant number: DFL20150701), and Enhancement Funding of Beijing Key Laboratory of Urinary Cellular Molecular Diagnostics (grant number: 2019-JS02).
Open Research
Data Availability
The data used to support the findings of this study are included within the article.


