Research on the Dynamic Erosion Wear Characteristics of a Nozzle Flapper Pressure Servo Valve Used in Aircraft Brake System
Abstract
The nozzle flapper pressure servo valve is a kind of high-precision hydraulic component that can be widely used in the aircraft brake system. In actual service, the dynamic erosion wear behavior will occur at the pilot stage because of the gradual contamination of oil and the variable distance between nozzle and flapper. For this purpose, the paper proposes a dynamic erosion wear characteristics analysis and service life prediction method in which firstly the structural feature and working principle of the nozzle flapper pressure valve are analyzed using the brake cavity as the load blind cavity. Secondly, the dynamics simulation model and the performance experiment system of the pressure valve are separately constructed, and then the validation of the constructed model is conducted by contrasting the results between simulation and experiment. Finally, the mathematical models of the degradation process induced by the dynamic erosion wear are established, and then the dynamic erosion wear characteristics under dynamic structural distance and contamination conditions are analyzed, which are combined with the failure threshold value determined by the dynamics simulation to finish the service life prediction of the nozzle flapper pressure servo valve.
1. Introduction
As one of the aircraft’s important components, the brake system mainly makes full use of the friction between the tire and the ground to make the aircraft stop on the runway quickly and safely. The brake system can be used in the taking off, landing, moving, and stopping on the ground stages of the aircraft, which is an important guarantee for aircraft’s safe operation [1]. The brake hydraulic system of aircraft is mainly composed of pressure servo valves, pressure sensitive elements, electromagnetic lock, oil cleaning elements, check valves, solenoid valves, and other parts, in which the performance of various electrohydraulic pressure servo valves determine the performance of the whole brake system.
The electrohydraulic pressure servo valve is essentially a relief valve, after receiving the input electric control signal, which outputs corresponding modulated pressure. The pressure servo valve was first used in the aircraft brake system in 1950; the two-stage pressure servo valve designed and developed in the world mainly includes nozzle flapper pressure valve, jet pipe pressure valve, deflector jet pressure valve, rotary direct drive pressure valve, etc. But at present, the pressure valve widely used in the brake hydraulic system of civil and military aircraft mainly includes nozzle flapper pressure valve and jet pipe pressure valve [2]. The outstanding advantages of the nozzle flapper pressure servo valve (NFPSV) contain three aspects: the inertia of flapper is small, the offset distance is small, there is no effect of the frictional pairs, so its dynamic response speed is fast, its control sensitivity is high, its linearity is good, and its zero drift is small. But the outstanding deficiency of NFPSV is the poor contamination resistant capability.
As we all know, the hydraulic components are sensitive to oil contamination. The data show 70%–80% of failures are caused by oil contamination, that is, oil contamination is always the fatal injury of the hydraulic control system. The distance between nozzle and receiver of jet pipe pressure valve’s pilot stage is 0.2 mm–0.4 mm, while the distance between nozzle and flapper of nozzle flapper pressure valve’s pilot stage is only 0.03–0.05 mm, which determines that the contamination resistant capability of the latter is far lower than that of the jet pipe pressure valve, and the oil cleanliness is required to be no lower than that of NAS6 [3–5]. In actual service, the flapper deflection and erosion wear will cause the dynamic change of erosion distance between nozzle and flapper. Oil deterioration will lead to the dynamic aggravation of erosive wear course, which determines that the erosion wear of nozzle flapper pressure valve’s pilot stage is a dynamic process and finally induces the performance degradation or even failure of the whole brake pressure valve. Therefore, it is of great significance to construct the model of nozzle flapper pressure valve and to study the dynamic erosion wear characteristics for predicting the performance degradation of the brake system and preventing the occurrence of major safety accidents.
The research on the nozzle flapper pressure valve has a long history, but the related published literature mainly focuses on the nozzle flapper flow valve, and the research contents mainly focus on the flow characteristics of its nozzle and secondary valve port, the dynamic characteristics of the flapper and torque motor, the hydrodynamic characteristics of the secondary valve core, the overall mathematical model construction and optimal design of the nozzle flapper valve, and the influence of structural parameters and process parameters on flow field and performance of nozzle flapper valve [6]. The research on the nozzle flapper pressure valve mainly focuses on the electromechanical converter and the application of new materials. However, scholars have carried out research studies on the influence of oil contamination on the same type of hydraulic products by means of experiments, theoretical modeling, and finite element simulation: Wang et al. [7] designed the contamination wear test system with the double nozzle flapper electrohydraulic flow valve as the research object. Through the pretest of the servo valve, it was determined that the sensitive stress was the oil contamination level, and the performance degradation parameters of the test were pressure gain and internal leakage. Finally, the test method that accelerated degradation of step stress in contamination wear is given. Aiming at the outstanding problem that the brake system of military aircraft has a high failure rate due to oil contamination, Wang et al. [8] elaborated the main failure mode of the nozzle flapper servo valve after oil contamination and provided the specific countermeasures to improve the reliability of the aircraft brake system. Du et al. [9] analyzed the common failure mechanism of the double nozzle flapper flow valve due to its low contamination resistant capability. By disassembling and analyzing a large number of fault servo valves, the main reason for the stuck failure of the nozzle flapper servo valve was obtained. Li et al. [10] analyzed the dominant progressive failure mode of the LEHA. The piecewise linearization method is applied to update the concentration of contaminated particles within the LEHA; the main contribution of the proposed model is the application of the dynamic concentration of contamination particles in erosion analysis of electrohydraulic servo valves (EHSVs), throttle valves, spool valves, and needle valves. Liu et al. [11] investigated the erosive behavior and influence of solid particles in hydraulic spool valve without notches. The CFD simulation of solid-liquid two-phase flow was carried out by discrete phase model (DPM) to analyze the erosion failure. The exact calculation method of the orifice area under erosion was discussed and put forward. For the erosion of jet pipe servo valve’s pilot stage, the trajectory of the oil and particles in the multiphase flow was analyzed by Yin et al. [12], and then the influence law of parameters such as the velocity and impact angle of particles to the erosion wear was carried out. Based on the Fluent software, Chu et al. [13] established a visual simulation model of nozzle to receiver in the pilot stage and then carried out simulation of erosion rate and calculation of the servo valve’s theoretical life. Based on the above, the main deficiencies about current research studies of the nozzle flapper pressure valve under oil contamination conditions are as follows: (1) most analyses about the influence of oil contamination to pilot stage are only qualitative analyses; (2) the real-time distance between nozzle and flapper is not considered; (3) the influence of oil contamination level’s change is not considered; and (4) the quantitative analysis of the service life of entire pressure valve under dynamic erosion wear conditions is not performed.
To solve these issues, this paper is focused on the dynamic erosion wear characteristics analysis and service life prediction of a NFPSV. Firstly, the structural feature and working principle of the nozzle flapper pressure valve are analyzed using the brake cavity as the load blind cavity; this is the basis of all research work. Secondly, the dynamics simulation model and the experiment system of the pressure valve are separately constructed; the purpose of the established NFPSV mathematical model validated by the experiment is to simulate and determine the threshold value of deterioration parameter that will induce the failure of pressure valve. Finally, the degradation process models induced by the dynamic erosion wear are established, and then the dynamic erosion wear characteristics under dynamic structural distance and contamination conditions are analyzed, which are combined with the failure threshold value determined by the dynamics simulation to finish the service life prediction of the nozzle flapper pressure valve.
2. Structural Feature and Working Principle of the NFPSV
The nozzle flapper pressure valve is composed of torque motor, nozzle flapper assembly, slide valve, return spring, and pressure feedback path. The structure of nozzle flapper pressure valve is shown in Figure 1, where R, P, J, and S represent the oil return port, slide valve pressure inlet, pilot stage pressure inlet, and brake port of the servo valve, respectively, P and J provide 21 MPa oil pressure for the servo valve, and when the brake port J is connected with the aircraft brake system, the brake cavity is a special blind cavity structure [14].
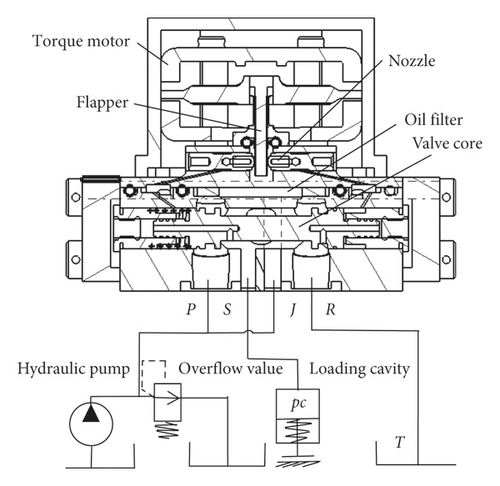
When the control signal is input to the coil of the servo valve, a control torque is generated in the armature assembly, which makes the armature assembly deflect anticlockwise, the flapper deviates to the right, and the clearances between the flapper and the two nozzles are different, so a control pressure difference is generated on the annular surface at both ends of the valve core, which makes the valve core move to the left; the oil return control edge is gradually closed, the oil inlet control edge is gradually opened, and the brake pressure is increased. When the control force acting on the valve core is balanced with the feedback force, the valve core is stable at a certain position (the oil inlet port, the brake port, and the oil return port are not mutually connected) and the servo valve outputs a brake pressure proportional to the input current to realize the pressure control with positive gain.
3. Mathematical Model of the NFPSV
3.1. Model Construction of the NFPSV
3.1.1. Balance Equation of the Torque Motor
3.1.2. Displacement Equation of the Flapper
3.1.3. Equation between the Flapper and Slide Valve
3.1.4. Output Equation of the Slide Valve
3.1.5. Mathematical Model of the Entire Valve
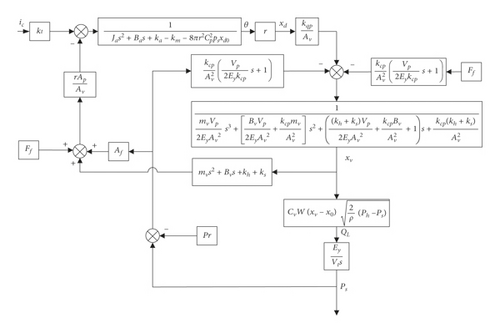
Based on equations (1)–(10), Laplace transformation is conducted; thus, the dynamic characteristics block diagram of the nozzle flapper pressure valve can be obtained as Figure 2.
3.2. Model Validation of the NFPSV
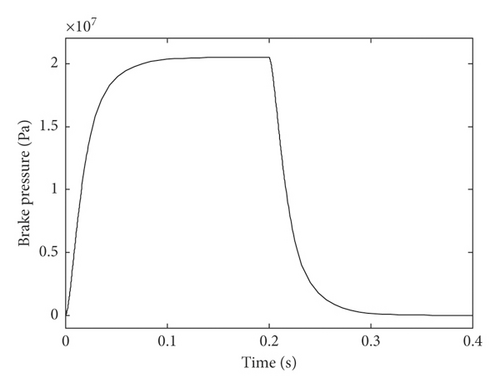
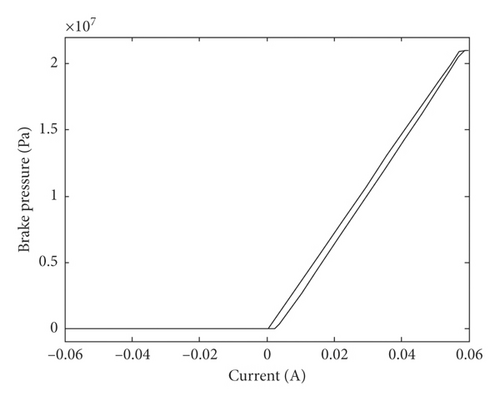
We build a MATLAB/SIMULINK simulation program and set the simulation parameters as Table 1. The pressure response of the nozzle flapper servo valve when the square wave signal is input is shown in Figure 3. It can be seen under the initial structural parameters that the system pressure quickly stabilizes at 21 MPa after receiving the 60 mA input signal. However, the output pressure will gradually deteriorate because of the extension of service time and the increase of the oil contamination level. Figure 4 shows the control brake pressure curve of nozzle flapper pressure valve; the brake pressure is not symmetrical to current because the slide valve structure is dissymmetric.
| Parameter | Value |
|---|---|
| kt (Nm/A) | 1.06 |
| Ja (kg·m2) | 1.2e − 7 |
| Ba (Nm/rad·s) | 7e − 5 |
| ka (Nm/rad) | 20.85 |
| km (Nm/rad)) | 11.4 |
| r (m) | 0.017 |
| Cp | 0.7 |
| ρ (kg/m3) | 1070 |
| xd0 (m) | 5e − 5 |
| kqp (m3/s/m) | 9.2e − 2 |
| Ey (Pa) | 7e9 |
| Av (m2) | 2.87e − 5 |
| Ap (m2) | 2.83e − 7 |
| Vp (m3) | 4.28e − 8 |
| mv (kg) | 0.004 |
| Vt (mL) | 400 |
| Bv (N/m/s) | 50 |
| kh (N/m) | 20.6 |
| ks (N/m) | 2.58 |
| Ff (N) | 0 |
| Pr (MPa) | 0.5 |
| Af (m2) | 3.74e − 6 |
| Ph (MPa) | 21 |
| W (m) | 3.5e − 3 |
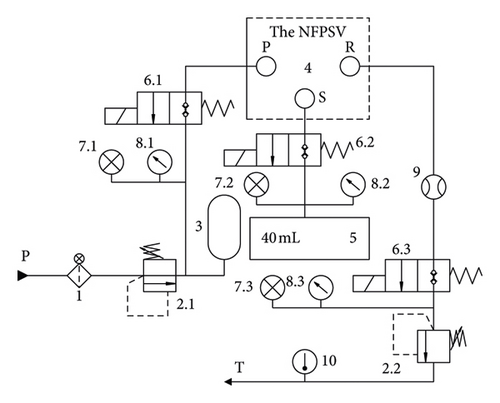
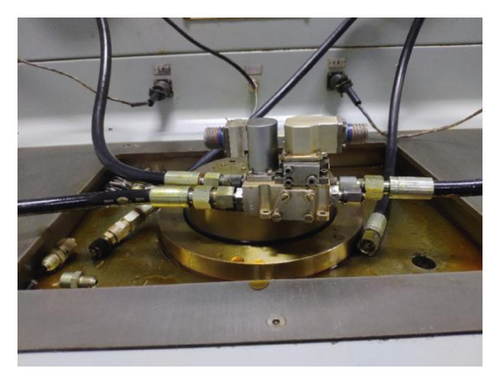
For providing an accurate threshold value of deterioration parameter inducing the failure of NFPSV, the experiment shown as Figure 5 is established to validate the dynamic simulation model shown in Figure 2. Figure 5(a) shows the hydraulic system principle diagram of the NFPSV’s test bench, in which the NFPSV selected by dotted line is shown in Figure 5(b), where P, S, and R are, respectively, the oil inlet port, brake port, and the oil return port. And the NFPSV, the pressure sensor, the check solenoid valve, and so on are connected with computer for measurement and control. During the experiment, the pressure of oil inlet port P and oil return port R are set as 21 MPa and 0.5 MPa, and then a square wave signal with amplitude of 60 mA and width of 0.2 s is sent to the NFPSV; also, the pressure response of brake port P is measured and analyzed.
The comparison between simulation and experiment results is shown in Table 2; it can be seen that the maximum error between simulation and experiment results is 10%; also, the simulation value and experiment value of all performance indexes meet the engineering design requirements; therefore, we can conclude that the construction model is relatively reasonable and can be used in the service life prediction of NFPSV.
| Performance index | Simulation value | Experiment valve | Error (%) |
|---|---|---|---|
| Rise time (ms) | 44 | 43 | 2.27 |
| Fall time (ms) | 45 | 47 | 4.44 |
| Overshoot | 0 | 0 | 0.00 |
| Steady-state error | 0 | 0 | 0.00 |
| Linearity | 2.8% | 3% | 7.14 |
| Hysteresis | 2% | 1.80% | 10.0 |
| Dead zone (mA) | 3.2 | 3.5 | 9.38 |
4. Dynamic Erosion Wear Characteristics of the NFPSV
4.1. The Dynamic Erosion Wear Characteristics of the NFPSV
4.1.1. Mathematical Model of the Degradation Process
-
Particle force equation: analyzing the force of particles, the particle motion equation is established as equation (13), solving the differential equation in Lagrangian coordinate system to obtain the motion orbit of particles.
-
where up and u are the velocity of particle and liquid; ρp and ρ are the densities of particle and liquid; Fd(u − up) is the drag force on particles; (gx(ρp − ρ)/ρp) is the gravity of particles; and Fx is the additional force.
-
Wall collision model: the particles move with hydraulic oil and will be back to the flow field when bounced against the wall. The rebound coefficient proposed by Grant and Tabakoff [15] is used to describe the change of normal and tangential directions’ momentum of particles before and after collision with the wall.
-
Particle distribution model: different diameter particles are distributed in the contaminated oil, which can be expressed by the Rosin-Rammler equation:
-
where d and are the diameter and the mean diameter of particles (the value of is obtained by noting the value of d at which yd = e−1 ≈ 0.368); yd is the mass fraction with diameter greater than d; and n is the spread parameter, whose value is given as
-
Erosion wear model: the model was proposed by Edwards et al. [16] through erosion experiments of sand to surface of carbon steel, which is used for the erosion rate calculation of servo valve:
-
where Re is the erosion rate; p is the particle number; mp is the mass flow rate of particle; dp is the diameter of particle; C(dp) is the function of particle diameter; α is the impact angle between particle trajectory and wall; f(α) is the function of impact angle (the value of f(α) is shown in Table 3 [17]); b(v) is the function of particle’s relative velocity; and Af is the area of particle impact wall.
| Number | Angle α (°) | f(α) valve |
|---|---|---|
| 1 | 0 | 0 |
| 2 | 20 | 0.8 |
| 3 | 30 | 1 |
| 4 | 45 | 0.5 |
| 5 | 90 | 0.4 |
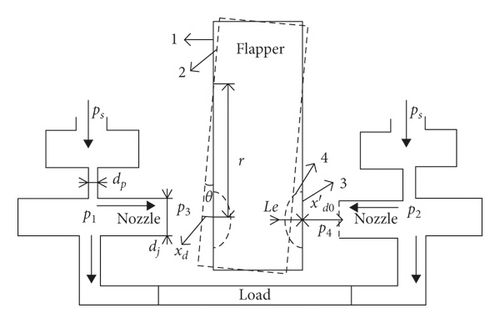
(3) Performance Degradation Mechanism Model. The nozzle flapper amplifier shown in Figure 6 is the core of nozzle flapper pressure valve, in which the oil enters the nozzle flapper amplifier with pressure ps from the top and then ejects from the fixed orifice with p1 and p2 after accelerating and reducing pressure. When the flapper deflects xd, the two settable orifices between the flapper and nozzles are no longer aligned, which results in the left back pressure p1 and control pressure p3 not being equal to the right p2 and p4.
4.1.2. The Simulation of Dynamic Erosion Wear Characteristics
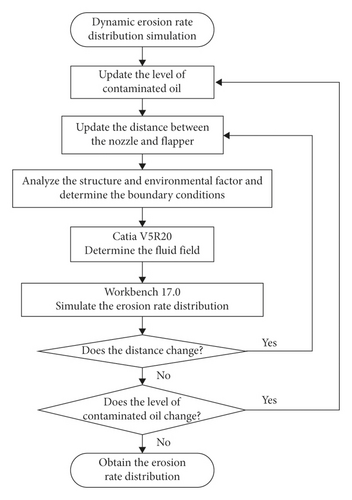
The flow field from nozzle to flapper is relatively complicated, and the erosion rate is the largest; thus, the grid is encrypted in these places, and numerical simulation of erosion rate is performed using Fluent. Set 21 MPa pressure as the inlet boundary condition, 0.5 MPa pressure as the outlet boundary condition, 1070 kg/m3 as the oil density, and 0.0123 Pa·s as the oil dynamic viscosity. For improving the precision of calculation, the second-order upwind is selected and all the residuals are ensured less than 10−5 in the simulation. On the basis of continuous phase’s convergence, the discrete phase model is set up to simulate the movement of particles and calculate the erosion rate. The concentration and distribution of particles in the oil are determined according to the GJB420B standard. The particles distribution obey the Rosin-Rammler distribution, the average diameter of particles is set as 44 μm, the spread parameter is set as 1.52, and the discrete random walk model is used to deal with the interaction between the particles and the discrete vortex of the fluid; based on the above setting, the actual different operating conditions are numerically simulated as shown in Figure 7.
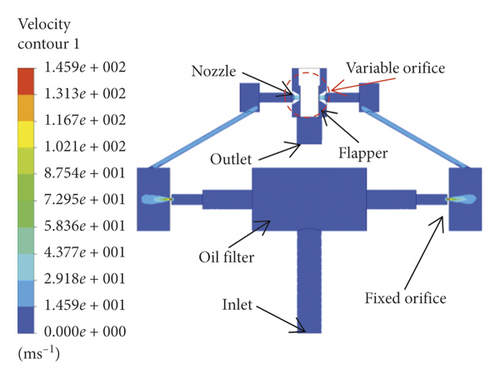
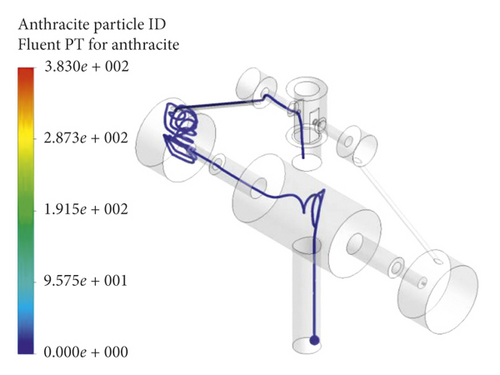
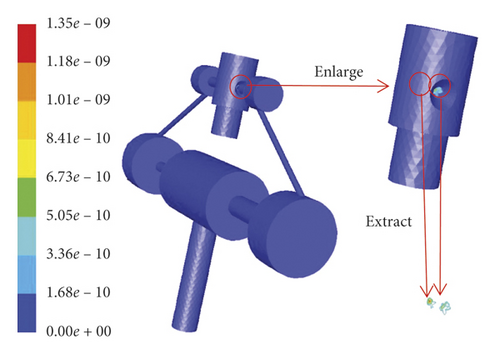
(1) Simulation When the Flapper Is in Zero Position. When the flapper is in zero position, the flow velocity distribution of the pilot stage is shown in Figure 8. The oil enters the oil filter from the inlet, decreases pressure and increases speed at the fixed orifice, flows through the nozzle and collides with the flapper, and finally goes back to the outlet. The trajectory of the single contaminated particle moving along is shown in Figure 9. It can be found the place where the most intense collision of particle is the projection area of the two nozzles on the flapper, and according to the model of erosion rate shown as equation (18) about the impact angle and velocity parameters, it can be inferred the erosion rate distribution is shown in in Figure 10, its maximum value is 1.35e − 9 (kg/m2s).
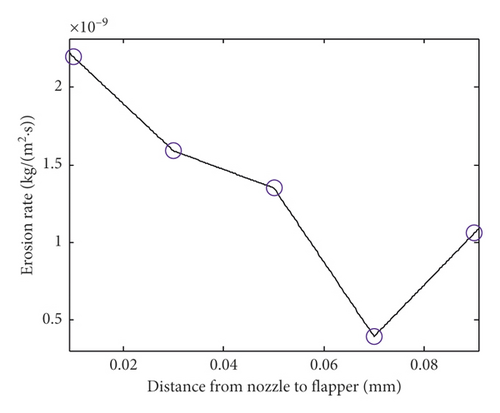
(2) The Relation between Erosion Rate and Distance from Nozzle to Flapper. According to the actual situation, several groups of erosion rate are calculated after changing the distance between nozzle and flapper; the relation curve shown in Figure 11 is fitted using MATLAB. It is easy to find that the erosion rate decreases on the whole with the increase of distance from 0.01 mm to 0.09 mm, but it reaches the minimum value 3.9e − 10 (kg·m2·s−1) at 0.07 mm.
The initial clearance between nozzle and flapper is 0.05 mm, and the distance between nozzle and flapper Ld also includes the offset of flapper xd and the erosion distance Le. Figure 12 shows the response of flapper under the step input of nozzle flapper pressure servo valve. In the starting time 0.01 s, the offset of flapper rises rapidly to 24 μm and fluctuates up and down and then stabilizes at 14 μm. Furthermore, the dynamic erosion rate under dynamic distance from nozzle to flapper can be obtained as Figure 13 by combining the relation between erosion rate and distance from nozzle to flapper and the response of flapper.
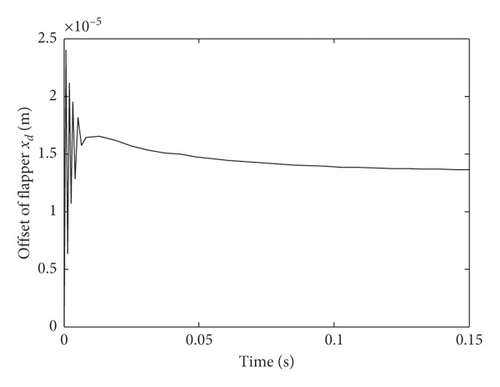
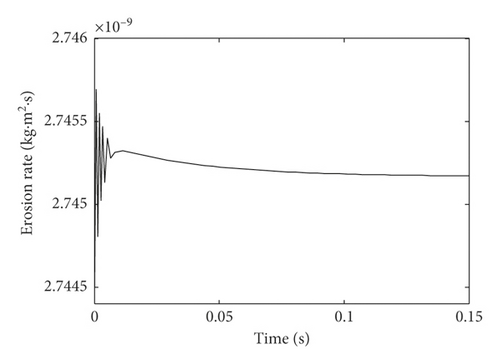
From Figure 13, we know the dynamic erosion rate response has the general same regulation as the offset of flapper. For the service life prediction of nozzle flapper pressure valve, the average erosion rate can be determined by integrating the dynamic erosion rate with respect to time and taking the average value about time. Assuming the erosion time is 120 seconds, the dynamic erosion rate is used to simulate the erosion length Le (1.514e − 10 m), which is added into the clearance between nozzle and flapper to simulate again; it is found that the change of the average erosion rate is small, so it is ignored in the real-time distance between nozzle and flapper.
(3) The Relation between the Erosion Rate and Oil Contamination Level. The diameter of particles is set as 1 μm, 3 μm, 5 μm, 7 μm, 10 μm, 20 μm, 50 μm, 80 μm, and 100 μm, respectively, and other parameters are completely consistent. The simulation and fitting results shown in Figure 14 are the relation curves between erosion rate and particle diameter. It is not difficult to know that the erosion rate decreases with the increase of particle diameter and then increases to the maximum value when the particle diameter is 5 μm; after that, the erosion rate decreases and fluctuates under a small value. The reason is the erosion rate is mainly influenced by the number of particles in the oil and the impact energy of particles under the same condition of other parameters. Under the same mass flow rate, the number of small diameter particles is more than that of the bigger ones. Furthermore, the action of traction and other additional forces on the particles make the velocity of big diameter particles lower than the smaller ones, that is, the impact energy of big diameter particles is lower than that of the small diameter particles when their masses are equal. Based on above factors, the erosion rate decreases with the increase of the particle diameter on the whole and reaches the maximum value when the particle diameter is 5 μm.
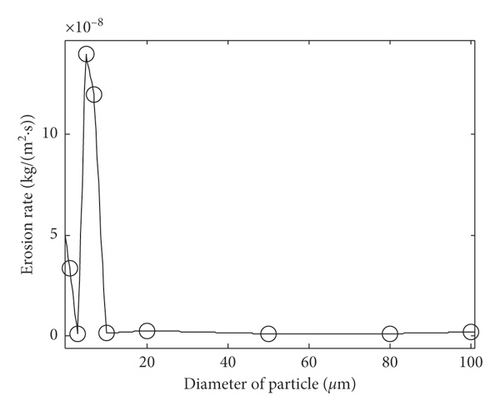
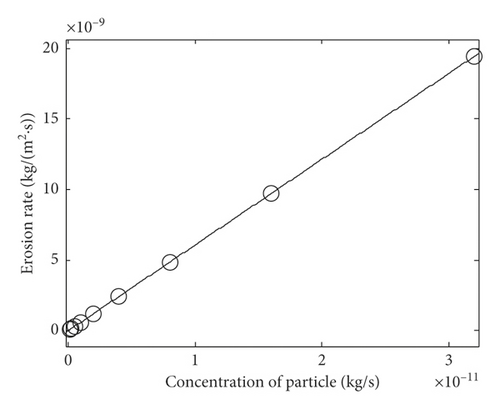
Figure 15 shows the relation curve between the erosion rate and concentration of particles, in which the particle diameter is fixed at 20 μm, the concentration of particles is set, respectively, as 1.25e − 13 kg/s, 2.5e − 13 kg/s, 5e − 13 kg/s, 1e − 12 kg/s, 2e − 12 kg/s, 4e − 12 kg/s, 8e − 12 kg/s, 16e − 12 kg/s, and 32e − 12 kg/s, and other parameters are completely consistent. The relationship between the increase of erosion rate and the increase of particle concentration is almost linear because in the effective range of particle concentration, the removal amount of the receiver as the target is directly proportional to the amount of contamination particles.
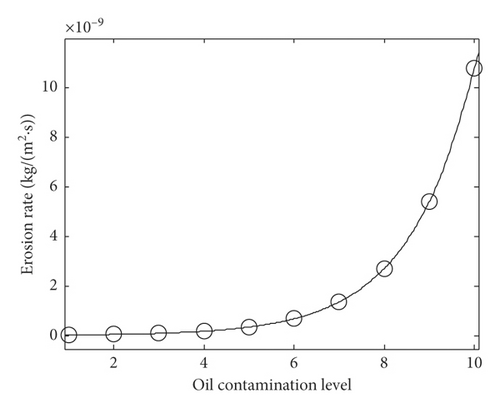
According to GJB420B, different oil contamination levels contain the same particle diameter distribution, but the particle concentration is different. The oil contamination level is set as 1, 2, 3, 4, 5, 6, 7, 8, 9, and 10, respectively, the particle distribution obeys the Rosin-Rammler distribution, and other parameters are completely consistent. The simulation and fitting result shown in Figure 16 is the relation curve between oil erosion rate and oil contamination level. The erosion rate increases exponentially with the increase of oil contamination level. The reason for this result is that although the particle diameter distribution of different oil contamination levels is completely consistent, but the particle concentration between adjacent oil contamination level meets the relationship of twice according to GJB420B.
4.2. The Service Life Prediction of the NFPSV
Under the condition of oil contamination, the service life of the whole nozzle flapper pressure valve is determined by the dynamic erosion wear of the pilot stage consisting of nozzles and flapper. From the analysis and calculation, the dynamic erosion rate of pilot stage varies with the change of distance between the nozzles and flapper and the oil contamination level. Based on the dynamic erosion rate, the more practical service life of nozzle flapper pressure valve can be obtained by combining the failure threshold value of the key deterioration parameter xd0.
4.2.1. The Determination of Failure Threshold Value
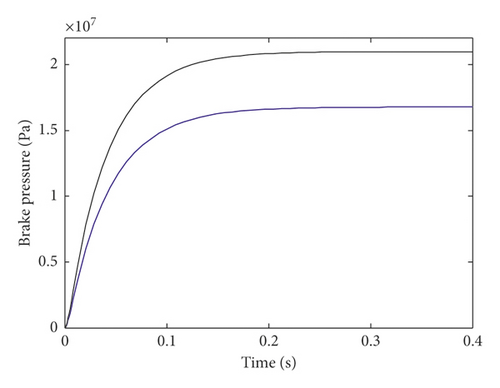
Figure 17 shows the step response of nozzle flapper pressure value; the black curve is under the initial clearance 50 μm and the blue curve is under the threshold clearance 61 μm between nozzle and flapper. From which, we conclude the change of clearance between nozzle and flapper can induce the dynamic performance degradation until the failure of NFPSV when the threshold value is determined by the 20% steady state error according to equation (24).
4.2.2. The Service Life Prediction Model

4.2.3. The Service Life Prediction of Nozzle Flapper Pressure Valve under the Dynamic Erosion Wear
Actually, the service life prediction is relatively complex because the erosion wear progress of pilot stage is dynamic which is affected by the distance between nozzle and flapper and the oil contamination level. It is necessary to comprehensively consider the two factors. The dynamic erosion rate considering real-time distance and oil contamination is, respectively, calculated, then the erosion length that can be eroded is determined by the judgment rule, based on equations (25)–(27), the life under different oil contamination levels is determined, and finally the service life of nozzle flapper pressure valve is determined as shown in Table 4.
| Item | Value | |||
|---|---|---|---|---|
| Oil contamination level | 6 | 7 | 8 | 9 |
| Dynamic erosion rate Ed (kg/(m2s)) | 2.7452 (×10−9) | 5.490 (×10−9) | 1.0981 (×10−8) | 2.1962 (×10−8) |
| Erosion length (mm) | 0.011 | |||
| Number of flight takeoff landing M | 500 | |||
| Maintenance number ni | 10 | |||
| Life under single oil level (flight takeoff) | 35729 | 17866 | 8932 | 4466 |
| Erosion distance (μm) | 1.5394 | 3.0787 | 6.1575 | 0.2244 |
| Service life (flight takeoff landing) | 15091 | |||
5. Conclusion
- (1)
Under the initial structural parameters, the brake pressure increases quickly with the increasing input signal and finally stabilizes at 21 MPa when the amplitude of received signal is 60 mA, and then the brake pressure decreases quickly at 0 MPa when the amplitude of received signal is 0 mA. The data of increasing process show that the rising time is 44 ms and the overshoot and the steady-state error are all 0.
- (2)
The dynamic erosion wear characteristics of NFPSV are mainly reflected by the distance between nozzle and flapper and the oil contamination level. The erosion rate decreases with the increase of distance from 0.01 mm to 0.09 mm, but reaches the minimum value 3.9e − 10 (kg·m2·s−1) at 0.07 mm. The erosion rate increases exponentially with the increasing of oil contamination level because the particle concentration between adjacent oil contamination level meets the relationship of twice according to GJB420B.
- (3)
When the distance between nozzle and flapper is 61 μm, the steady-state error is 20%. Considering the oil contamination level and the threshold value 61 μm, the service life of nozzle flapper pressure valve is 15091 flight takeoff landings, and the results can be used to predict the use of NFPSV under oil contamination environments. In the next step, the service data of the product will be tracked to modify the analysis method for more accurate service life.
Conflicts of Interest
The authors declare that they have no conflicts of interest.
Acknowledgments
This study was supported by the National Natural Science Foundation of China (NSFC 51805403), the Special Research Project of Civil Aircraft (MJ-2016-S-54), the Project Supported by Natural Science Basic Research Plan in Shaanxi Province of China (NSBRP 2019JQ-836), and the Natural Science Foundation of Shaanxi Provincial Department of Education (NSSXE 19JK0416).
Open Research
Data Availability
The data used to support the findings of this study have not been made available because they are being used for further research.


