Target Detection Coverage Algorithm Based on 3D-Voronoi Partition for Three-Dimensional Wireless Sensor Networks
Abstract
The detection of target events is an important research area in the field of wireless sensor networks (WSNs). In recent years, many researchers have discussed the problem of WSN target coverage in a two-dimensional (2D) coordinate system. However, the target detection problem in a 3D coordinate system has not been investigated extensively, and it is difficult to improve the network coverage ratio while ensuring reliable performance of WSN. In addition, sensor nodes that are initially deployed randomly cannot achieve accurate target coverage in practice. Moreover, it is necessary to consider the energy consumption factor owing to the limited energy of the sensor node itself. Hence, with the objective of addressing the target event coverage problem of WSNs in 3D space applications, this paper proposes a target detection coverage algorithm based on 3D-Voronoi partitioning for WSNs (3D-VPCA) in order to ensure reliable performance of the entire network. First, we extend Voronoi division based on the 2D plane, which allows 3D-Voronoi partitioning of sensor nodes in 3D regions. Then, it is optimized according to the 3D-Voronoi neighbouring node partitioning characteristics and combined with the improved algorithm. Next, we set the priority coverage mechanism and introduce the correlation force between the target point and the sensor node in the algorithm, so that the sensor node can move to the target position for accurate coverage. Finally, we carry out related simulation experiments to evaluate the performance and accuracy of the proposed algorithm. The results show that the proposed algorithm can effectively improve the coverage performance of the network while ensuring a high overall coverage ratio.
1. Introduction
- (1)
How to effectively improve the coverage and node utilization rate of the entire network
- (2)
How to guarantee high coverage ratio and connectivity of the network, reduce the energy consumption of the nodes, and prolong the network life time
- (3)
How to design algorithms or methods to ensure that the experimental environment is closer to a realistic 3D environment
In this study, we mainly investigate the target detection coverage of WSNs in 3D space. Previous studies on target coverage detection have achieved significant progress in terms of the theory, method, and experiment of using a 2D plane coordinate system to solve the 3D target coverage problem in a real-world environment, as discussed in the literature [7–9]. However, relatively few studies have investigated the coverage of WSNs directly applied to a 3D coordinate system. On the one hand, it is because the research difficulty increases with the dimension. On the other hand, the coverage problem of sensor nodes in a realistic 3D environment is often affected by the surrounding complex terrain and adverse weather conditions. In a real-world environment, sensor nodes are usually randomly deployed in the monitoring area, resulting in low utilization of the nodes. Hence, how to reduce the energy consumption of the sensor nodes and improve the coverage ratio of the network and the reliability of the algorithm are critical factors to be considered. In the literature [3], a more realistic signal detection model has been developed to obtain information on the target event and make the final decision by using a probabilistic decision model. Furthermore, a probabilistic detection algorithm [3] has been proposed to exploit the local measurements collected by the sensor nodes and improve the utilization rate of the nodes. In addition, a tracking framework based on Voronoi Tessellations has been proposed [10], whereby two mobility models are designed to control the coverage degree according to the existence of the target. Although this method can effectively monitor target events and discover redundant nodes, it is not suitable for realistic 3D conditions. A target-based Voronoi greedy algorithm (TV-Greedy) has been proposed [11] to find approximate optional solutions in order to improve the coverage quality of the network nodes while maximizing the effective energy consumption of the nodes. Although the TV-Greedy algorithm can effectively improve the robustness of the network, it is difficult to apply it to a 3D coordinate system. Thus, it is difficult to directly apply the traditional WSN coverage methods for a 2D coordinate system to a 3D coordinate system. The environment and position information of the target point in 3D space are more complicated. Hence, we need to redesign the deployment scheme of the sensor nodes in 3D space and propose relevant algorithms to achieve effective target coverage and a high coverage ratio of the network.
- (1)
To the best of our knowledge, this is the first study to propose the application of the 3D-Voronoi partitioning method to target detection coverage of 3D WSNs.
- (2)
We propose an improved 3D-Voronoi algorithm to ensure a high coverage ratio of the WSN on the basis of the energy consumption and connectivity factors of the network.
- (3)
We optimize the traditional virtual force algorithm (VFA) to suit new environments and practical conditions. Furthermore, we conduct a full theoretical analysis of the algorithm and compare it with two other algorithms to verify its effectiveness and accuracy.
The remainder of this paper is organized as follows. Section 2 reviews the research progress and related studies on WSNs in recent years. Section 3 describes the design of the network model and the 3D-Voronoi partitioning model. In addition, it states the related definitions employed in this paper. Section 4 discusses how the related algorithms are designed and improved. Furthermore, it outlines the design steps of 3D-VPCA algorithm. Section 5 presents the theoretical analysis of the network coverage ratio and energy consumption of the proposed algorithm. Section 6 describes the simulations and experiments performed to compare the proposed algorithm with two other algorithms. Finally, Section 7 states the conclusions and briefly explores directions for future work.
2. Related Works
In recent years, many studies and analyses have been carried out using the Voronoi plane to divide target events and sensor nodes. In particular, the optimal deployment of sensor networks is currently a research hotspot. Under some special circumstances, sensor nodes are often randomly distributed in a region. Optimizing the cost and utilization of limited resources has become the focus of current research. For example, in [12], distributed self-deployment schemes of mobile sensors have been proposed to solve the problem of efficiently deploying wireless sensor nodes. The authors designed two schemes by using a Voronoi diagram and a centroid, namely, Centroid (i.e., based on centroid scheme) and Dual-Centroid (i.e., based on dual-centroid scheme), to improve the speed and efficiency of node coverage holes. In [13], the authors proposed a deployment method for nodes in large-scale and high-density WSNs on the basis of centroid Voronoi Tessellation (CVT), which approximates the solution through the geometry of random points. Furthermore, the authors proposed a deployment plan based on the given characteristics of the study area in order to achieve near-ideal deployment. In some cases, owing to the initial random distribution of sensor nodes, there are coverage holes in the monitoring area. Hence, it is necessary to consider the survival time and cost of the network. Therefore, a two-phase coverage enhancing algorithm for hybrid WSNs was proposed in [14]. In the first phase, the authors used a differential evolution algorithm to compute the candidate’s target point positions in the mobile sensor nodes in order to improve the coverage ratio. In the second phase, they used an optimization scheme for the candidate’s target positions calculated in the first phase in order to reduce the moving distance of the mobile sensors. Finally, accurate filling of the coverage holes was achieved. Furthermore, the power supply module of the sensor node is a dry battery with limited energy, which can supply power only for a certain period of time. Hence, the energy consumption of nodes is a key research consideration. In [15], the authors discussed the energy consumption issue of target detection in WSNs and established a framework for evaluating performance indicators to analyse the performance of sensor networks as well as the quality of service. In [16], the author discussed the key issues of how to balance the target detection quality and lifetime of WSNs, and two target-monitoring schemes were proposed. One exploits the residual energy in the network and uses the adjustable sensing frequency in different regions to improve the monitoring quality. The other provides a method for calculating the optimal frequency value of the nodes with residual energy. Although the network energy consumption and monitoring quality factors have been considered in [15, 16], they have not been comprehensively considered or verified for a 3D coordinate system. Furthermore, the algorithms and methods proposed in the abovementioned studies are based on a 2D coordinate system, whereas actual scenarios are tested and verified in a 3D environment. Hence, some coverage methods for realistic 3D environments have also been proposed. For example, in [17], the authors proposed a distributed algorithm for mobile robotic sensors to allow self-deployment of sensor nodes in a 3D environment in order to achieve complete blanket coverage. This algorithm aims to achieve full coverage of the network while considering issues such as obstacles in the environment, and it minimizes the number of sensor nodes and mobile energy consumption. In [18], the authors pointed out that traditional probability coverage problems of WSNs mainly focus on 2D space. However, most practical applications of WSNs are in 3D space. Hence, in [18], the authors introduced a probability model of 3D WSNs and proposed a scheduling algorithm (PMCCA) that uses Voronoi division to control the scheduling of the probability model nodes in the target region. In [19], a 3D space deployment algorithm was proposed for continuous target tracking to overcome the dispersion problem of the traditional virtual force algorithm as well as the short-time tracking problem in the process of target tracking. In addition, the authors combined the internode force, the obstacle repulsive force, and the attractive force between the monitored-path and the tracking target into a virtual resultant force, so that the coverage of the target path is more continuous and sustained. Compared with the traditional virtual force algorithm, the abovementioned algorithm improves the effective time of the continuous target-tracking process and shortens the time of losing targets. In general, the algorithm or method proposed in [17–19] achieves effective detection of targets in 3D conditions. By contrast, our scheme is more direct and effective, and we have made more comprehensive considerations. In [20], the complete coverage problem of mobile sensor networks in a 3D environment was studied. The authors proposed a decentralized random algorithm to drive a group of mobile sensors on the vertices of a truncated octahedral grid for complete coverage of a bounded 3D area. However, the node utilization is not high, and this approach is not suitable for target event monitoring. In [21], a new network coverage and optimization control strategy based on a genetic algorithm was proposed to solve the deterministic coverage problem of sensor nodes. In addition, the author reduced the 3D coordinate system to a 2D plane in order to determine the fitness function of the relevant solution, and they used iteration to find the optimal solution. However, the abovementioned approach is based on the conditions of node deterministic deployment and is not applicable to the random deployment conditions considered in this paper.
In early coverage research on 2D-Voronoi partitioning, a distributed self-deployment protocol for mobile sensors was proposed [22] to calculate the correct location of the mobile node in order to solve the coverage vulnerability problem. Furthermore, the author considered the transition problem of nodes in the coverage area from dense to sparse and designed three sensor node mobility assistance algorithms. Experiments showed that these algorithms can achieve a higher coverage ratio in a short time with limited moving distance. Owing to the random deployment of a large number of sensor nodes in a real environment, the network degree of coverage is not high. In [23], a mobile sensor network coverage optimization algorithm based on virtual force perturbation and cuckoo search (VF-CS) was proposed. The Voronoi diagram was divided into sensor nodes to form their respective Thiessen polygons; then, a virtual force between the polygon vertices and the neighbour nodes was introduced as the perturbation factor of the node position update. Finally, the cuckoo algorithm was used to optimize the mobile coverage. In [24], to solve the problem of coverage holes in static WSNs, the authors proposed a triangle patch method to enhance the mobile node’s ability to repair coverage holes. Finally, the authors used the algorithm auxiliary information provided by the coverage edge nodes to move the nodes to the best candidate location. In [25], to reduce the cost of the K-coverage sleep-scheduling algorithm and ensure effective monitoring by the nodes, the prescheduling-based K-coverage group scheduling (PSKGS) and self-organized K-coverage scheduling (SKS) algorithm were proposed. Finally, the authors concluded that the PSKGS algorithm improves the monitoring quality and network lifetime through simulation experiments, while the SKS algorithm reduces the computational and communication costs of the nodes. Obviously, the research based on 2D-Voronoi algorithms has shown better results, but it can rarely be applied to a 3D coordinate system. Therefore, this paper extends traditional Voronoi studies [22–24] to 3D wireless sensor network target detection coverage.
In the subsequent experiments, we compare the proposed algorithm with the CSA algorithm and the RA algorithm. Although the three algorithms can achieve effective detection, the coverage ratio of our algorithm is shown to be optimal.
3. Network Coverage and Voronoi Partitioning Method
3.1. Network Coverage Model
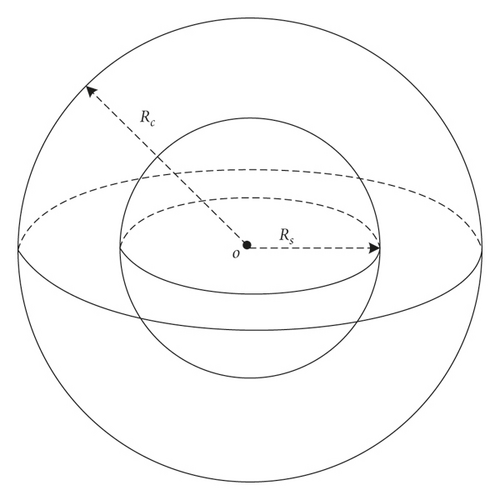
This paper studies the problem of WSN target detection coverage in a 3D environment. Therefore, we assume that the sensing model of the sensor node is a spherical coverage area with node coordinate si(xi, yi, zi) as the centre and the sensing range Rs as the radius. Initially, it is assumed that n sensor nodes are randomly scattered in a target area of size L × L × L, and the set of nodes is ni{n1, n2, ⋯, ni}. Owing to the random deployment of nodes in the initial stage, various problems, such as uneven distribution of sensor nodes, excessive energy consumption of nodes, and repeated coverage of some target points, may occur. Thus, the utilization of the node is reduced. Furthermore, some target points may be missing and not covered. As shown in Figure 1 below, some target points are in the coverage area of the nodes, and some are not covered by the nodes. Among them, the three black mesh spheres represent the coverage of three nodes, and the small black dots represent randomly distributed target point events. Furthermore, the node sensing model shown in Figure 2 represents the relationship between the communication radius of the node and its sensing radius. The proof in [26] shows that the connectivity between network nodes can be guaranteed when the communication radius of the node is at least two times the sensing radius, i.e., Rc ≥ 2Rs. Figure 2 shows the sensing model of the node, where the small balls represent Rs as the sensing range of the node o, and the large balls represent the communication range with Rc as the node o.

- (i)
The sensing radius Rs and communication radius Rc of the sensor node are isomorphic, and Rc = 2Rs
- (ii)
The sensor nodes can be moved in space
- (iii)
The sensor nodes can capture their own location information through some technical means
For a more intuitive follow-up analysis and discussion of this article, we introduce the following definitions to better describe the problem.
Definition 1. neighbour node. The communication range of the sensor nodes si is a sensing sphere with Rc as the communication radius. When the Euclidean distance d(i, j) between the two sensor nodes i and j in space satisfies d(i, j) ≤ Rc, the two nodes are said to be neighbour nodes. Thus, the spheres of the sensing range between the two nodes will intersect or be tangent [27].
Definition 2. network coverage ratio. In this paper, the probability sensing model can be used to determine the probability that any point p(x, y, z) in space is covered by node si as follows:
Suppose that there are n nodes s1, s2, ⋯, sn in the network, and their coverage ratios to a point p are sp(s1), sp(s2), ⋯, sP(sn), respectively. Then, the coverage ratio of point p in the network is
It should be noted that S(A) is a statistical value in the actual environment. When the value of k is sufficiently large, the statistical and theoretical values will be infinitely close.
3.2. 3D-Voronoi Model
3.2.1. Voronoi Principle
In early research on the 2D-Voronoi WSN coverage model, the initial nodes were randomly distributed in a 2D plane. Hence, a part of the same area or a single target point event may be covered by multiple sensor nodes, resulting in considerable node redundancy. To overcome this problem, many related studies have reduced the nodes in 3D space to a 2D plane and divided them using a Voronoi diagram. As shown in Figure 3, given a set of sensor nodes si = {s1, s2, ⋯, sn}, the bounded plane is divided into n polygonal cells Fi(i = 1,2, ⋯, n). Therefore, the cell Fn = {F1, F2, ⋯, Fn} of each node contains exactly one of the sensor nodes si, and si is called the Fi divided generation node [28]. Furthermore, according to the partitioning property of the Voronoi diagram, the distance from any point p in each unit Fi to si in the unit is shorter than the distance between the point p and the neighbour nodes around si.
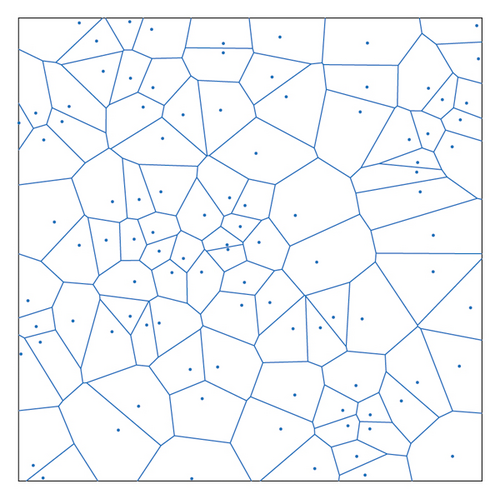
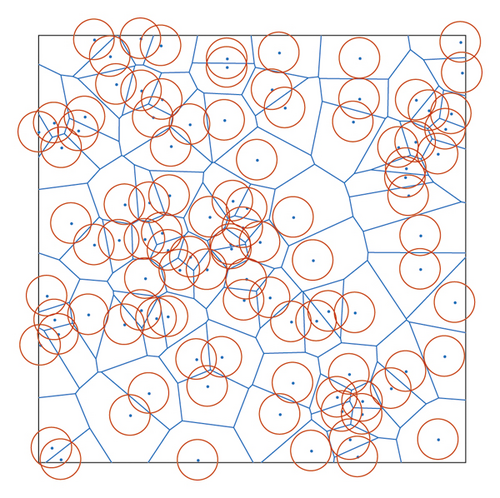
As shown in Figure 3, there are 100 sensor nodes distributed in the plane. According to the definition of the Voronoi diagram, each Voronoi unit contains its own unique node. As shown in Figure 4, the red circle represents the coverage of each node. Assuming that the sensing radius of each node is Rs, after the sensor nodes in the plane undergo Voronoi division, the coverage area of each node is πR2.
3.2.2. 3D-Voronoi Partition Method
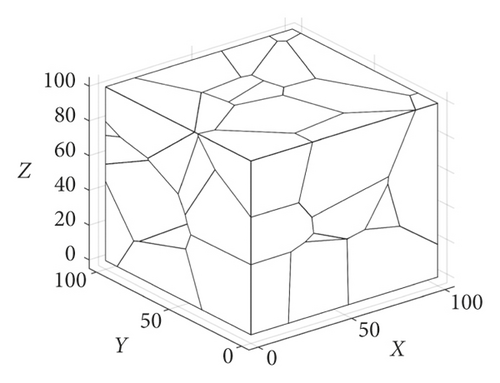
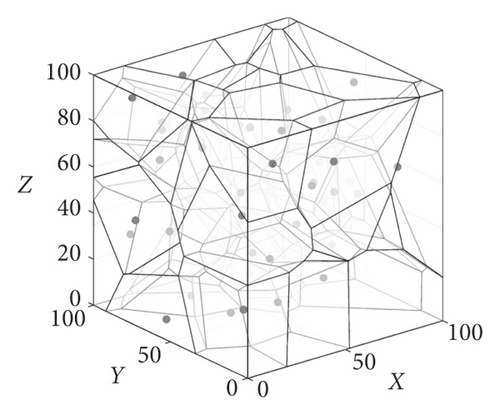
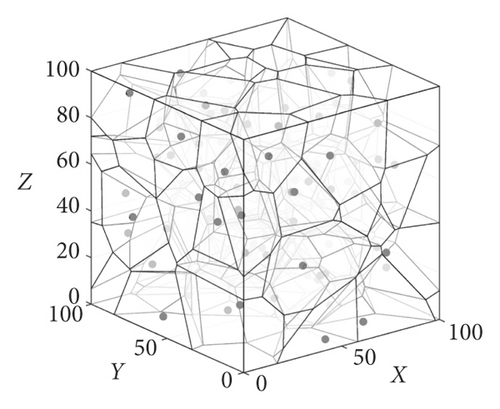
It can be concluded from the aforementioned results that the 2D-Voronoi diagram is a continuous polygon composed of a set of vertical bisectors connecting the straight lines of two neighbouring points, and the set of continuous polygons is seamless and unique. Therefore, each of the division units constituting the 3D-Voronoi diagram is changed from a polygon of a 2D plane to a collection of 3D polyhedra Vi{V1, V2, ⋯, Vn}. As shown in Figure 5(a), we divide the 3D 100 m3 cube space. It can be seen that the cube surface is composed of many irregular polygons similar to 2D planes. Furthermore, the size of the partition density is determined by the value of the node. Further internal division can yield a 3D-Voronoi division shape as shown in Figure 5(b). The small black dots in the figure represent nodes si, and each polyhedron having a different shape indicates that the cube is divided into Voronoi polyhedral units of different sizes. In addition, it can be seen that each V-body unit contains only one node (e.g., black dots as shown in Figure 5(b)). Thus, the number of nodes si is the same as the number of V-body units after division, i.e., . As shown in Figure 5(c), increasing the number of nodes can result in more V-body units with smaller volumes, making the divided V-bodies denser. Second, according to the definition of Voronoi partition, the Einstein distance from node si in the interior of the V-body to an arbitrary point in V-body is shorter than the distance from the node si to a neighbour node or other nodes. Therefore, this paper first uses this important property to divide and study the coverage problem of 3D space.
4. Algorithm Design and Steps
In this paper, we mainly study the coverage detection problem of target events in 3D space. Initially, the sensor nodes are randomly deployed, but there may be uncertainties in the target point events. Hence, we first assume that the position information of the target points is known and the position coordinates are determined experimentally. Second, the nodes can also know their location information after random deployment. Furthermore, the nodes have the same sensing radius and communication radius, i.e., the nodes in the WSN are isomorphic. Initially, the nodes can be separated into independent and unique V-body units by means of 3D-Voronoi partitioning after random deployment. However, this paper does not use the Voronoi method to divide the target event; instead, it uses the 3D-Voronoi method to divide the sensor nodes. According to the Voronoi property, we first consider the coverage problem of the sensor node in the V-body unit. For target points that are not in the range of node perception, we need to design related algorithms to implement mobile node coverage.
4.1. Definition of Virtual Force
- (i)
How to use the 3D-Voronoi partitioning method to divide the nodes and redeploy them to accurately cover the target point events
- (ii)
How to define the virtual force generated between the nodes and the mutual attraction, repulsive force, and obstacle repulsive force between the various forces
- (iii)
How to use the improved algorithm to move redundant nodes to cover missing target points in order to improve the coverage ratio
To further improve the coverage ratio and accuracy of the algorithm, we consider how to avoid node energy consumption or node death due to excessive invalid movement. We will describe the algorithm design in detail in the following section.
4.2. Virtual Force Analysis
4.2.1. Interaction between Nodes
4.2.2. Gravitational Force of the Target Event on the Node
4.2.3. Repulsive Force between Boundary Obstacles and Nodes
4.3. 3D-VPCA Algorithm
-
Step 1. n sensor nodes are randomly deployed in the area L to be monitored, and each node first determines the location of each location coordinates and the location information with the neighbour nodes.
-
Step 2. The 3D-Voronoi method is used to divide the area where the sensor nodes are located, so that each node is in its own V-body unit.
-
Step 3. To solve the problem of missing the target coverage caused by the traditional virtual force algorithm, the proposed algorithm is divided into three cases. Case 1: The target point is within the coverage of the node. Case 2: There are multiple target points in the V-body, but some of the target points are not within the coverage of the node. Case 3: There may be a situation where the target point is located on the boundary of two neighbour V-bodies.
-
Step 4. It is judged whether the target event is covered at this time according to the distance relationship of the covered target point to the node. If the number of target points covered is , execute step 5; otherwise, execute step 6.
-
Step 5. Keep the current number of nodes sk (i.e., k is the number of nodes that cover the target event). Thereafter, the idle node sf (i.e., sf = si − sk) is preferentially selected for movement.
-
Step 6. The idle node sf(sf = si − sk) at this time is checked, and the number of remaining target points (i.e., ) is calculated, where is the total number of target points.
-
Step 7. It is judged whether there are two neighbour boundary nodes, the node of the V-body to which the target point belongs is preferentially moved, and the idle neighbour nodes on both sides of the neighbour boundary.
-
Step 8. Mobile coverage optimization is performed by the 3D-VPCA algorithm (Algorithm 1), and the idle node sf is moved to cover the remaining target point cj by the virtual force resultant FA of the algorithm.
-
Step 9. Repeat step 4–8 until all nodes move to reach the optimal position and complete the final coverage.
-
Algorithm 1: 3D-Voronoi partition coverage algorithm (3D-VPCA).
-
The pseudo code of the 3D-VPCA algorithm is given as follow:
- (1)
si: The area of the sensor nodes
- (2)
oi: The area of the target nodes
- (3)
Input: The total number of sensor nodes n and the perceived radius of the nodes Rs
- (4)
Output: Location coordinates and network coverage S(A)
- (5)
Initialization: Divide the three-dimensional Voronoi ‘V-body’ unit vi
- (6)
Num = n
- (7)
maxiter = 100 Set the maximum number of iterations
- (8)
max_step = 0∼10 Set the maximum moving step size of the node
- (9)
A = x ∗ rand(n,1) ± xmax
- (10)
B = y ∗ rand(n,1) ± ymax
- (11)
C = z ∗ rand(n,1) ± zmax
- (12)
Si (X, Y, Z) = (A,B,C) Randomly generated n nodes in the area
- (13)
Dividing ‘V-bodies’ ∈vi, vi = (v1, v2, ⋯, vn)
- (14)
whilei ≤ Numdo
- (15)
ifdij ≤ Rsthen
- (16)
save the current nodes sk and ‘V-body’ unit vk
- (17)
else
- (18)
select the free nodes as coverage si
- (19)
ifdij > RS&&then
- (20)
calculate the total virtual force
- (21)
move
- (22)
else
- (23)
move sf⟶ boundary nodes sL
- (24)
end if
- (25)
end if
- (26)
end if
5. Theoretical Analysis of the Algorithm
5.1. Coverage Rate Analysis
5.2. Energy Consumption Analysis
The total node movement distance under the action of the algorithm is smaller than the total node movement distance under the 3D-VPCA algorithm, i.e., . Therefore, E − E′ < 0 can be derived, i.e., E < E′. Finally, the energy analysis presented above shows that the 3D-VPCA algorithm can effectively reduce the overall mobile energy consumption of the nodes in the network.
6. Experiment Simulation and Results
6.1. Simulation Environment and Parameter Settings
This study used MATLAB (2015b) software for the simulation experiments. To verify the algorithm as well as the simulation results and performance, the 3D-VPCA algorithm was compared with other two algorithms. Initially, we randomly deployed the sensor nodes in a 100 m3 cube monitoring space, in which the detection experiments were performed on the target points for the deployment. To improve the reliability of the experiments, we initially chose to deploy 50 nodes. According to [30], when the node deployment is low, the optimal distance of the node is selected to be Rc = 2Rs in order to ensure the connectivity of the network. We assumed that the target event can be covered by the node, but we considered the possibility of poor network connectivity. Hence, we set up 25 target points to ensure higher coverage while ensuring better network connectivity. Similarly, when the number of nodes was increased to 100, we used the network connectivity optimal distance given by when there were many nodes [30]. Therefore, we chose to deploy 58 target points, i.e., . The simulation parameters used in the experiment are listed in Table 1.
| Parameter name | Parameter value |
|---|---|
| Simulation area size L | 100 m3 |
| Total number of targets Noi | 25/58 |
| Number of nodes n | 50/100 |
| Sensing radius Rs | 0∼70 |
|
30 J |
| rmin | Rs × (5%∼10%) |
| α | 0.5 |
| β | 0.5 |
6.2. Experimental Results and Simulation Diagram
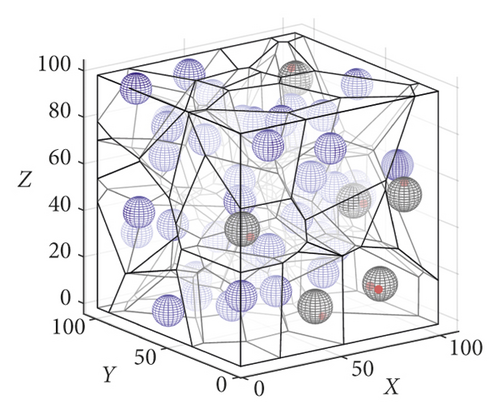
First, we performed the following two sets of simulation experiments, as shown in Figures 6 and 7. As shown in Figure 6(a), the blue sphere represents the sensing range of the sensor node. In the first set of experiments shown in Figure 6(a), 50 sensor nodes were initially deployed in the space of the 100 m3. In the operation of the 3D-VPCA algorithm, the 3D-Voronoi partitioning method is first used to divide the space of 100 m3 size into 50 differently shaped and unique V-body units according to the number of nodes. Furthermore, each node si is located in the respective unit vi as shown in Figure 6(b). As shown in Figure 6(c), the red dot represents the target point event to be covered; the blue sphere represents the node that the algorithm moves to adjust to cover the target point. The black sphere represents the sensor node whose target point is not within the sensing range of the node, and it is moved and adjusted to achieve coverage under the action of the algorithm. The following conclusions were drawn from the first set of experiments. When the position coordinates of 25 target points are known, the node coverage to the target point is first preserved under the adjustment of the algorithm. When the target point is not within the coverage of the node, the algorithm selects the node to move for adjustment.
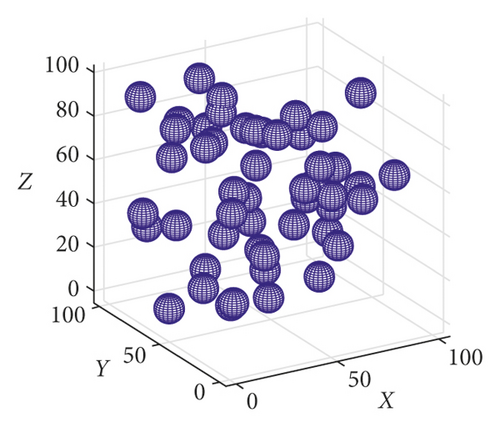
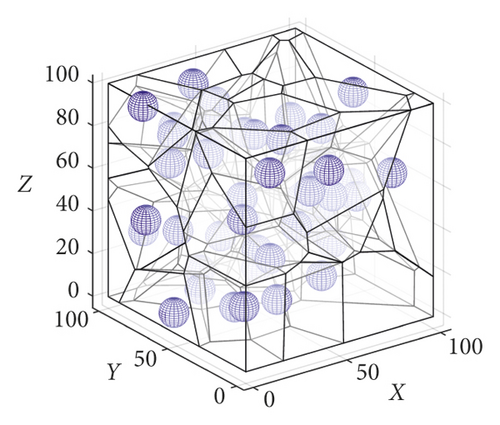
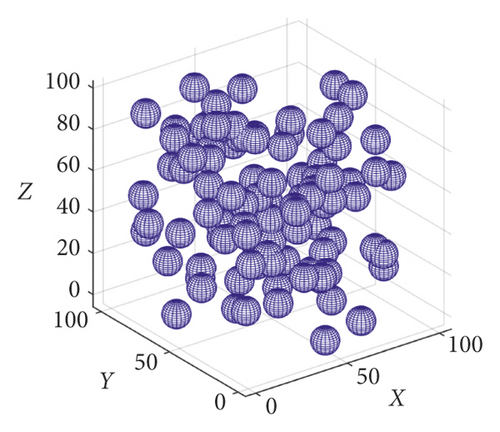
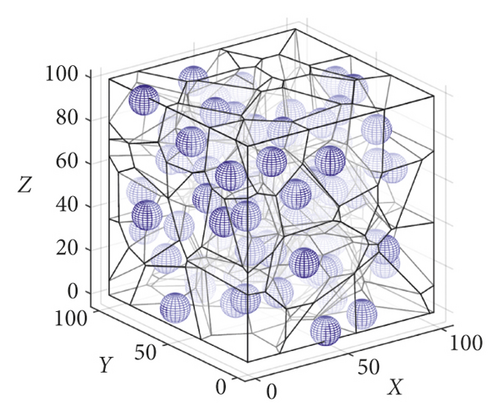
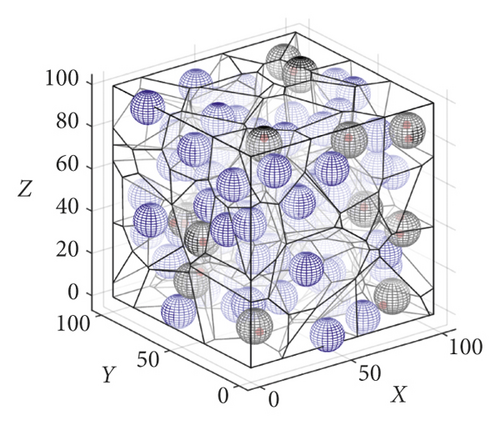
To further verify the adaptability of the algorithm, we performed the second set of experiments as shown in Figure 7. As shown in Figure 7(a), when we increased the number of sensor nodes to 100, we also selected the number of target points to be 58. It can be seen from Figure 7(a) that the sensor nodes are more evenly distributed and dispersed in the space when the number of nodes increases. As shown in Figure 7(b), the number of V-body units divided by the algorithm gradually increases with the number of nodes, and the volume of the V-body units gradually decreases. Hence, the probability that the target point is covered by the node increases according to the Voronoi partitioning property. As shown in Figure 7(c), the number of nodes that need to move increases with the number of target points and nodes.
6.3. Algorithm Analysis and Contrast Experiment
To further verify the accuracy of the experiment, we compared the 3D-VPCA algorithm in this paper with the cuckoo search algorithm (CSA) [34] and the random algorithm (Random Algorithm). Initially, we deployed the nodes in a cube space of size 100 m3 meters. In the experiment groups 3 and 4, we set the number of target points as 40 and 100 for comparison and then verified the coverage ratio change relationship of the three algorithms under different numbers of nodes by changing the number of sensor nodes. As shown in Figure 8, the number of target points to be monitored was set to 40. The coverage ratio of the three algorithms was compared by verifying the number of different nodes. It can be seen from Figure 8 that the CSA algorithm has a higher coverage ratio than the RA algorithm under the same target number and the same number of nodes. Hence, the coverage ratio of the 3D-VPCA algorithm is significantly better than that of the RA algorithm under the same conditions. When the number of nodes is between 10 and 15, the coverage ratio of the 3D-VPCA algorithm is not as high as that of the CSA algorithm. However, the coverage ratio of the 3D-VPCA algorithm in this paper is significantly improved and full coverage (i.e., the coverage rate is 1) is achieved first under the condition that the number of nodes is greater than 20. Hence, it is concluded from Experiment 3 that the algorithm is more suitable under a large number of nodes, and it can achieve a higher coverage ratio.
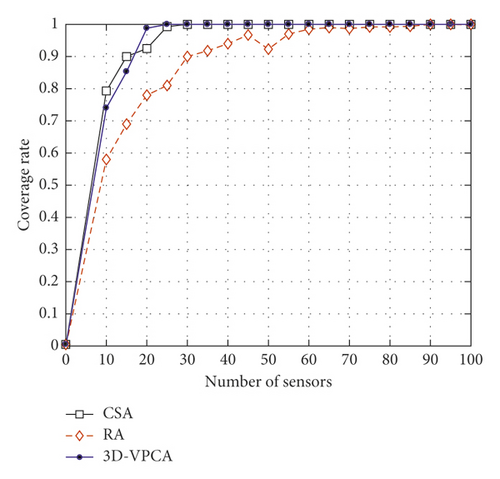
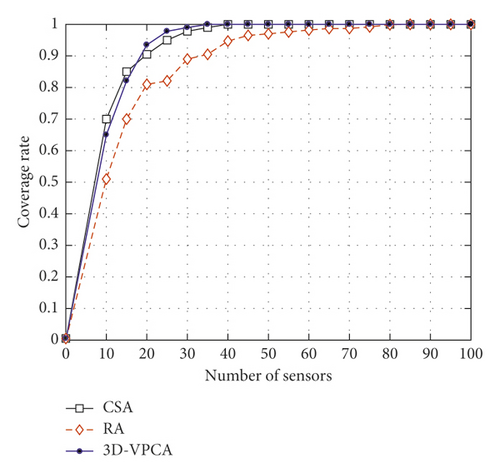
In Experiment 4, we increased the number of target points to 100, as shown in Figure 9. Experiment 4 mainly verifies the change in the coverage ratio of the 3D-VPCA, CSA, and RA algorithms when taking different numbers of nodes. When the number of sensor nodes is small and the number of target events is large (as shown in Figures 8 and 9, when the number of sensor nodes is in the range of 0–10), the coverage rate of the three algorithms under the same conditions is significantly lower than that in Experiment 3. Thus, it can be seen that the proposed algorithm has obvious advantages over the RA algorithm under the same conditions. When the number of sensor nodes is less than 20, the coverage ratio of the CSA algorithm is better than the coverage ratio of the proposed algorithm. However, when the number of nodes increases, the 3D-VPCA algorithm is significantly improved and superior to the CSA and RA algorithms. Therefore, it is further illustrated by Experiment 3 and Experiment 4 that the 3D-VPCA algorithm is advantageous under a large number of nodes.
To verify the changes in the various indicators of the three algorithms when changing the target number, we compare the results shown in Tables 2 and 3. In Table 2, we set the number of nodes to 30. In Table 3, we set the number of nodes to 35. Among them, Min and Max represent the minimum and maximum target points covered by the nodes under the same conditions. Furthermore, Avg (%) represents the average ratio of the three algorithms under the same conditions. Finally, we compare the various indicators of the three algorithms.
| Number of targets | RA | CSA | 3D-VPCA | ||||||
|---|---|---|---|---|---|---|---|---|---|
| Min | Avg (%) | Max | Min | Avg (%) | Max | Min | Avg (%) | Max | |
| 10 | 4 | 87.33 | 10 | 10 | 100 | 10 | 10 | 100 | 10 |
| 20 | 15 | 87.33 | 20 | 20 | 100 | 20 | 20 | 100 | 20 |
| 30 | 23 | 86.66 | 30 | 30 | 100 | 30 | 30 | 100 | 30 |
| 40 | 28 | 88.25 | 39 | 39 | 99.91 | 40 | 40 | 100 | 40 |
| 50 | 39 | 88.13 | 48 | 49 | 99.33 | 50 | 50 | 100 | 50 |
| 60 | 47 | 88.39 | 59 | 57 | 98.61 | 60 | 58 | 99.72 | 60 |
| 70 | 52 | 86.90 | 69 | 66 | 97.28 | 70 | 67 | 97.53 | 70 |
| 80 | 64 | 88.17 | 75 | 76 | 97.50 | 80 | 76 | 97.50 | 80 |
| 90 | 73 | 88.15 | 87 | 85 | 96.96 | 90 | 85 | 96.96 | 90 |
| 100 | 75 | 89.10 | 98 | 95 | 97.40 | 100 | 96 | 97.49 | 100 |
| Number of targets | RA | CSA | 3D-VPCA | ||||||
|---|---|---|---|---|---|---|---|---|---|
| Min | Avg (%) | Max | Min | Avg (%) | Max | Min | Avg (%) | Max | |
| 10 | 7 | 89.33 | 10 | 10 | 100 | 10 | 10 | 100 | 10 |
| 20 | 16 | 91.83 | 20 | 20 | 100 | 20 | 20 | 100 | 20 |
| 30 | 23 | 91.22 | 30 | 30 | 100 | 30 | 30 | 100 | 30 |
| 40 | 34 | 93.75 | 40 | 40 | 100 | 40 | 40 | 100 | 40 |
| 50 | 39 | 91.87 | 49 | 50 | 100 | 50 | 50 | 100 | 50 |
| 60 | 45 | 88.94 | 59 | 59 | 99.94 | 60 | 60 | 100 | 60 |
| 70 | 61 | 93.28 | 69 | 66 | 99.90 | 70 | 70 | 100 | 70 |
| 80 | 68 | 90.87 | 80 | 76 | 99.37 | 80 | 78 | 99.48 | 80 |
| 90 | 75 | 92.41 | 88 | 87 | 99.25 | 90 | 89 | 99.41 | 90 |
| 100 | 81 | 91.90 | 99 | 98 | 99.43 | 100 | 99 | 99.53 | 100 |
It can be seen from Tables 2 and 3 that the Min, Max, and Avg (%) indicators of the 3D-VPCA algorithm are significantly higher than those of the other two algorithms under the same number of target points. Furthermore, it is concluded from the above tables that the RA algorithm does not reach full coverage under any conditions, but the overall network coverage ratio of the 3D-VPCA algorithm is significantly improved. Therefore, the proposed algorithm can also achieve better detection for multiple target points under the same number of nodes.
In the fifth set of experiments, we again verified the relationship between the node sensing range and network coverage ratio. In this experiment, the network coverage ratio of the three algorithms was compared by changing the nodeʼs sensing range under different node numbers and target points, as shown in Figures 10–12.
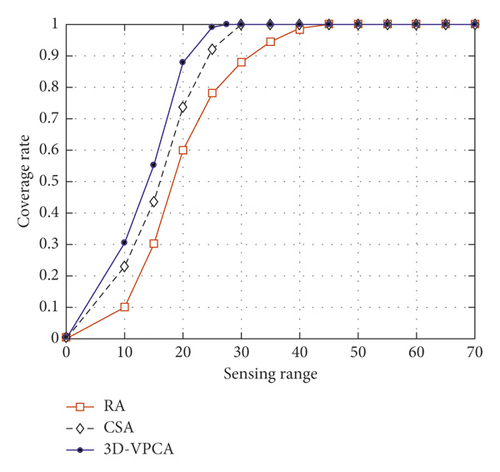
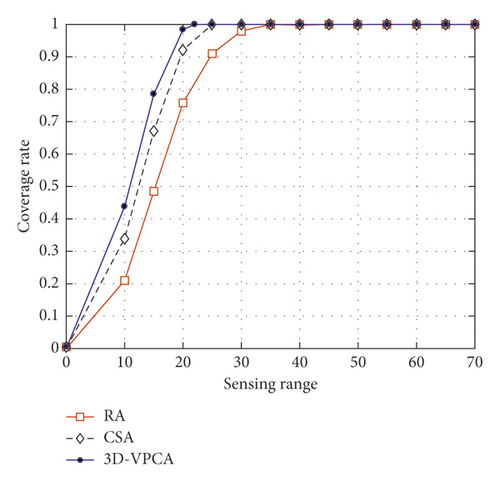
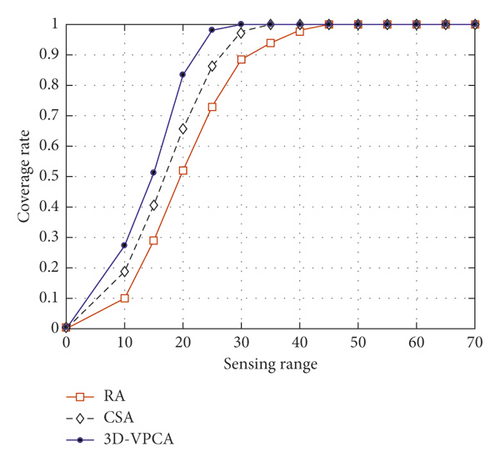
In the three experimental comparisons in this section, we verified the relationship between changing the sensing radius of the sensor nodes and determining the network coverage ratio of the deployment target point, as shown in Figures 10–12. As can be seen from the above figures, the sensing range of the node is mainly between 10 and 70. In the first section of the experiment, we set the number of nodes and the number of targets to 15 and 40 for, respectively, verification. The experimental results are shown in Figure 10. In the second experiment, we set the number of nodes and the number of targets to 60 and 100, respectively, for comparative analysis. The experimental results are shown in Figure 11. In the last experiment, we set the number of sensor nodes and target points to 10 and 100, respectively. The experimental results are shown in Figure 12. It can be concluded from the three experiments that as the node sensing radius increases, the coverage ratio of the three algorithms increases significantly. The blue line (e.g., Figure 10) represents the coverage ratio change of the 3D-VPCA algorithm. It can be seen that the coverage ratio is greater than that of the RA and CSA algorithms. Furthermore, it is concluded from Figure 10 that when the sensing range of the node is 27, the 3D-VPCA algorithm achieves full coverage faster than the other two algorithms. In the second part of Experiment 7 (e.g., Figure 11), when the number of nodes and the number of target points are increased, the coverage ratio of the three algorithms is increased compared with the coverage ratio of the three algorithms in the first part of experiment. On the contrary, the 3D-VPCA algorithm has the fastest growth ratio and is the first to achieve full coverage under the same conditions. As shown in Figure 11, when the sensing range is 22, the coverage ratio of the 3D-VPCA algorithm reaches 1 first and the coverage growth is superior to that of the other two algorithms. In the last part of the experiment (e.g., Figure 12), when the number of nodes is small and the number of target points is large, the coverage ratio growth of the three algorithms is significantly smaller than that of the previous two experiments.
- (i)
When the number of sensor nodes and target points is determined, the coverage ratio of the three algorithms under the same conditions increases and decreases with the sensing radius of the node.
- (ii)
Under the same conditions, when the node sensing radius is 25–30, the coverage ratio of the 3D-VPCA algorithm can reach more than 90%. When the node sensing radius is 30, the 3D-VPCA algorithm can achieve complete coverage.
- (iii)
The coverage ratio of the 3D-VPCA algorithm proposed in this paper is better than that of the CSA and RA algorithms under the same conditions.
7. Conclusion and Future Research
In this paper, we studied the coverage of target events in WSNs. For the requirements of random coverage of nodes in a 3D environment and node deployment under some special circumstances in a real environment, we proposed a 3D-VPCA algorithm and applied it to target coverage optimization in 3D WSNs. First, we constructed a network model and introduced a three-dimensional Voronoi partitioning method to construct ‘V-body’ units to improve the network coverage ratio and node utilization. Second, related algorithms were proposed for theoretical analysis and verification. Finally, the 3D-VPCA algorithm and two other algorithms were analysed and compared through numerous experiments. The results showed that the 3D-VPCA algorithm can significantly reduce the network energy consumption and achieve a higher coverage ratio. In the future, we will further study some key issues in WSNs, such as the mobility of target events and related algorithms. In addition, we will conduct relevant tests in an actual environment.
Conflicts of Interest
The authors declare that there are no conflicts of interest regarding the publication of this paper.
Acknowledgments
This work was supported by the National Natural Science Foundation of China (61762079 and 61662070) and Key Science and Technology Development Program of Gansu Province (1604FKCA097 and 17YF1GA015).
Open Research
Data Availability
The data used to support the findings of this study are available from the corresponding author upon request.


