Volume 2019, Issue 1 7513261
Research Article
Open Access

Online Modal Identification of Concrete Dams Using the Subspace Tracking-Based Method

Lin Cheng

Lin Cheng

State Key Laboratory of Eco-Hydraulics in Northwest Arid Region of China, Xi’an University of Technology, Xi’an 710048, China xaut.edu.cn

Search for more papers by this author
Fei Tong

Corresponding Author

Fei Tong

State Key Laboratory of Eco-Hydraulics in Northwest Arid Region of China, Xi’an University of Technology, Xi’an 710048, China xaut.edu.cn

Search for more papers by this author
Jie Yang

Jie Yang

State Key Laboratory of Eco-Hydraulics in Northwest Arid Region of China, Xi’an University of Technology, Xi’an 710048, China xaut.edu.cn

Search for more papers by this author
Dongjian Zheng

Dongjian Zheng

State Key Laboratory of Hydrology-Water Resources and Hydraulic Engineering, Hohai University, Nanjing 210098, China hhu.edu.cn

Search for more papers by this author
First published: 2019
Citations: 12
Guest Editor: Filipe Magalhaes

Abstract

To investigate the time-varying dynamic characteristics of concrete dams under the excitation of large earthquakes for online structural health monitoring and damage evaluation, an online modal identification procedure based on strong-motion records is proposed. The online modal identification of concrete dams is expressed as a subspace tracking problem, and a newly developed recursive stochastic subspace identification (RSSI) method based on the generalized yet another subspace tracker (GYAST) algorithm, which exploits both the accuracy of the subspace identification and fast computational capability, is used to extract the time-varying modal parameters of concrete dams during earthquakes. With the simulated vibration response records, a numerical example is used to verify the accuracy, robustness, and efficiency of the proposed GYAST-based, time-varying modal identification method. Then, the realistic strong-motion records of the Pacoima arch dam are analysed using the proposed modal identification procedure, and the time-varying characteristics of the concrete arch dam during three different earthquakes are analysed.

1. Introduction

The modal parameters of concrete dams, including the natural frequencies, damping ratios, and modal shape vectors, extracted from earthquake response records can be used for structural antiearthquake capacity analysis, health monitoring, and postearthquake structural damage evaluation. These parameters have obvious physical meanings and represent the practical dynamic characteristics of structures. Some researchers have made efforts to address the modal identification problem of concrete dams based on earthquake response records [16]. However, the modal identification methods adopted in the past studies are restricted to linear systems and stationary processes, and using such methods would require the assumption that the dam-reservoir-foundation system is linear and time invariant for the duration of a vibration measurement. The dam-reservoir-foundation system under the excitation of large earthquakes may present some time-varying characteristics, resulting from the time-varying character of the material parameters, boundary conditions, dam-reservoir-foundation interactions, and structural damage [7]. Using the offline modal identification procedure to extract the constant modal parameters cannot track the time-varying dynamic properties of a structure during a large earthquake, which may be important information for online structural health monitoring. Therefore, the online modal identification method of concrete dams is an important research topic.

The structural online modal identification problem is a research topic with many challenges that still attract significant attention for its significance in aerospace engineering [8], mechanical engineering [9], and civil engineering [10], among other fields. For time-varying structures, the assumption of the classic modal identification methods that the structure is a time-invariant system is no longer applicable. Thus, Liu [11] proposed the concept of “pseudomodal parameters,” which use the time-freezing concept. Three types of methods have been developed for time-varying modal identification, i.e., the time series model method and the recursive stochastic subspace identification (RSSI) method in the time domain and the time-frequency decomposition method in the time-frequency domain [12, 13]. For the time series model method, Gong [14] used adaptive forgetting through multiple models (AFMM) to track the time-varying modal parameters of tall buildings during a large earthquake and evaluated the structural health according to the modal identification results. Poulimenos and Fassois [15] performed an important literature review of different time-varying modal identification methods using different nonstationary time series models and point out their pros and cons. Klepka and Uhl [16] used the time-frequency domain decomposition technique to analyse the structural vibration response and identified the modal parameters. Goethals et al. [17] and Nezam Sarmadi and Venkatasubramanian [18] used the projection approximation subspace tracking (PAST) algorithm-based RSSI (PAST-RSSI), and Loh et al. [19, 20] used the extended instrumental variable version of the PAST algorithm-based RSSI (EIV-PAST-RSSI) to carry out the online modal identification of a power system, an in-flight flutter, a tall building, and a television tower. Among these methods, the RSSI method has attracted the most attention. The advantage of the RSSI method is mainly reflected in its strong numerical stability and strong robustness to noise interference. Therefore, it is suitable for the online modal identification of structures under random vibration excitation such as earthquakes. Although the online modal identification problem has been studied in many other fields, very few research works have been reported that use the online modal identification for concrete dams [21]. The dam-reservoir-foundation system is characterized by its large size, large number of degrees of freedom, and closely spaced modes, and the vibration measurement of concrete dams is usually performed with a low signal-to-noise-ratio (SNR) as a result of external disturbances. This brings great difficulties to the online modal identification of concrete dams.

In this work, the RSSI method is used to extract the modal parameters of concrete dams based on the strong-motion records of the structure. The online version eigenvalue decomposition (EVD) is solved as a subspace tracking problem using the generalized yet another subspace tracker (GYAST) algorithm [22]. GYAST is a newly proposed advanced algorithm which makes several robust modifications of the original subspace tracking algorithm. The YAST algorithm relies on an interesting idea of optimally extracting the updated subspace weighting matrix in each step. In the GYAST algorithm, computation reduction of optimal subspace extraction is achieved by an approximation. It caused the GYAST has the advantages of a low computational complexity, high computational efficiency, and strong robustness. Combining GYAST with RSSI is expected to improve the accuracy and efficiency of the online modal identification. The online time-varying modal identification procedure based on the GYAST-RSSI is verified using a numerical example to evaluate the algorithm identification accuracy, robustness, and computation efficiency. Finally, the time-varying modal identification of the Pacoima arch dam is carried out using the proposed time-varying modal identification procedure and the strong-motion records of three different earthquakes to track the time-varying characteristics of the arch dam during earthquakes.

2. Linear Time-Varying Modal Identification Using the GYAST-Based RSSI

2.1. Time-Varying State Space Expression of the Dam-Reservoir-Foundation System

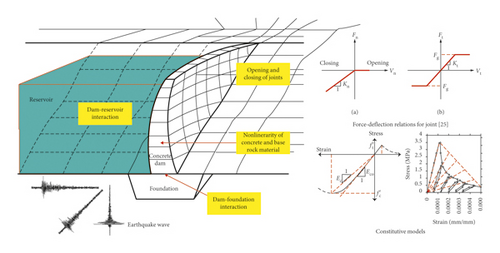
In the design stage of a concrete dam, the structure is generally assumed to be linear, and the observed vibration response of the structure is stationary. However, for some reasons, the dam-reservoir-foundation system may be time-varying. As shown in Figure 1, the dynamic constitutive model of the concrete and the base rock may be nonlinear. Additionally, the joints on the dam body may close or open with variations in the amplitude of the earthquake excitation, which will change the stiffness of the connections between different dam monoliths. The effects of the structure-foundation interaction may also introduce some time-varying factors into the dynamic features of concrete dams [23]. Moreover, a damage structure normally exhibits nonlinear dynamic behaviours and a time-dependent stiffness, and the damping variations over time lead to the time-varying modal parameters of the system. In this study, the dam-reservoir-foundation system is assumed to be a linear time-varying system. The “frozen-time” assumption that consists of modelling a linear time-varying system as a piecewise linear time-invariant system is adopted. The parameters will be assumed to vary in a stepwise way; i.e., they will change abruptly at instants separated by small time intervals and will remain constant during these time intervals. If the time intervals are sufficiently small, this model can be considered an approximation of the continuously varying case [24]. The expression of this system will be discussed in this section.
Details are in the caption following the image
Time-varying characteristics of the dam-reservoir-foundation system under earthquake excitation: (a) normal opening; (b) tangential movement [25].

It should be noted that the material characteristics, the boundary conditions, the damping, etc. may be affected by some environmental variables, such as the water level, temperature, and humidity. The impact of these variables will not be taken into account in this study since the observation time of an earthquake response record is not very long.

The equation of motion for an n degrees-of-freedom time-varying linear system S with time-varying structural parameters can be expressed as
S : M t x ¨ t + C t x ˙ t + K t x t = f t , (1)
where M[t], C[t], and K[t] are the time relevant mass matrix, damping matrix, and stiffness matrix, respectively. M[t], C[t], and K[t] are assumed to slowly change with time. For the dam-reservoir-foundation system, the change of mass is usually not taken into account, and thus, the mass matrix M[t] = M is constant. X[t] is the displacement response of the structure, and f[t] is the external excitation force.
Equation (1) is a system of differential equations with time-varying coefficients. The response can be found by solving the differential equations using initial conditions, but in general, there is no closed-form solution set to these equations. Thus, an approximation is introduced to solve the vibration problem. In other words, the instantaneous modal parameters are obtained at each time instant under the slow-varying assumption of the structural system. According to this assumption, the continuous “frozen” time-varying structure is made up of the mass, damping, and stiffness of every instantaneous moment τ ∈ [0, tend], which can be expressed as follows:
S = S τ : M τ x ¨ t + C τ x ˙ t + K τ x t = f t , τ = t k , k = 1,2 , , N , t 0 , t end , (2)
where tend is the end time of the time series of the vibration response signal, S(τ) represents the time-invariant structure of t = τ, and S is a set of the time-freezing descriptions of the linear time-varying structure. Analytically, during the time interval [tk, tk+1), the parameter matrices of equation (2) have entries with constant values. When t = tk+1, the matrices may suddenly change from M[tk], C[tk], and K[tk] to M[tk+1], C[tk+1], and K[tk+1] since the system during the time interval [tk, tk+1) is time invariant. The state space expression for the time-varying system at discrete time intervals is as follows [26]:
z k + 1 = A k z k + u k , y k = G k z k + v k , (3)
where Ak and Gk are the discrete state space matrix and observation matrix of the time interval [tk, tk+1), respectively. zk is a vector of state variables, and the observation vector yk is a vector of l channels and can be any or some of the three types of structural vibration responses, i.e., the displacement, velocity, and acceleration. uk is the stochastic excitation, and vk is the observational noise.

The expression of the structural vibration response for a time-varying system during a time instant t ∈ [tk, tk+1) is discussed first. Since the system during the interval [tk, tk+1) is assumed to be time invariant, a basic expression for the linear vibration system is applicable during the time interval.

To identify the complex modal shape vector, the double-sized mixing model is adopted [27]. It is well known that the shift of the phase angle between the displacement and velocity and the velocity and acceleration is 90°. The acceleration response is generally measured for the structural strong-motion response observation system. Since the physical parameters vary slowly with time, component y0[t] is an asymptotic signal. To track the time-varying characteristics of a structure with n degrees-of-freedom, the Hilbert transformation is performed to obtain the pseudoresponse of the structure with a 90° transferred phase angle y90[t]. Then, in the discrete time domain, the augmented response vector y ˜ k 21 l × can be obtained as follows:
y ˜ k = y R k y I k = y 0 k y 90 k . (4)
Equation (4) is equivalent to the representation of the original signal in the analytical form y[t] as follows:
y t = y 0 t + j H y 0 t = y R t + j y I t , (5)
where yR[t] = y0[t] = y[t] and yI(t) = H{y0[t]} are the real and imaginary parts of the analytical signal, respectively, and j = 1 is the imaginary unit; H{⋅} is the mathematical operator of the Hilbert transformation.
Based on the derivation by McNeill [28] and Masuda et al. [29], the free acceleration vibration of a structure can be expressed as
x ¨ t = 2 Re Φ k q ¨ k , t , t t k , t k + 1 , (6)
where k represents the kth time interval, i.e., Φ(k) = Φ[tk]. The complex modal acceleration response matrix is defined as q ¨ k , t = q ¨ R k , t + j q ¨ I k , t and is composed of the modal acceleration responses of all the activated modes. The terms q ¨ R k , t and q ¨ I k , t are the real and imaginary parts of the modal acceleration response, respectively. Re{⋅} is the real part of a number.
If the acceleration response is measured and the output selection matrix is Ca, the analytical expression of the acceleration response signal is
y t = C a x ¨ R t + j x ¨ I t = C a Φ k q ¨ k , t , t t k , t k + 1 . (7)
Based on the coordinate transformation shown in equation (6), the augmented response vector y ˜ t shown in equation (4) is expressed as
y ˜ t = y R t y I t = L k q ¨ ˜ k , t + v t ,  t t k , t k + 1 , (8)
where L k = C a Φ k R C a Φ k I C a Φ k I C a Φ k R 22 l × n and q ¨ ˜ k , t = q ¨ R k , t q ¨ I k , t 21 n × .
Assume the observational noise components are independently identically distributed with a variance σ n 2 . Then, the covariance matrix of y ˜ t can be expressed as
R y ˜ y ˜ k , 0 = E y ˜ t y ˜ t H = L k R q ¨ ˜ q ¨ ˜ k , 0 L k H + σ n 2 I 2 p l , t t k , t k + 1 , (9)
where the superscript  H, denotes the conjugate transpose of a matrix and R q ¨ ˜ q ¨ ˜ k , 0 is the covariance matrix of the modal acceleration responses. For a structure system with weak damping,
R q ¨ ˜ q ¨ ˜ k , 0 R q ¨ R q ¨ R k 0 n 0 × n 0 0 n 0 × n 0 R q ¨ I q ¨ I k . (10)
After the discrete sampling of the physical acceleration of the l channels at N identical time intervals, a time-delayed vector Y(k) ∈ 2pl×1, which is composed of y ˜ k and its time-delayed data, can be written as follows:
Y k = y ˜ k T y ˜ k T y ˜ k + p 1 T T , k = 1,2 , , N , (11)
in which the number of time delays should satisfy 2pl > n.
Then, the Hankel matrix H0(k) ∈ 2pl×2pl can be defined as follows:
H 0 k = E Y k Y k T , = R y ˜ y ˜ k , 0 R y ˜ y ˜ k , 1 R y ˜ y ˜ k , p 1 R y ˜ y ˜ k , 1 R y ˜ y ˜ k , 2 R y ˜ y ˜ k , p R y ˜ y ˜ k , p 1 R y ˜ y ˜ k , p R y ˜ y ˜ k , 22 p . (12)
Based on the derivation of the free acceleration response shown in equation (9), the Hankel matrix H0(k) can be decomposed into the following form:
H 0 k = L k L k k L k k p 1 R q ¨ ˜ q ¨ ˜ k L k H k L k H k p 1 L k H + σ n 2 I 2 p l , = L ˜ k R q ¨ ˜ q ¨ ˜ k L ˜ k H + σ n 2 I 2 p l , (13)
where Σ(k) = exp{Λtk} ∈ n×n. Λ = diag(λ1, …, λn0), λ1, …, λn0 are the eigenvalues of the continuous system matrix.

For the free vibration response of a structure system without damping, the modal acceleration responses of the different modes are independent of each other. However, the damping effect and the disturbance of the noise result in the matrix R q ¨ ˜ q ¨ ˜ k being approximately a diagonal matrix. Since the damping of concrete structures is usually weak, the error caused by the approximation is acceptable.

At the time instant tk, new observational data y(k) are available, and the Hankel matrix H0(k) should be updated online. One way to update the Hankel matrix is called the exponential forgetting method. Using this matrix, the Hankel matrix H0(k) at the time t = tk is expressed as
H 0 k = β H 0 k 1 + Y k Y k T , (14)
in which β is the forgetting factor, with a suggested value between 0.995 and 0.999 [30].

2.2. Modal Subspace Tracking Using GYAST

For each time step, the EVD of H0(k) (where H0(k) is a square matrix) should be performed at each time instant as follows:
H 0 k = Q 1 k Q 2 k Δ 1 k 0 0 Δ 2 k Q 1 k T Q 2 k T , = Q 1 k Δ 1 k Q 1 k T + Q 2 k Δ 2 k Q 2 k T . (15)
If Q1(k) contains the first n dominant eigenvectors of H0(k), it can be taken as the dominant signal subspace, which represents the contributions of different modes. Δ1(k) is a diagonal matrix that is composed of the first n dominant eigenvalues of H0(k). Q2(k) and Δ2(k) correspond to the remaining eigenvectors and eigenvalues. However, the total computation time will then be very large and is not suitable for online applications. Thus, the online version of the EVD algorithm should be adopted. Since only the left part of the EVD is needed to retrieve an estimate of the observability matrix, an economical (so-called thin) EVD, which computes only that left part, can be used. Using the subspace tracking procedure, the GYAST, in each time step, a sufficient approximation of the dominant subspace, namely,
k k H Q 1 k Q 1 k H , (16)
can be obtained. It has been proven that, in a stationary situation, the desired steady-state weights Π(k) = Q1(k)H can be obtained by maximizing the mean square value of the output of the combiners, given by
J k = E trace q ¨ ˜ k H q ¨ ˜ k , = E trace k H Y k Y k H k , = trace k H Y k Y k H k , (17)
in which the operator trace (⋅) stands for the trace of a matrix.
To ensure the orthogonality of Π(k), a maximization optimization problem with constraints is expressed as follows:
max Π t : J k = trace k H H 0 k k , subject to: k H k = I n . (18)
To reduce the computational cost of updating Π(k) online, the ideal subspace projection- (SP-) type algorithm limits the search space to the range space of Π(k − 1) plus one additional search direction, i.e., Y(k). Then, the n-dimensional range space of Π(k) is found as a subspace of the (n + 1)-dimensional space spanned by V(k) ∈ 2pl×(n + 1):
V k = k 1 , Y k . (19)
If Π ¯ k is an orthonormal basis of the (n + 1)-dimensional range space V(k), then Π(k) can be expressed as
k = ¯ k U k , (20)
in which U(k) ∈ (n + 1)×n.
Then, replacing equation (20) with the optimization problem shown in equation (18), the following new optimization problem is obtained:
max U t : J U k = trace U k H R ¯ q ¨ ˜ q ¨ ˜ k U k , subject to: U k H U k = I n . (21)
in which the matrix R ¯ q ¨ ˜ q ¨ ˜ k = Π ¯ k H H 0 k Π ¯ k .
For the GYAST algorithm, an approximation is introduced that calculates the modal acceleration responses q ¨ ˜ k = q ¨ ˜ k , t k as
q ¨ ˜ k = k 1 H Y k . (22)
Then, the orthonormal basis Π ¯ k of the augmented (n + 1)-dimensional range space span(V(k)) is given by
¯ k = k 1 , u k , (23)
where u(k) is the unit-norm variant of Y(k), Y k = Y k Π k 1 q ¨ ˜ k = σ k u k is the complement of the orthonormal projection of Y(k), and σ k = Y k 2 = Y k H Y k q ¨ ˜ k H q ¨ ˜ k is the L2-norm of Y(k).
Define the matrix R ¯ q ¨ ˜ q ¨ ˜ k = Π ¯ k H H 0 k Π ¯ k . Based on equation (14) and equations (22) and (23), R ¯ q ¨ ˜ q ¨ ˜ k can be deduced as
R ¯ q ¨ ˜ q ¨ ˜ k = ¯ k H H 0 k ¯ k = R q ¨ ˜ q ¨ ˜ k r k r k H γ k , (24)
in which r k = σ k q ¨ ˜ k , γ(k) = βσn(k)2 + σ(k)2, and R q ¨ ˜ q ¨ ˜ k = β R q ¨ ˜ q ¨ ˜ k 1 + q ¨ ˜ k q ¨ ˜ k H .
For the subspace tracking algorithm, GYAST, to track the signal subspace of H0(k), four basic steps must be performed, which are (i) calculating the orthonormal basis Π ¯ k of the range space V(t), (ii) constructing the matrix R ¯ q ¨ ˜ q ¨ ˜ k , (iii) conducting the online updating of Π(k), and (iv) conducting the online updating of R q ¨ ˜ q ¨ ˜ k . Using equations (14) and (22)–(24) and the following equations (25a)–(25k), these calculations can be realized online in a recursive way, and Π(k) can be updated online for each time instant [23, 31]:
q n k = minor eigenvector of  R ¯ q ¨ ˜ q ¨ ˜ k = q r n k , (25a)
b k = 1 1 + r n k , (25b)
s k = r n k r n k σ k , (25c)
e k = k 1 b k q s k q ¨ ˜ k + s k Y k , (25d)
k = k 1 e k q H , (25e)
q k = R q ¨ ˜ q ¨ ˜ k q , (25f)
C 2 k = r n k r n k R k + b k q k q H , (25g)
c k = b k 2 q H q k + γ k + 2 b k r n k Re r n k q H r k , (25h)
R q ˜ ¨ q ˜ ¨ k = R q ¨ ˜ q ¨ ˜ k + c k q q H C 2 k C 2 k H , (25i)
λ m k = trace R ¯ q ¨ ˜ q ¨ ˜ k trace R q ˜ ¨ q ˜ ¨ k , (25j)
σ n k + 1 2 = min λ m k , σ n k 2 . (25k)

2.3. Flowchart of the Online Modal Identification Method Using the GYAST-RSSI

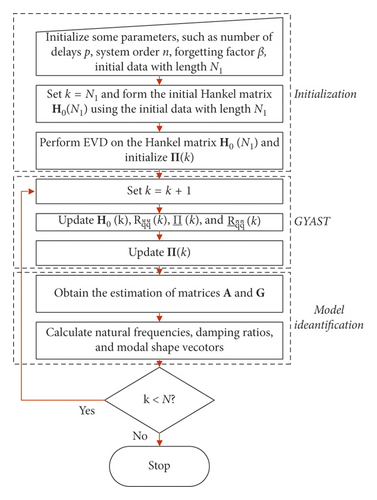
The proposed online modal identification procedure based on the GYAST-RSSI is shown in Figure 2. Some basic steps of this procedure are summarized as follows:
  • (1)

    Initialize some parameters of the procedure, such as the number of time delays p, the system order n, the forgetting factor β, and the initial data length N1. The system order n can be determined using the SVD spectrum method. The number of time delays should satisfy 2pl > n. The forgetting factor β is set within the range of [0.995–0.999]. Through some numerical experiments, the choice of N1 will have an effect on the calculation result of the initial Hankel matrix, but considering that GYAST is an iterative algorithm, the result of H(N1) only affects the results of the previous steps. Here, for convenience, set N1 = 100 and k = N1 and use the initial strong-motion records of l channels with data length N1 to calculate the initial Hankel matrix H0(k) as H 0 k = 1 / p ˜ k = 1 N 1 Y k Y k T .

  • (2)

    GYAST is a recursive subspace tracking algorithm, and it should first be initialized. Perform EVD on the Hankel matrix H0(k) and initialize the orthonormal matrix Π(t) as follows:

    k = Q 1 k , (26a)
    R q ˜ ¨ q ˜ ¨ k = Q 1 k T H 0 k Q 1 k , (26b)
    σ n k 2 = smallest eigenvalue of  H 0 k . (26c)

  • (3)

    Set k = k + 1 and update Π(k) using the GYAST algorithm to calculate the orthonormal basis Π ¯ k , H ¯ k , R q ˜ ¨ q ˜ ¨ k , etc., using equation (14) and equations (22)–(24).

  • (4)

    Since Π(k) ~ Οi,k, the two matrices have the same eigenvalues and eigenvectors, and so we set Οi,k = Π(k). From the above recursive procedures, the orthonormal matrix Π(k) can be updated. Then, at the kth time interval, the discrete state space matrix Ak and the observation matrix Gk are realized using the following expressions:

    G k = Ο i , k 12 : l ,: , A k = Ο ¯ i , k + Ο ¯ i , k , (27)
    where Ο ¯ i , k = O i , k 12 : l p 1 ,: and Ο ¯ i , k = O i , k 212 l + : l p ,: .

  • (5)

    After we obtain the modal identification results at time instant tk, some meaningless mathematical poles should first be discarded. If the identified natural frequencies fi,k and damping ratios ξi,k at time instant tk satisfy the following criteria, then mode i is deemed to be a real structural mode:

    f min < f i , k < f max , ξ min < ξ i , k < ξ max , (28)
    in which fmin and fmax are the minimum and maximum natural frequencies of the active modes of the structure and ξmin and ξmax are the minimum and maximum damping ratios.

  • (6)

    Continue with step 3∼step 5 of the above calculation procedure until reaching the end of the strong-motion records.
Details are in the caption following the image
Flowchart of the proposed online modal identification using the GYAST-RSSI method and strong-motion records.

3. Examples

3.1. Numerical Example

Using the mass-spring-damper system with 4 degrees-of-freedom shown in Figure 3, the time-varying modal identification method proposed in this work is validated for its identification accuracy, robustness, and computation efficiency. Some parameters of the system are set as follows: m1 = m2 = m3 = 1.0 kg, m4 = 0.9 kg, k3 = 7000 N/m, k2 = k4 = 8000 N/m, c1 = c2 = 0.6 N·s2/m, and c3 = c4 = 0.55 N·s2/m. The time-varying stiffness coefficients k1 are simulated as follows. The time intervals are in seconds.
  • Case 1: abrupt change of k1:

k 1 = 8000 , 04 t < , 6000 , 48 t < , 9000 , 812 t < , 7000 , 1216 t , unit : N / m . (29)
  • Case 2: continuous linear change of k1:

k 1 = 6000125 + t , unit : N / m . (30)
Details are in the caption following the image
Concentrated mass system with 4 degrees-of-freedom.

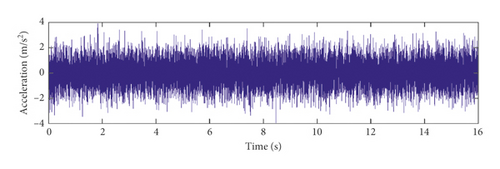
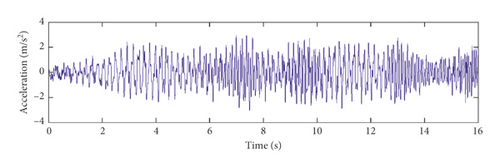
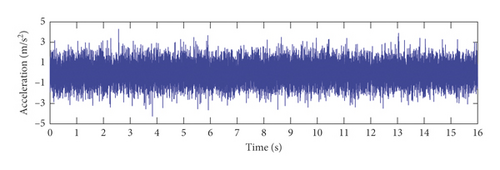
The initial state of the system is zero, and the support excitation ag(t) is simulated using a white noise signal. The structural vibration response is obtained by adding some white noise to the calculated responses using a Runge–Kutta algorithm (using MATLAB code ODE45). The sampling frequency of the simulated structural vibration response is 1000 Hz. Figures 4 and 5 show the support excitation and the acceleration response of m1 for two simulation cases of k1.
Details are in the caption following the image
Support excitation and vibration response of m1 (SNR = 40 dB) for simulation case 1: (a) support excitation ag(t); (b) acceleration response of m1.
Details are in the caption following the image
Support excitation and vibration response of m1 (SNR = 40 dB) for simulation case 1: (a) support excitation ag(t); (b) acceleration response of m1.
Details are in the caption following the image
Support excitation and acceleration response of m1 (SNR = 40 dB) for simulation case 2: (a) support excitation ag(t); (b) response of m1.
Details are in the caption following the image
Support excitation and acceleration response of m1 (SNR = 40 dB) for simulation case 2: (a) support excitation ag(t); (b) response of m1.

Setting β = 0.995, p = 50, and N1 = 100 and using the simulated structural vibration responses (SNR = 40 dB) of case 1 and case 2, the time-varying modal identification results for the frequencies and damping ratios are shown in Figures 6 and 7. The identification accuracy of the frequencies is sufficient, but the identification accuracy of the damping ratios needs to be further improved.

Details are in the caption following the image
Frequency (f1f4) and damping ratio (ξ1ξ4) identification results of simulation case 1 (SNR = 40 dB): identification results for (a) natural frequencies using GYAST-RSSI and (b) damping ratios using GYAST-RSSI.
Details are in the caption following the image
Frequency (f1f4) and damping ratio (ξ1ξ4) identification results of simulation case 1 (SNR = 40 dB): identification results for (a) natural frequencies using GYAST-RSSI and (b) damping ratios using GYAST-RSSI.
Details are in the caption following the image
Frequency (f1f4) and damping ratio (ξ1ξ4) identification results of simulation case 2 (SNR = 40 dB): identification results for (a) natural frequencies and (b) damping ratios.
Details are in the caption following the image
Frequency (f1f4) and damping ratio (ξ1ξ4) identification results of simulation case 2 (SNR = 40 dB): identification results for (a) natural frequencies and (b) damping ratios.

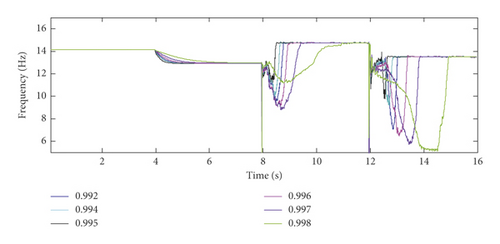
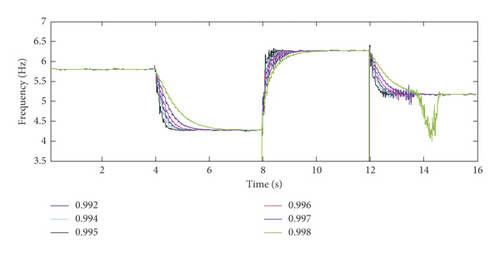
The forgetting factor is an important parameter in the GYAST-RSSI method proposed in this paper. To verify its influence on the recognition result, different values of β are selected for a parameter sensitivity analysis. Under simulation case 1, the analysis results are shown in Figure 8. It can be seen from Figure 8 that when β is in the interval of [0.995 0.999], the result does not change much. In this example, the result of β = 0.995 is better.
Details are in the caption following the image
Frequency (f1, f2) identification results of simulation case 1 under different forgetting factors (SNR = 40 dB): (a) mode 1; (b) mode 2.
Details are in the caption following the image
Frequency (f1, f2) identification results of simulation case 1 under different forgetting factors (SNR = 40 dB): (a) mode 1; (b) mode 2.

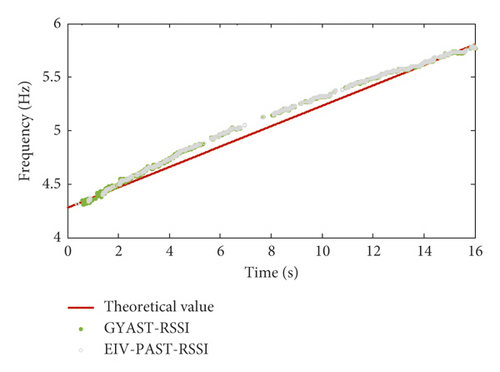
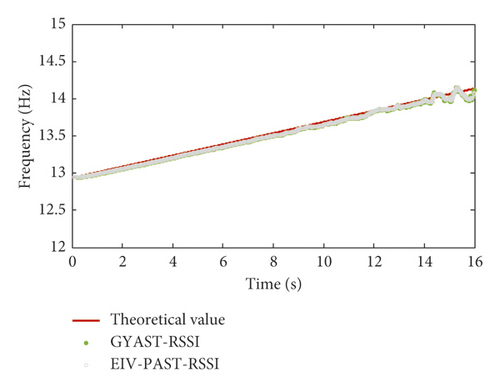
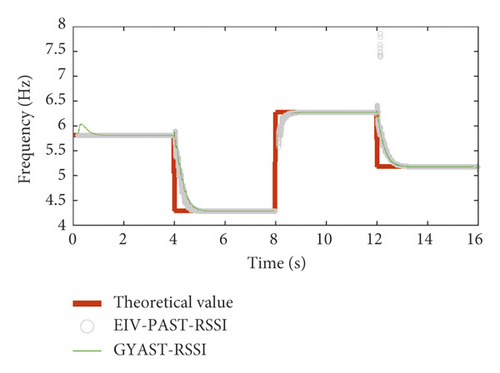
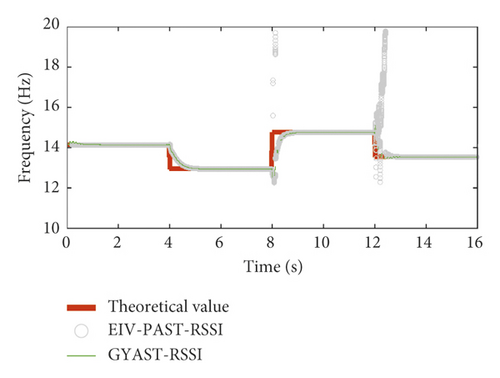
Based on the simulated vibration response (SNR = 40 dB), the identification results for frequencies f1 and f2 of mode 1 and mode 2 using the EIV-PAST-RSSI and GYAST-RSSI methods are plotted in Figures 9 and 10 to make a comparison. Figures 9 and 10 show that the difference between the identification results of the EIV-PAST-RSSI and GYAST-RSSI methods is small, but the identification results of GYAST-RSSI are more stable.
Details are in the caption following the image
Frequency identification results of the first two modes using the different methods for simulation case 1 (SNR = 40 dB): (a) mode 1; (b) mode 2.
Details are in the caption following the image
Frequency identification results of the first two modes using the different methods for simulation case 1 (SNR = 40 dB): (a) mode 1; (b) mode 2.
Details are in the caption following the image
Frequency identification results of the first two modes using different methods for simulation case 2 (SNR = 40 dB): (a) mode 1; (b) mode 2.
Details are in the caption following the image
Frequency identification results of the first two modes using different methods for simulation case 2 (SNR = 40 dB): (a) mode 1; (b) mode 2.

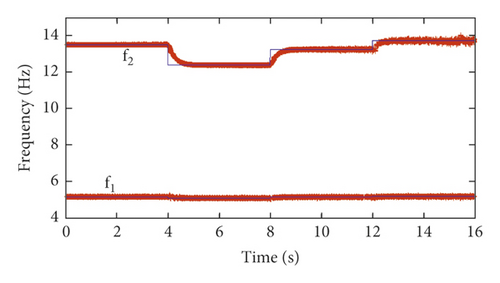
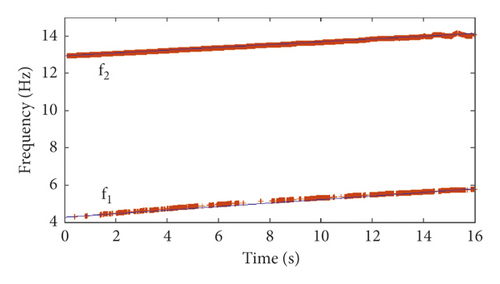
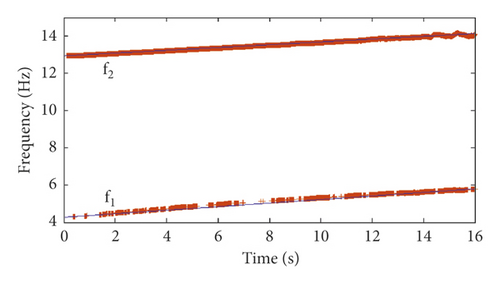
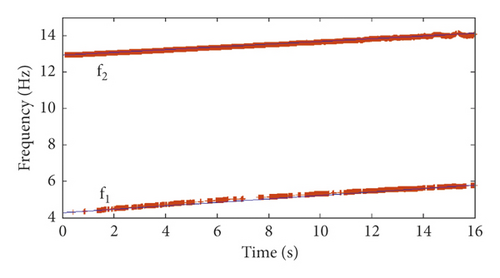
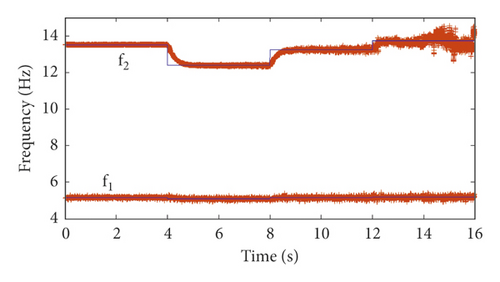
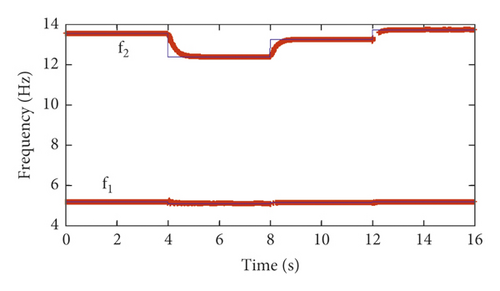
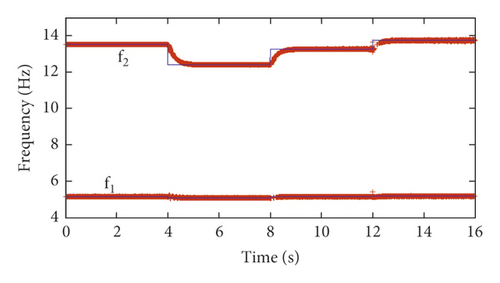
To verify the robustness of the proposed time-varying modal identification method, simulated vibration response signals with different SNRs are used to perform the time-varying modal identification. The modal identification results of the first two frequency orders f1 and f2 for simulation cases 1 and 2 are shown in Figures 11 and 12, respectively. Figures 11 and 12 show that, with the increase in the noise level (decrease in the SNR), the identification accuracy of the frequencies is still very high.
Details are in the caption following the image
Frequency identification results of the first two modes using vibration signals with different SNR values for simulation case 1 (blue line represents the theoretical value of the frequency, and red line represents the identified value of the frequency): (a) no noise; (b) SNR = 50 dB; (c) SNR = 40 dB; (d) SNR = 30 dB.
Details are in the caption following the image
Frequency identification results of the first two modes using vibration signals with different SNR values for simulation case 2 (blue line represents the theoretical value of the frequency, and red line represents the identified value of the frequency): (a) no noise; (b) SNR = 50 dB; (c) SNR = 40 dB; (d) SNR = 30 dB.

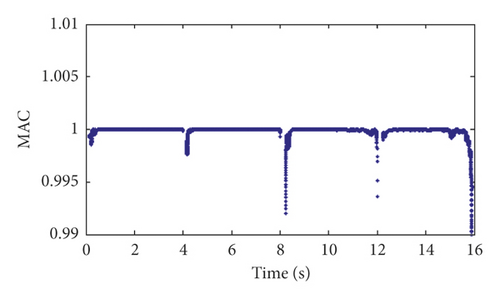
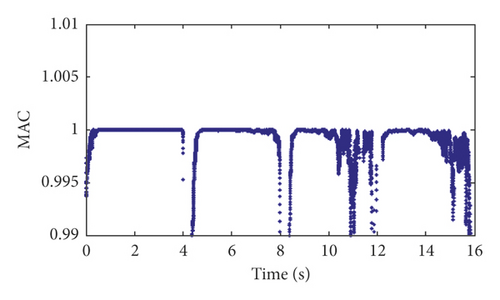
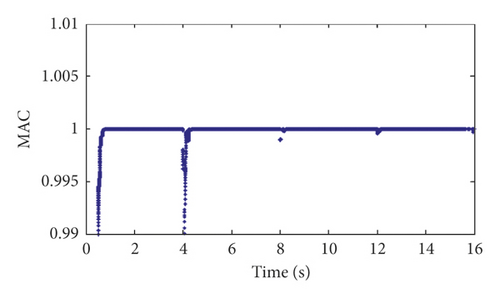
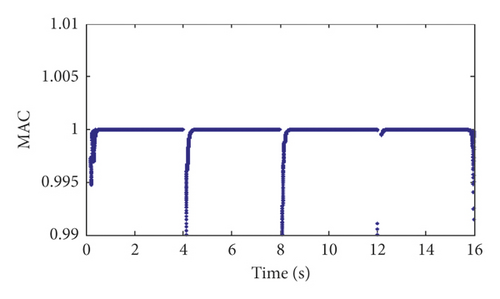
The modal assurance criterion (MAC) indexes between the identified modal shape vectors and the theoretical modal shape vectors are calculated and shown in Figure 13. In addition to some sudden changes in the MAC value at 4 s, 8 s, and 12 s, which is caused by the instability of the algorithm, the identification results of the modal shape vectors indicate the sufficient accuracy of the GYAST-RSSI method of tracking the time-varying structural modal shape vectors.
Details are in the caption following the image
The MAC between the identified and theoretical values of the modal shape vectors for simulation case 1 (SNR = 40 dB): (a) mode 1; (b) mode 2; (c) mode 3; (d) mode 4.
Details are in the caption following the image
The MAC between the identified and theoretical values of the modal shape vectors for simulation case 1 (SNR = 40 dB): (a) mode 1; (b) mode 2; (c) mode 3; (d) mode 4.
Details are in the caption following the image
The MAC between the identified and theoretical values of the modal shape vectors for simulation case 1 (SNR = 40 dB): (a) mode 1; (b) mode 2; (c) mode 3; (d) mode 4.
Details are in the caption following the image
The MAC between the identified and theoretical values of the modal shape vectors for simulation case 1 (SNR = 40 dB): (a) mode 1; (b) mode 2; (c) mode 3; (d) mode 4.
To evaluate the identification accuracy of the proposed time-varying modal identification method, the average relative error (ARE) of the frequencies is calculated and is shown in Table 1. The ARE of the certain order frequency is defined as
ARE = 1 N m = 1 N 100 % × f m t f m c f m t , (31)
in which f m t and f m c are the identification results and the theoretical value of the certain order frequency at time instant m, respectively.
Table 1. A comparison of the ARE of time-varying modal identification results for frequencies using the EIV-PAST-RSSI and GYAST-RSSI methods.
Case Mode Method No noise (%) SNR = 50 dB (%) SNR = 40 dB (%) SNR = 30 dB (%)
I 1 EIV-PAST-RSSI 0.25 0.41 0.63 0.88
GYAST-RSSI 0.23 0.44 0.51 0.75
2 EIV-PAST-RSSI 0.32 0.64 1.58 2.05
GYAST-RSSI 0.29 0.60 1.47 2.11
3 EIV-PAST-RSSI 0.30 0.83 1.02 1.37
GYAST-RSSI 0.36 0.80 0.97 1.22
4 EIV-PAST-RSSI 0.42 0.77 1.29 1.58
GYAST-RSSI 0.58 0.69 1.36 1.77
  
II 1 EIV-PAST-RSSI 0.11 0.20 0.59 0.92
GYAST-RSSI 0.21 0.34 0.48 0.85
2 EIV-PAST-RSSI 0.32 0.41 0.68 1.09
GYAST-RSSI 0.47 0.59 0.50 1.32
3 EIV-PAST-RSSI 0.79 0.86 1.25 1.73
GYAST-RSSI 0.79 0.86 1.25 1.73
4 EIV-PAST-RSSI 0.54 0.99 1.43 1.92
GYAST-RSSI 0.48 0.87 1.51 1.77

From Table 1, it can be seen that the identification accuracy is good for the two time-varying modal identification methods since the maximum ARE is 2.11%. With the decrease in the SNR, the identification accuracy for the frequencies has become low. Moreover, the GYAST-RSSI has better identification than the EIV-PAST-RSSI method in most cases.

3.2. Time-Varying Modal Identification of the Pacoima Arch Dam

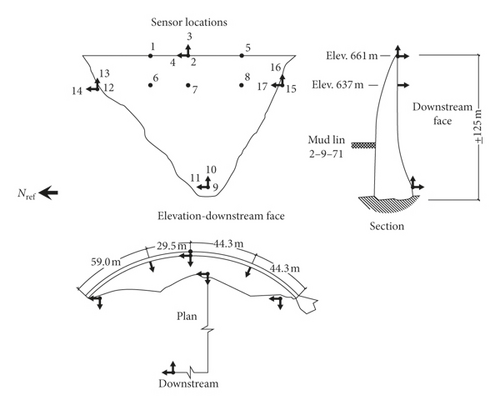
The Pacoima dam is a 113 m high arch dam located near Los Angeles, California. Since the Pacoima arch dam is near the famous San Fernando earthquake-prone area, it has experienced several earthquakes of different magnitudes. The dam experienced two severe earthquakes: the San Fernando earthquake (1971) and the Northridge earthquake (1994). Due to the damage caused by the San Fernando earthquake and the opening of the joints near the thrust block at the left abutment, rehabilitation operations were performed afterward, and an array of 17 accelerometers were installed on the dam in 1977 [32]. The arrangement of the 10 acceleration sensors with 17 measurement channels is shown in Figure 14. Among the 17 measurement channels, channels 1∼8 are located on the dam body and channels 9∼17 are located on the base rock. The measurement directions of channels 1, 2, 5, 6, 7, 8, 9, 12, and 15 are in the radial direction; channels 4, 11, 14, and 17 are in the tangential direction; and channels 3, 10, 13, and 16 are in the vertical direction. After the Northridge earthquake, the strong-motion observation system was updated, and the strong-motion responses of the three different earthquakes were recorded. The information of the three earthquakes is shown in Table 2.
Details are in the caption following the image
The arrangement of the accelerographs on the Pacoima arch dam.
Table 2. Information about three major California earthquakes.
Earthquake name Date Earthquake magnitude Location of earthquake source Depth of the earthquake source (km)
San Fernando 2001-01-13 4.3
Chino Hills 2008-07-29 5.5 3.5 km northwest of Los Angeles 13.6
Newhall 2011-09-01 4.2 12 km away from Los Angeles

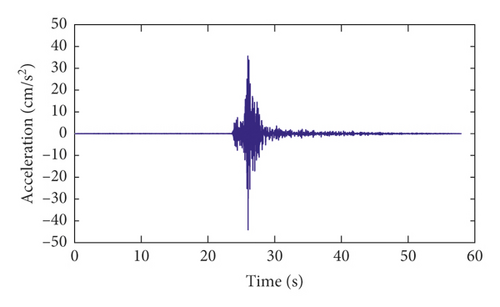
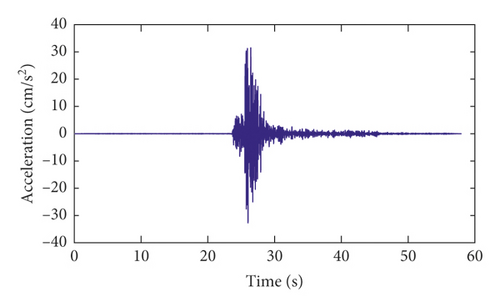
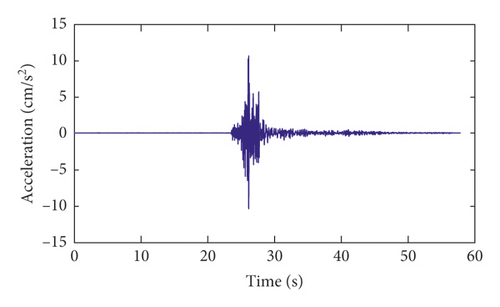
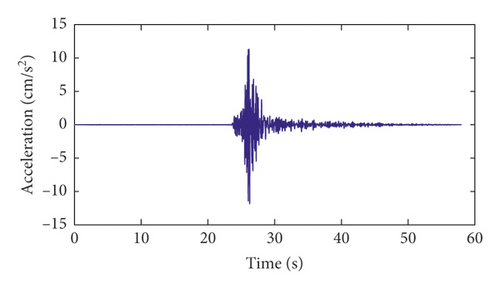
The strong-motion records of the Pacoima arch dam for channels 1, 2, 5, 6, 7, and 8 in the radial direction during the Newhall earthquake are shown in Figure 15. The sampling frequency of the strong-motion monitoring data is 200 Hz. Thus, the cutoff frequency of the data is 50 Hz.

Details are in the caption following the image
Strong motion of Pacoima arch dam of channels in the radial direction during the Newhall earthquake: (a) channel 1; (b) channel 2; (c) channel 5; (d) channel 6; (e) channel 7; (f) channel 8.
Details are in the caption following the image
Strong motion of Pacoima arch dam of channels in the radial direction during the Newhall earthquake: (a) channel 1; (b) channel 2; (c) channel 5; (d) channel 6; (e) channel 7; (f) channel 8.
Details are in the caption following the image
Strong motion of Pacoima arch dam of channels in the radial direction during the Newhall earthquake: (a) channel 1; (b) channel 2; (c) channel 5; (d) channel 6; (e) channel 7; (f) channel 8.
Details are in the caption following the image
Strong motion of Pacoima arch dam of channels in the radial direction during the Newhall earthquake: (a) channel 1; (b) channel 2; (c) channel 5; (d) channel 6; (e) channel 7; (f) channel 8.
Details are in the caption following the image
Strong motion of Pacoima arch dam of channels in the radial direction during the Newhall earthquake: (a) channel 1; (b) channel 2; (c) channel 5; (d) channel 6; (e) channel 7; (f) channel 8.
Details are in the caption following the image
Strong motion of Pacoima arch dam of channels in the radial direction during the Newhall earthquake: (a) channel 1; (b) channel 2; (c) channel 5; (d) channel 6; (e) channel 7; (f) channel 8.

Time-invariant modal identification results of the Pacoima dam using different methods are shown in Table 3. These identification results are used to make a comparison with the following time-varying modal identification results.

Table 3. Some time-invariant modal identification results of the Pacoima dam.
Earthquake Identification method Frequency (Hz) Damping ratio
Mode 1 Mode 2 Mode 3 Mode 1 Mode 2 Mode 3
San Fernando Optimization method [8] 4.73 5.06 6.2% 6.6%
San Fernando 4 spectra [32] 3.6–3.7 4.8–5.0 5.1–5.3 2.74% 2.48% 2.41%
Chino Hills ARX model [22] 5.40 5.75

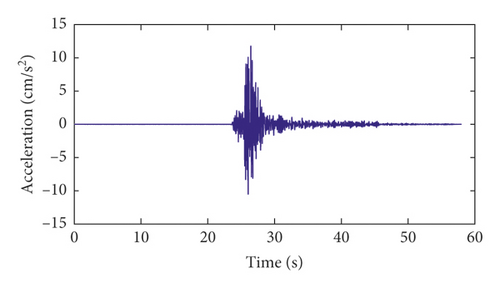
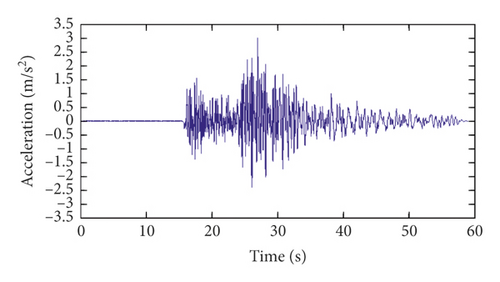
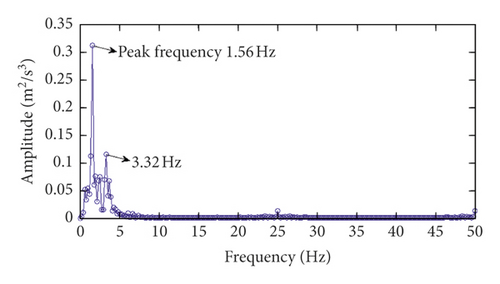
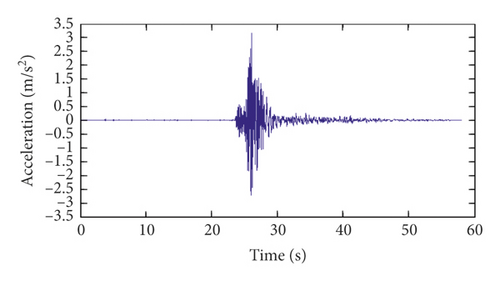
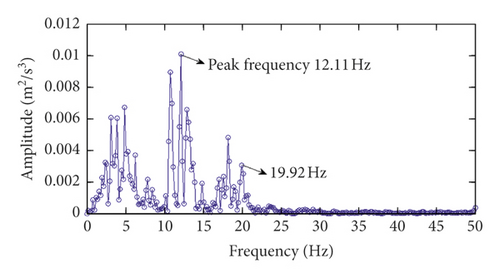
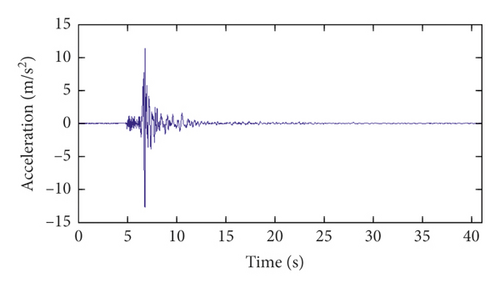
Channels 9∼17 are located on the base rock. The strong-motion records of channel 9 in the radial direction during the three major California earthquakes and the corresponding power spectrums are shown in Figure 15. As seen from Figure 15, for the San Fernando earthquake and the Chino Hills earthquake, the dominant frequencies of the earthquake excitations are less than 3.32 Hz. It can be seen from Table 3 that the dominant frequencies of the earthquake excitation are less than the first-order modal frequency of the dam. However, for the Newhall earthquake, the range of the dominant frequencies of earthquake excitation is much wider than those of the other two earthquakes. Therefore, for the Newhall earthquake, the final modal identification results of the dam should not include these dominant frequencies of excitation shown in Figure 16(f).
Details are in the caption following the image
The strong-motion records of channel 9 and the corresponding power spectrums during three major California earthquakes: (a) the strong-motion record of channel 9 during the San Fernando earthquake; (b) the power spectrum of the strong-motion record of channel 9 during the San Fernando earthquake; (c) the strong-motion record of channel 9 during the Chino hill earthquake; (d) the power spectrum of the strong-motion record of channel 9 during the Chino hill earthquake; (e) the strong-motion record of channel 9 during the Newhall earthquake; (f) the power spectrum of the strong-motion record of channel 9 during the Newhall earthquake.

By setting β = 0.995, p = 100, and N1 = 200, the structural frequencies and damping ratios are identified using the proposed time-varying modal identification method based on GYAST-RSSI, and the identification results are shown in Figures 1719. The vibration response of channel 1 is plotted to show the variation of the modal parameters with the acceleration amplitude. From Figures 1719, the time-varying characteristics of the arch dam during earthquakes are clearly observed, especially when the amplitude of the acceleration response is relatively large. According to Figures 1719, the frequency after the earthquake tends to be stable, indicating that none of the three earthquakes may cause any damage to the dam.

Details are in the caption following the image
Time-varying modal identification results of the Pacoima dam using the San Fernando earthquake data: (a) vibration response of channel 1; (b) identification results for frequencies.
Details are in the caption following the image
Time-varying modal identification results of the Pacoima dam using the San Fernando earthquake data: (a) vibration response of channel 1; (b) identification results for frequencies.
Details are in the caption following the image
Time-varying modal identification results of the Pacoima dam using the Chino Hills earthquake data: (a) vibration response of channel 1; (b) identification results for frequencies.
Details are in the caption following the image
Time-varying modal identification results of the Pacoima dam using the Chino Hills earthquake data: (a) vibration response of channel 1; (b) identification results for frequencies.
Details are in the caption following the image
Time-varying modal identification results of the Pacoima dam using the Newhall earthquake data: (a) vibration response of channel 1; (b) identification results for frequencies.
Details are in the caption following the image
Time-varying modal identification results of the Pacoima dam using the Newhall earthquake data: (a) vibration response of channel 1; (b) identification results for frequencies.

For the three earthquakes, the frequencies of the dam show a decreasing trend after the earthquake, which may be caused by the solid-water interaction and the reduction of the structural stiffness. As was shown in some previous works, the solid-water interaction can be simulated by the simple adding-mass method. The additional mass that is added to the structural system will reduce the frequencies of the dam-reservoir-foundation system. However, the decrease in the frequencies can also be caused by the reduction of the structural stiffness during earthquakes, which needs to be studied in the future. When the amplitude of the acceleration is very low, the modal identification results tend to be time variant. These time-varying modal identification results demonstrate that the dynamic characteristics of concrete dams during large earthquakes are time-varying indeed.

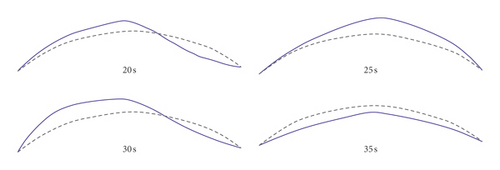
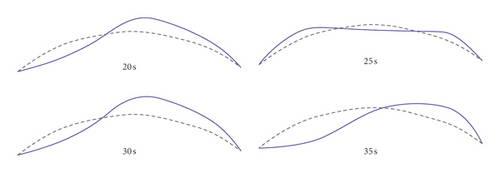
For four typical time instants, t = 20 s, 25 s, 30 s, and 35 s, the identification results of the modal shape vectors using the strong-motion records of the Newhall earthquake are shown in Figure 20. Figure 20 shows the time-varying characteristics of the arch dam’s modal shape vectors during the earthquake.
Details are in the caption following the image
Time-varying modal shape vectors of the Pacoima dam using the strong-motion records of the Newhall earthquake (dash line represents the original arch circle, and blue line represents the modal shape): (a) mode 1; (b) mode 2.
Details are in the caption following the image
Time-varying modal shape vectors of the Pacoima dam using the strong-motion records of the Newhall earthquake (dash line represents the original arch circle, and blue line represents the modal shape): (a) mode 1; (b) mode 2.

4. Conclusions

The online modal identification method of concrete dams proposed in this work has been verified using a numerical example and an engineering example. The GYAST is a good tool to track the signal subspaces of different modes to reduce the disturbance of the observation noise and stochastic excitation since it shows good identification accuracy, robustness, and computation efficiency. The identification accuracy of the frequencies and modal shape vectors is sufficient, while for the damping ratios, the performance of the proposed online modal identification method still needs to be improved. Some possible ways to obtain a better identification result of the damping include improving the robustness of the subspace tracking algorithms, signal denoising, and adopting input-output modal identification methods. The time-varying modal parameters identified using the strong-motion records of concrete dams can be used as important features to study the real dynamic characteristics of structures during large earthquakes, which is our research direction in the future.

Conflicts of Interest

The authors declare that they have no conflicts of interest.

Acknowledgments

This work was supported by the National Natural Science Foundation of China (Grant nos. 51409205, 51279052, 51409018, and 51309189), the National Natural Science Foundation for Excellent Young Scientists of China (Grant no. 51722907), a project funded by the China Postdoctoral Science Foundation (Grant no. 2015M572656XB), and the Open Foundation of the State Key Laboratory of Hydrology-Water Resources and Hydraulic Engineering (Grant no. 2014491011). The authors appreciate Professor Mostafa Arjomandi-Lari for providing the MATLAB code for the GYAST algorithm online. The authors also appreciate the Center for Engineering Strong Motion Data; all strong earthquake records used in this article are derived from this centre.

    Data Availability

    The strong earthquake records data used to support the findings of this study may be released upon application to the Center for Engineering Strong Motion Data at https://strongmotioncenter.org. The MATLAB code for the GYAST algorithm online to support the findings of this study is available from the Professor Mostafa Arjomandi-Lari [22]. The numerical simulation and other data used to support the findings of this study are available from the corresponding author upon request.

      The full text of this article hosted at iucr.org is unavailable due to technical difficulties.