Experimental and Numerical Simulation Study on the Shock and Vibration Effect of OD1422-X80 Mainline Natural Gas Pipeline Explosion
Abstract
In this paper, the explosion experiment of the OD1422-X80 natural gas pipeline was carried out. The phenomenon of pipeline explosion was recorded, and a large amount of data on vibration effects were obtained. The data showed that the ground vibration during the explosion was mainly caused by the physical explosion process, and the subsequent gas explosion did not produce strong vibration. Based on the ANSYS/LS-DYNA platform, a numerical calculation model of this experiment was established. The numerical results agreed well with the experimental results. Simulation and experimental results showed that when the gas pressure in the pipe was lower than 7 MPa, the pipeline cracks stop growing. The maximum speed of the pipe wall moving outward reached 50 m/s, which formed a huge impact compression effect on the surrounding soil. This state spread to distant places and gradually decayed into an elastic stress wave, which formed a ground vibration effect. Time-frequency analysis was introduced into the vibration signal processing. The analysis results showed that the main frequency of pipeline explosion vibration was distributed around 10 Hz and had a long duration. The research results provided a reference for subsequent gas pipeline explosion test and numerical simulation research.
1. Introduction
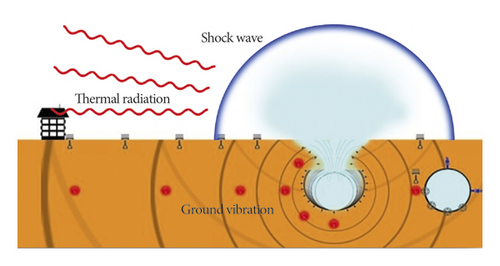
Statistics have shown that the total mileage of global oil and gas pipelines had reached 2 million 50 thousand kilometers [1]. Among them, the total mileage of natural gas pipelines in the world is 1 million 370 thousand kilometers [2]. With the increase in pipeline pressure, the risk of pipeline explosion increases. Natural gas pipeline explosion produces three harmful effects (shock wave, ground vibration, and thermal radiation), as shown in Figure 1. Research on thermal radiation and shock waves has been very extensive [3–5]. However, there is still a lack of research on the ground vibration effect caused by a natural gas pipeline explosion.
Wang [6] used Autodyna software to establish the simulation model of a pipeline explosion, calculated the overpressure deformation of a pipeline subjected to parallel pipeline explosion with different parallel spacing, and evaluated the risk of pipeline impact deformation. Guiyu et al. [7] carried out three-dimensional dynamic numerical simulation calculation and analysis on seismic wave propagation and dynamic response of buried oil and gas pipelines after an accidental explosion in an explosive depot and obtained vibration velocity response characteristics of the pipeline. Yang et al. [8] put forward a fluid-structure coupling algorithm which took into account the stability of calculation and simulated the dynamic fracture of a pipeline and the development of explosive flow field under the action of an internal gas explosion to predict the consequences of the gas explosion in a pipeline.
In summary, there was currently no relevant research on the vibration effect of pipeline explosion. In this paper, explosion experiment and numerical simulation were carried out to study the interaction process of air-pipe-soil, and the main cause of a ground vibration of high-pressure pipeline was revealed. The research results will provide a reference for future pipeline explosion accident analysis and prevention.
2. OD1422-X80 Pipeline Explosion Experiment
2.1. Scheme of the Experiment
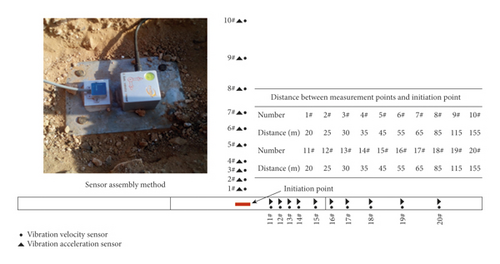
The pipeline used in the experiment was type OD1422-X80, which was widely used in West-East Gas Transmission Project [9, 10]. The parameters are shown in Table 1. The length of the experimental pipeline was 430 m, and the internal pressure was 13.3 MPa. Gas components are shown in Table 2. Twenty vibration measuring points were arranged in the experimental field. The distribution of the measuring points and the sensor assembly are shown in Figure 2.
| Piping material | Outer diameter (mm) | Modulus of elasticity (GPa) | Poisson ratio | Yield strength (MPa) | Wall thickness (mm) | Buried depth (m) | Pressure (MPa) |
|---|---|---|---|---|---|---|---|
| X80 | 1422 | 206 | 0.3 | 578 | 22.4 | 1.2∼1.3 | 13.3 |
| Component | CH4 | CH3CH3 | CO2 | N2 | Other gases |
|---|---|---|---|---|---|
| Mol% | 94.91 | 2.55 | 0.94 | 1.4 | 0.2 |
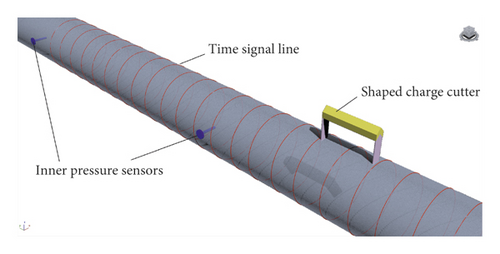
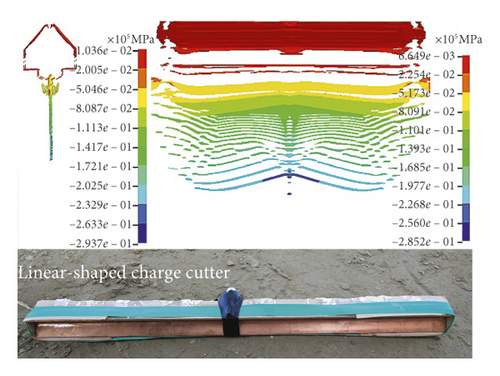
Pressure sensors were installed in the pipe to record the change of pressure during the explosion. At the same time, the break signal line was pasted on the pipe wall to record the arrival time of the crack, as shown in Figure 3. In order to simulate the pipeline explosion due to material failure, the method of artificial introduction of defects was adopted in this experiment. A linear shaped charge cutter was designed [11, 12], which was installed on the pipeline along the axis, as shown in Figure 4. At the same time, in order to simulate the worst case of the pipeline explosion, an ignition device was set up to ignite leaked gas.
2.2. Experiment Process and Phenomenon Analysis
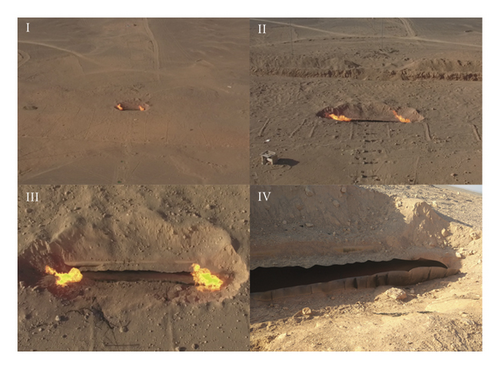
The ignition network integrated the shaped charge cutter, the ignition device, and the test network trigger signal. When the detonation signal was sent out, the incendiaries were first launched and the cutter entered the delay procedure. One second later, the cutter detonated, and the jet first cut off the first break signal line, the test network was activated, and all the instruments began recording. The jet penetrated the pipe and formed a crack on the pipe wall. Under the action of internal high pressure, the pipeline cracked. Nature gas was ejected from the pipeline and was ignited after contact with the incendiaries. The fire expanded rapidly, forming a huge mushroom cloud. The explosion process is shown in Figure 5. The maximum diameter of the fireball was about 150 m, and the height of the mushroom cloud was about 300 m. The observation station was 2 kilometers away from the center of the detonation, and the observers felt obvious heat radiation. After the explosion, an unmanned aerial vehicle was dispatched to the exploding center to investigate the explosion. A huge crack was observed in the pipeline, and residual gas continued to burn, as shown in Figure 6.
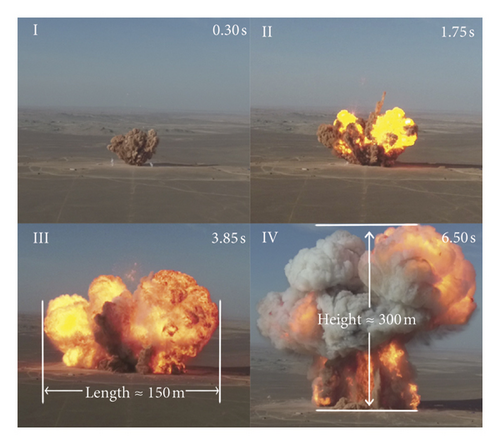
Since the synchronous trigger mode was adopted, the time information of the vibration signals reaching different measuring points could be distinguished, as shown in Figure 7.
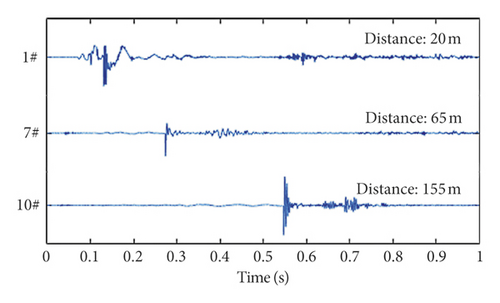
Comparing Figures 5 and 7, it could be seen that the seismic wave reached measuring point 1# at 0.1 s after the jet cut off the trigger line of the test network. The leaked natural gas was ignited at 0.3 s and reached full deflagration after about 3 s. During this time, no obvious seismic waves were detected. It could be judged that the ground vibration effect of the explosion of the natural gas pipeline was not caused by the deflagration of natural gas. From the perspective of time information, the main cause should be the physical explosion process.
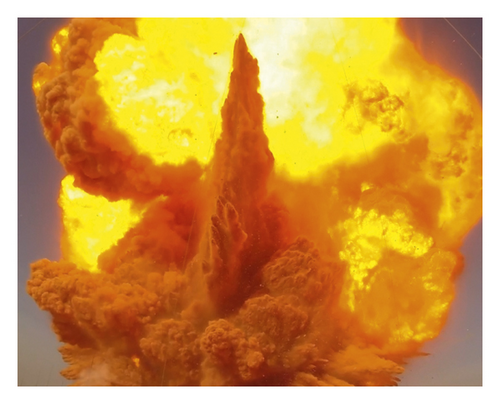
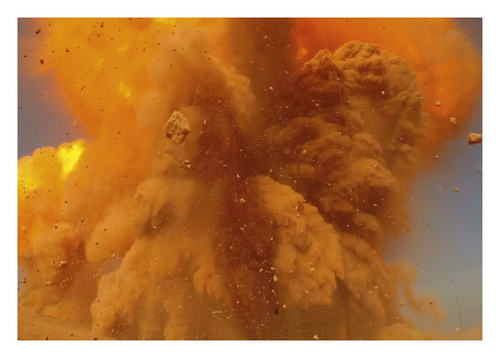
As for the small vibration after the main vibration (i.e., at about 0.55 s for measuring point 1#, at about 0.35 s for measuring point 7#, and at about 0.65 s for measuring point 10#), the group discussed and reached a conclusion about this phenomenon. According to the GoPro image we obtained at the measuring point, this part of the vibration may come from falling rocks, which were thrown around by the explosion. Video screenshots are shown in Figure 8.
3. Simulation Model for OD1422-X80 Pipeline Explosion
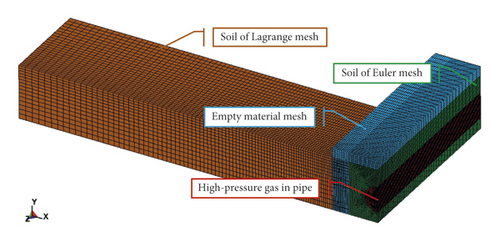
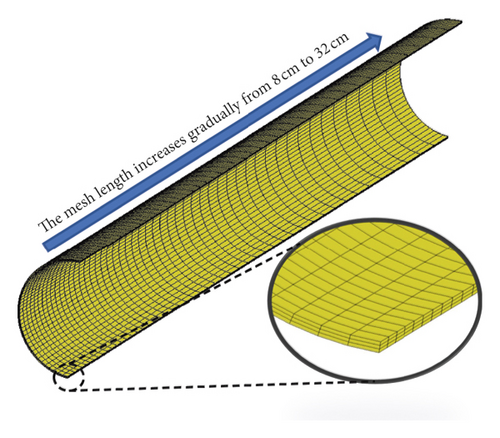
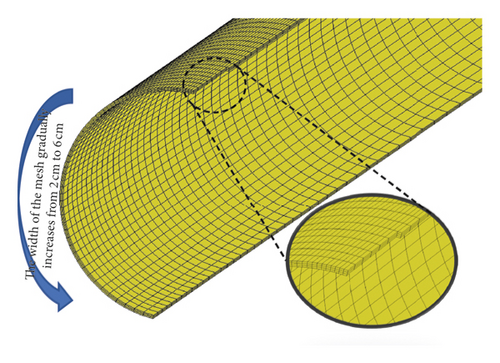
By using the inherent symmetry of the studied problem, the calculation time can be saved. Thus, only a quarter of the model was built with the appropriate boundary conditions applied along the symmetry planes. SOLID164 element and g·cm-μs unit were used in the simulation. At the Euler-Lagrange interface, the interaction was considered. In order to satisfy the condition of large deformation, a soil model with a depth of 3 m and a width of 1.6 m along the axis of the pipeline was established and meshed by the Euler mesh, in which the grid is fixed and the material flows through it. At the same time, in order to obtain the vibration velocity of soil nodes, a 20-meter-long, 5-meter-wide soil model was established in the direction perpendicular to the pipeline, and the Lagrange grid was used to mesh the soil, in which the coordinates move with the material, as shown in Figure 9. Moreover, the Euler mesh was used to model the gas and empty grid. The Lagrange mesh was used to model the pipeline. A convergence study was conducted to obtain the optimal number of elements. The mesh size of the gas was 8 cm. In order to take account of the accuracy of the simulation and the cost of computing time, gradient grids are used in both axis and circumference of the pipe wall and soil, and the size of the grid was between 8 cm and 32 cm. The semi-infinite soil domain was simulated by defining the nonreflect boundary condition. Nonreflect boundary condition is one of the functions of LS-DYNA. When stress wave propagates to the boundary, it will not reflect, so it will not affect the propagation of the stress wave in the model. The initial crack was created at the center of the top of the pipe wall by deleting the element to model the crack damaged by the linear cutter in the experiment, as shown in Figure 10.
| Material number | Density (g·cm−3) | State equation | Internal energy (J·cm−3) |
|---|---|---|---|
| ∗MAT_NULL | 1.015 × 10⁻¹ | ∗EOS_LINEAR_POLYNOMIAL | 33.25 |
| Material number | Density (g·cm−3) | Shear modulus (MPa) | Young’s modulus (MPa) | Poisson ratio | Yield strength (MPa) |
|---|---|---|---|---|---|
| ∗MAT_JOHNSON_COOK | 7.89 | 7.7 × 10⁴ | 2.06 × 10⁵ | 0.3 | 5.78 × 10² |
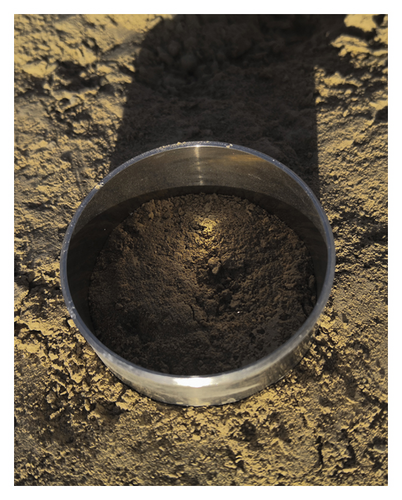
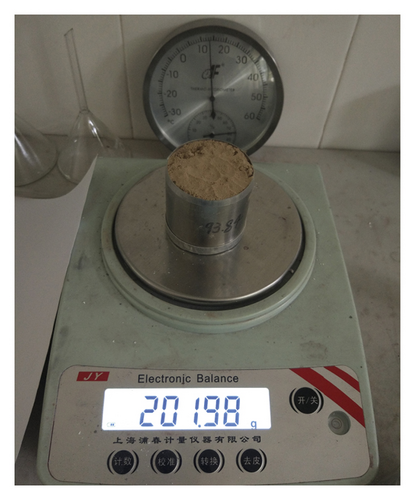
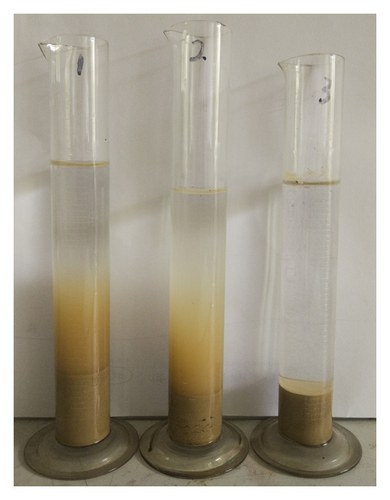
In the West-East Gas Pipeline Project, a considerable length of pipeline needed to pass through the Gobi soil. This natural gas explosion test site was also Gobi soil. The Gobi Desert is one of the great deserts and semidesert areas in the world. It covers the vast land of Central Asia and spans vast space of Mongolia and China. Most of the Gobi area is not desert but bare rock [15]. The model parameters for the Gobi soil medium have not been reported. Therefore, the experimenter collected soil samples from the experimental site and brought them to the laboratory for testing, as shown in Figure 11.
3.1. Collecting Soil Samples with a Ring-Knife of Known Volume and Weight
The natural density of the soil sample could be calculated by measuring the total weight of the ring-knife and the soil sample. At the same time, the sieving method and hydrostatic sedimentation method were used to analyze the particle size distribution of soil. The shear strength of the soil sample was measured by the direct shear test. The measured parameters of soil samples are shown in Tables 5 and 6.
| Natural density (g·cm−3) | Moisture content (%) | Soil particle density (g·cm−3) | Porosity (%) | Dense degree (%) | Shear modulus (MPa) |
|---|---|---|---|---|---|
| 1.1 | <1 | 2.16 | 49.92 | 50.08 | 26.1 |
| Particle size (mm) | 2.0 | 1.0 | 0.06 | 0.02 | 0.01 | 0.004 | 0.002 | <0.002 |
| Mass fraction | 0.3 | 2.6 | 5.4 | 10.7 | 25.6 | 31.7 | 24.3 | 11.4 |
Furthermore, the quasistatic one-dimensional compression test was carried out by the universal material testing machine [16, 17]. The ring knife with soil sample was mounted on the test platform, as shown in Figure 12(a). The inner diameter of the ring knife was 50 mm, and the height of the soil sample was 50 mm. The compression rate was 0.05 mm/s, and the termination pressure was 80,000 N. The stress-strain curve of the soil sample obtained from the test is shown in Figure 12(b).
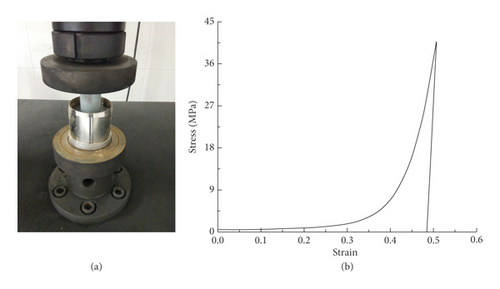
The soil model used material No. 5, ∗MAT_SOIL_AND_FOAM. This material model has been widely used in the simulation of large deformation of soil. It can accurately simulate the movement pattern of soil under impact load. At the same time, the attenuation effect of soil on vibration can be well simulated. The soil parameters obtained from the test were input into the model, as shown in Table 7, and the soil stress-strain curve was defined by 10 key points, as shown in Table 8.
| Material number | Density (g·cm−3) | Shear modulus (MPa) | Unloading modulus (MPa) | Cutoff pressure (MPa) |
|---|---|---|---|---|
| ∗MAT_JOHNSON_COOK | 1.1 | 26.1 | 2.2 × 10³ | 0.1 |
| Strain | 0.00 | −0.10 | −0.20 | −0.26 | −0.31 | −0.36 | −0.38 | −0.40 | −0.46 | −0.49 |
| Stress (MPa) | 0.00 | 0.81 | 1.40 | 2.51 | 5.00 | 10.00 | 15.00 | 20.00 | 120.00 | 180.00 |
4. Comparison between Experimental Results and Numerical Simulation
4.1. Pipe Wall Crack State
After the explosion, the UAV sent back the pipe crack image, as shown in Figure 13. Compared with the simulation results, it could be seen that the shape of the pipe crack was approximately similar. At the same time, due to the violent tensile fracture process, the wall of the crack appeared wavy. In the plastic strain nephogram of the calculated results, it could be seen that obvious stress concentration occurred at the fracture position of the pipe wall [18, 19].
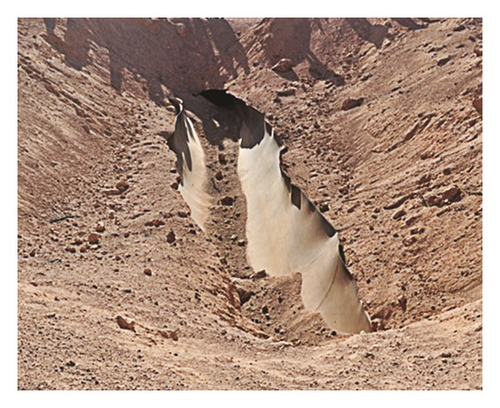
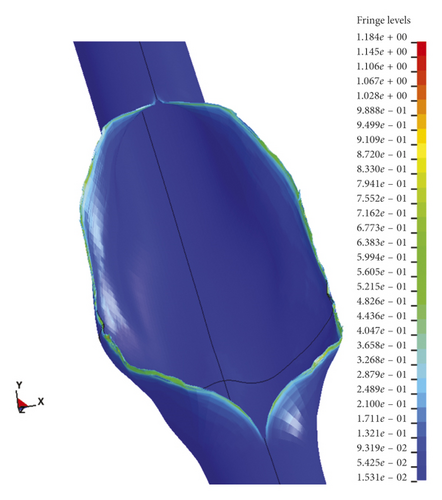
Figure 14 shows the calculation result of the cracking process of the pipe wall. It could be seen from the figure that the stress concentration zone was formed at the crack tip when the pipe wall was uplifted in the middle of the initial crack under the action of the internal pressure. The wall material failed here, and the crack began to expand, eventually forming a spindle-like crack state [20, 21].

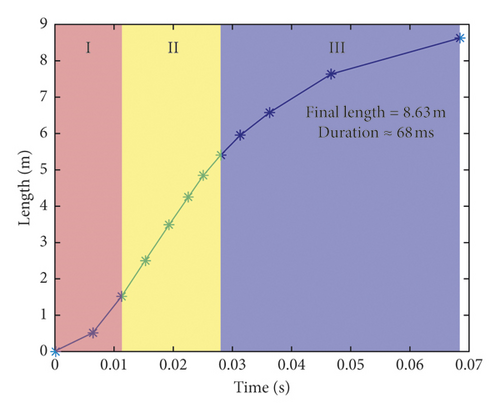
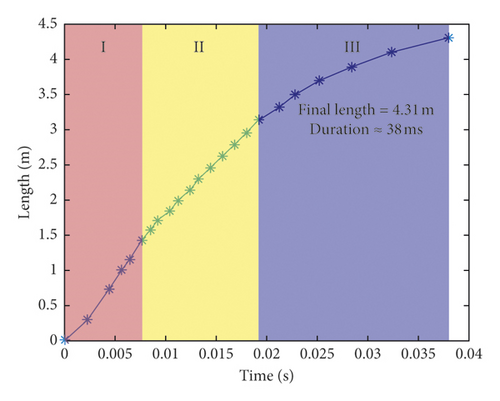
The crack growth curve of the pipe wall was obtained from the data of the break signal line of the pipe wall, as shown in Figure 15(a). In the postprocessing software, the crack propagation curve of the simulation model was obtained by referring to the failure time and location of the element on the pipe wall, as shown in Figure 15(b). There were three stages of pipe wall cracking: accelerated cracking (I), stable expansion (II), and deceleration and stop crack (III). In the experiment, the crack growth lasted for 68 ms and the final length was 8.63 m (one side). In the simulation, the crack growth lasted for 38 ms and the final length was 4.31 m (one side). As for the difference between crack growth time and length for experimental and numerical modelling, the research group discussed this phenomenon and the final conclusion was that the pipeline in the simulation model was much shorter than that in the test. Therefore, the pressure drop in the simulation was faster than that in the test, which further resulted in that the crack size in the simulation was smaller than that in the test. Further analysis on air pressure can be found in Section 4.2.
4.2. Pressure State
According to the pressure distribution in the pipe as shown in Figure 16, the decompression wave propagated from the crack to the pipe. With the expansion of pipe cracks, the pressure in the pipe decreased sharply. From the difference of the pressure curve between the two points in Figure 17, it can be seen that the pressure gradient in the pipe becomes gentle as the pressure decreases.
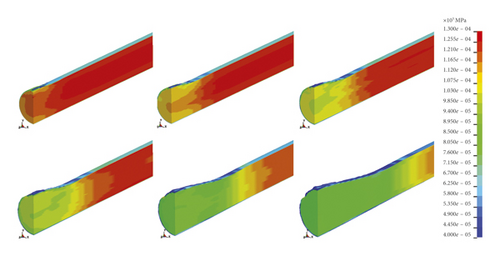
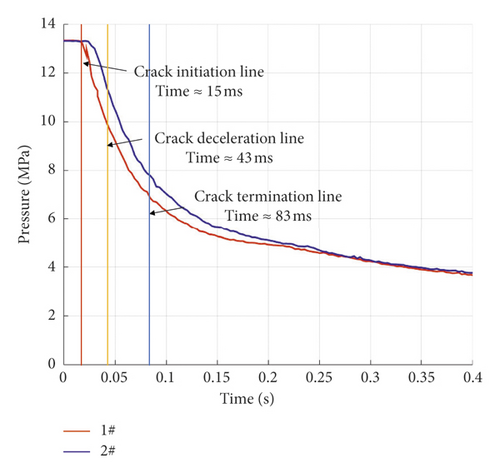
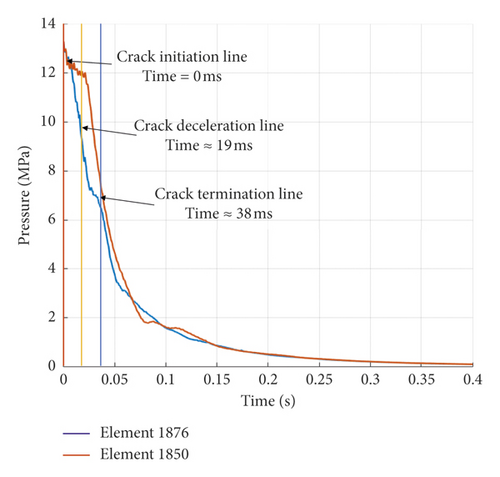
Figure 17(a) shows the data obtained by the pressure sensors inside the pipe. Figure 17(b) shows the result of numerical simulation. There were some similarities between them. First of all, the pressure curve exponentially decreased. The pressure gradient in the initial stage was large and decreased with the decrease in pressure. It could be seen from Figures 14 and 16 that the pressure around 10 MPa was insufficient to maintain stable crack growth, and when the pressure dropped to 7 MPa, the crack stopped growing.
On the other hand, there were obvious differences between the two figures. The decline in experimental data was significantly slower than the simulation results. The reason should be that the total length of the experiment pipe was much larger than that of the numerical simulation so that the air pressure maintained a slower decline rate. Because of the limitation of computer performance, the model size was limited, so the amount of gas in the simulation process was far less than that of the experiment. This was why the crack length in the experimental results was much larger than that in the simulation.
4.3. Pipe-Soil Interaction
The corresponding nodes were selected to observe the velocity and displacement information of the pipe wall, as shown in Figures 18 and 19. It could be seen that the total displacement of the crack tip reached 100 cm, and the peak velocity reached 50 m/s. That was to say, the extrusion effect of the pipe wall on the soil was equivalent to an impact of 180 km/s. Such strong impact compression would inevitably lead to huge deformation and vibration of soil.
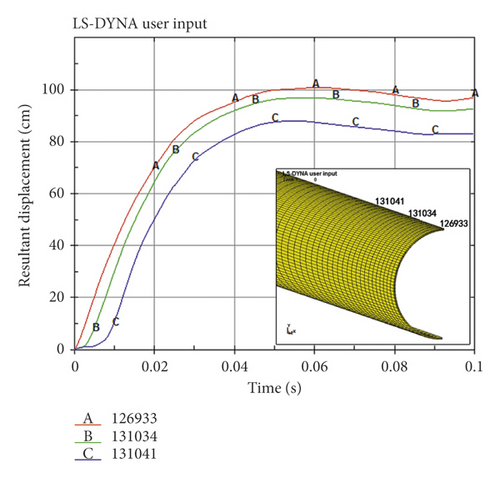
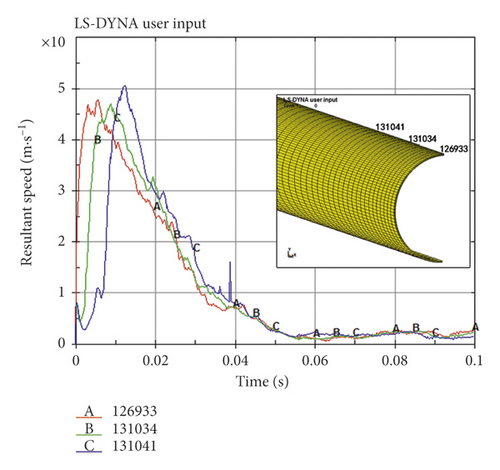
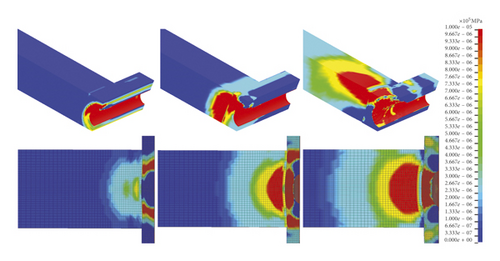
Figure 20 shows the pressure state in the soil. It could be seen that the soil formed a plastically compressed state after being strongly crushed by the pipe wall and this state was transmitted outward. As the distance increased, the plastic wave decayed into an elastic wave, which evolved into a ground vibration effect.
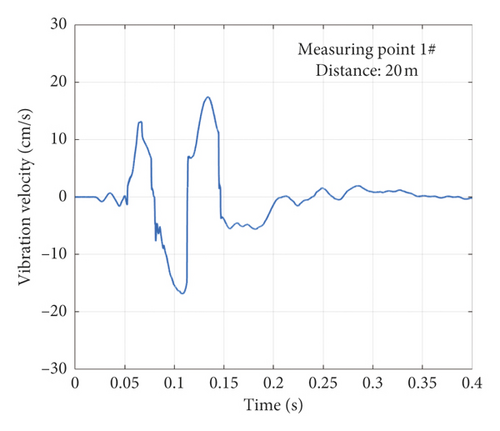
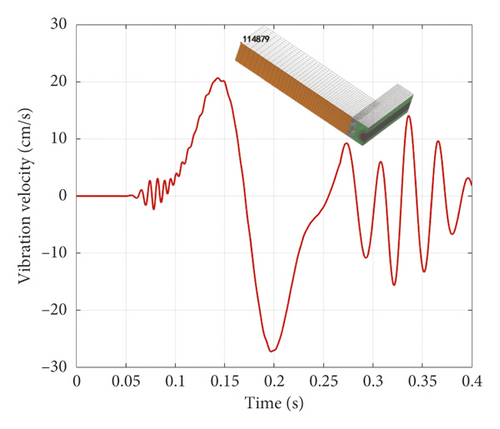
The vibration data of measuring point 1# was selected, as shown in Figure 21(a). The vibration speed curve of the node on the model corresponding to the position of measuring point 1# is shown in Figure 21(b). It could be seen that the vibration peak of the experiment was 18 cm/s, while the vibration peak value of the simulation result was 27 cm/s, and the error was 50%. After discussion, the authors believed that the reason for this error was that the homogeneity of soil materials used in the numerical simulation was very high, while the soil in the experimental site was mixed with impurities such as gravel. In addition, the topographic fluctuation in the experimental site might also be the cause of the error. By comparing similar literature [22, 23], the authors considered that such an error range is acceptable in the field of vibration simulation.
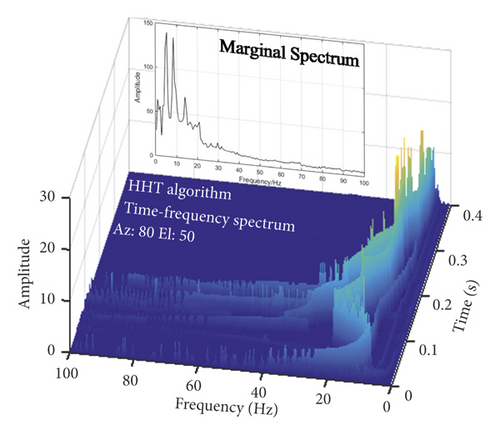
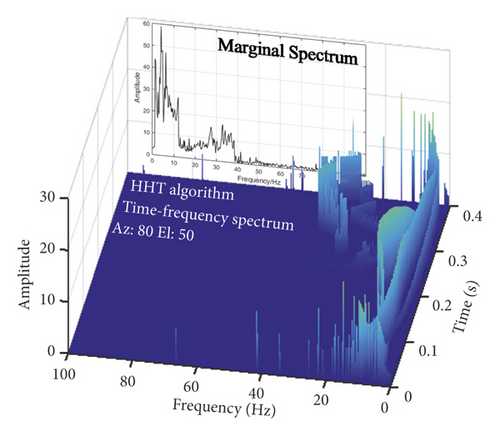
Time-frequency analysis was introduced into the vibration signal processing [24–26], and the time-frequency energy distribution spectrum and the marginal spectrum of the vibration data were obtained. As shown in Figure 22, the main frequencies of the two waveforms were very close, and they were both distributed in the frequency band of about 10 Hz. The difference was that the experimental signal had energy distribution in the frequency band of 0∼100 Hz at the initial stage, although the amplitude was not high. The source of this energy might be the refraction and reflection of waves. Or, it might be the noise brought by the instrument [27, 28].
5. Discussion
- (1)
The explosion of high-pressure natural gas pipelines is usually divided into two stages: physical explosion and gas explosion. The ground vibration effect was mainly generated in the first stage (physical explosion), and the gas explosion process did not produce obvious vibration.
- (2)
The cracking of the pipe wall had three processes: accelerated cracking, uniform cracking, and deceleration. When the pressure inside the pipe was lower than 10 MPa, it would not be sufficient to support the continuous expansion of the crack. If the pressure continued to drop to 7 MPa, the pipeline cracks stopped growing.
- (3)
The maximum speed of the pipe wall moving outward reached 50 m/s, which formed a huge impact compression effect on the surrounding soil. This state spread to distant places and gradually decayed into an elastic stress wave, which formed a ground vibration effect.
- (4)
The main frequency of the vibration generated by the pipeline explosion was distributed in the frequency band of 0∼20 Hz and had a long duration. This low-frequency long-term vibration excitation could easily cause structural resonance and should be taken seriously.
Conflicts of Interest
The authors declare that they have no conflicts of interest.
Acknowledgments
This research was supported by the National Natural Science Foundation of China (nos. 11672331, 51808554, and 51608530). The authors would like to gratefully acknowledge this support.
Open Research
Data Availability
The data used in this paper can be obtained from the following link: https://figshare.com/s/e2aea8d0ff64d0fcebed. As the data laws continue to be studied, the data at other measurement points are not supported for download.


