Degradation State Identification of Cracked Ultrasonic Motor by Means of Fault Feature Extraction Method
Abstract
The cracking of piezoelectric ceramics is the main reason of failure of an ultrasonic motor. Since the fault information is too weak to reflect the condition of piezoelectric ceramics especially in the early degradation stage, a fault feature extraction method based on multiscale morphological spectrum and permutation entropy is proposed. Firstly, a signal retaining the morphological feature under different scales is reconstructed with multiscale morphological spectrum components. Then, the permutation entropy of the reconstructed signal is taken as the fault feature of piezoelectric ceramics. Furthermore, a sensitivity factor is defined to optimize the embedded dimension and delay time of permutation entropy according to double sample Z value analysis. Finally, a matrix composed of the probability distributions, obtained from permutation entropy calculation, is applied for the degradation state identification by means of probability distribution divergence. The analysis of actual test data demonstrates that this method is feasible and effective.
1. Introduction
Ultrasonic motor has been widely used in the areas such as aerospace, medical equipment, optical instruments, robots, and new military equipment, due to some advantages of high torque, quick response, no electromagnetic interference, and autolocking [1, 2]. Piezoelectric ceramics is the key part of the ultrasonic motor, but this material is brittle, and it is prone to crack due to high-frequency excitation for a long time operation. The propagation of cracking would result in the failure of the piezoelectric ceramics, and then the torque and speed performance would also be greatly affected. So it is necessary to pay considerable attention to the fault feature extraction and degradation state identification for piezoelectric ceramics of an ultrasonic motor.
With the development of maintenance theory and relative technologies, more and more advanced fault diagnosis methods have been used for rotating machinery. However, few literatures refer to the fault feature extraction or degradation state identification for piezoelectric ceramics of an ultrasonic motor, and the research mainly focuses on the mechanism and stress analysis [3–5].
Unlike other mechanical devices, the ultrasonic motor comes with a monitor electrode used to reflect the vibration state of a stator, and the monitor electrode voltage (MEV) generated by the positive piezoelectric effect can be used for fault information extraction. From this point of view, the fault diagnosis methods based on vibration signal analysis seem to have great reference value for this study. From the relevant research in recent years, wavelet transform and empirical mode decomposition (EMD) are the current popular methods applied for the rotating machinery fault diagnosis. In the aspect of wavelet transform, Heidari et al. proposed a method based on the wavelet support vector machine with Morlet wavelet transform to diagnose different types of fault in the gearbox [6]. Wang et al. proposed Gauss–Hermite integration-based Bayesian inference method to estimate the posterior distribution of wavelet parameters, and then an optimal wavelet filtering was conducted to extract bearing fault features [7]. In the aspect of EMD, Abdelkader et al. realized the early fault detection of rolling bearing based on the improved EMD method [8]. Yuan et al. applied the EMD method to the multifault diagnosis of bearing [9]. Unfortunately, these popular methods also have unsolved problems: one is the selection of thresholds and wavelet basis in wavelet transform, and another one is the mode fixing and end effect in the EMD method [10].
A method called morphological signal processing, which can extract fault feature from strong background noise while retaining the shape characteristics of the useful information, has received considerable attentions [11]. Yu et al. proposed an improved morphological component analysis method for the compound fault of the gear and the bearing in gearboxes [12]. In order to solve the problem that single-scale analysis may suffer from the completeness in the extracted features, Yan et al. proposed an adaptive multiscale combination morphological filter-hat transform for bearing fault diagnosis [13]. Furthermore, entropy is able to quantify the disorder or uncertainty of probability distribution, and it has been widely applied in damage monitoring [14]. Yu et al. applied the time-frequency entropy method to gear fault diagnosis with the help of Hilbert–Huang transform [15]. Among the applications of entropy, it is worthy noting that permutation entropy (PE) has been widely used in the mutation detection of electroencephalogram, heart interbeat signal, and mechanical signal in past few years [16–18]. PE not only reflects the complexity of one-dimensional time series but also has a high sensitivity to information influenced by dynamic changes in complex systems [19]. Considering the fact that the wave transmission would be subjected to a disturbance when the traveling wave passes through the crack of piezoelectric ceramics in the ultrasonic motor, PE is possible to be used to indicate the degradation trend.
With regard to the method of degradation state identification, gray relational analysis is a dynamic mapping for the relative changes in the signal [20]. However, the distinguishing coefficient limited by prior experience has a great influence on the recognition results. In past years, probability distribution divergence (PDD) analysis has made remarkable achievement in fault diagnosis of bearing, gears, motor, and hydraulic pump [21–23]. Based on this idea, the probability distributions that were obtained from PE calculation are expected to be applied for the degradation state identification of piezoelectric ceramics in the ultrasonic motor.
In this paper, the MEV signal will be used to extract the fault information. The paper is organized as follows: Section 2 briefly reviews the principles of multiscale morphological decomposition, and then the reconstructing signal method based on multiscale morphological spectrum (MMS) components is introduced. In Section 3, the MMS-PE scheme is detailed, and a sensitivity factor is proposed to optimize the selection of embedded dimension and delay time in PE calculation. In Section 4, the flowchart of degradation state identification based on PDD analysis is given. The effectiveness of the proposed method will be validated with experiment results in Section 5. Finally, the conclusions are provided in Section 6.
2. MMS Components
According to Equation (1), we can easily notice that the expansion and corrosion operations are just maximum and minimum value filtering within the structural element for f(n). The expansion operation can increase the valley value of the function, while corrosion operation can reduce the peak value of the function. Equation (1) involves only the addition, subtraction, and extreme value operation, so there is a great advantage in the speed of signal processing.
The opening operation can filter out the peak noise, while the closing operation can deal with the valley noise. So the above two operations have the abilities of smoothing edge burrs and filling the signal holes.
According to Equations (6) and (7), the number of morphological spectral components is λmax−1 under the maximum analysis scale λmax. Let us denote the morphological spectral component of the MEV signal as fc(n), where c = 1, 2, …, λmax−1. MMS has the ability to present the morphological features in different scales, and the magnitude of fc(n) can reflect the content of morphological feature matching the structural elements of responding scale in the signal [25].
3. MMS-PE
PE is an indicator which can be used to measure the complexity and randomness of one-dimensional time series, and it is suitable for detecting the changes in the monitoring signal for a dynamic system. The smaller the randomness of the signal, the lower the complexity and the PE value. As far as the ultrasonic motor is concerned, the driving voltage with high frequency is a sinusoidal signal; therefore, MEV generated by the positive piezoelectric effect is also sinusoidal. When the ceramic piece is intact, the MMS-PE of the MEV signal is small due to the regularity of the sinusoidal signal. Once a crack appears, the vibration of the stator will be affected, and the fluctuation of the speed will also lead to the nonstationary characteristics of the MEV. As the degree of degradation increases, MEV will become more and more irregular, and the MMS-PE value which characterizes the complexity of the signal will also be larger. Based on the above analysis, it is reasonable to take MMS-PE as the fault feature of piezoelectric ceramics in this paper.
Both embedding dimension m and time delay τ should be selected within a certain range because large m will cost overmuch computation and large τ will bring to overmuch loss of wave information. The two parameters are integer, so the preferred combination of m and τ can be selected by the maximum value of the sensitivity factor within limited combinations.
4. Degradation State Identification Based on PDD Analysis
- (1)
PDD(Pt, Ps) = PDD(Pt, Ps)
- (2)
PDD(Pt, Ps) ≥ 0
- (3)
PDD(Pt, Ps) = 0 if Pt = Ps
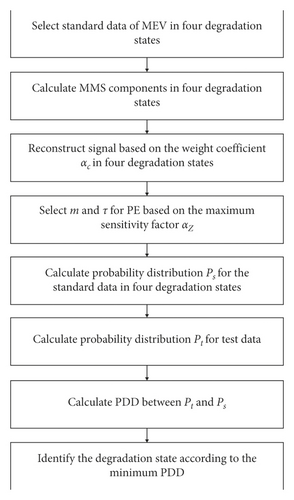
In this way, the divergence between the test data and standard data can be used to identify the degradation state. Procedures for the degradation state identification based on PDD analysis are detailed in the following.
Step 1. Select standard degradation data in normal state, slight degradation, severe degradation, and failure state. Calculate the probability distributions of MMS-PE in four degradation states, which are recorded as Ps_normal, Ps_slight, Ps_severe, and Ps_failure.
The probability distributions of standard data Ps = {psi | i = 1, 2, …, k} can be obtained by the mean of the column in the above matrix, where .
Step 2. Calculate the divergence between Pt and Ps in each degradation state according to Equation (15):
Step 3. The state corresponding to the minimum PDD is seen as the result of degradation state identification.
The whole flowchart of identification is concluded as Figure 1.
5. Experimental Results
5.1. Data Sampling
The data sampling was carried out on the ultrasonic motor testbed, which is shown in Figure 2.
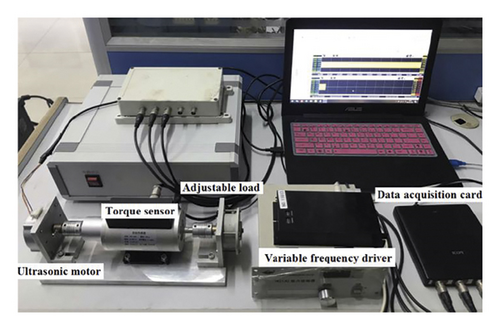
The tested ultrasonic motor is TRUM-60-P. Its maximum torque is 0.6 N·m, and no load speed is 120 rp min−1. The speed is controlled by a variable frequency driver. The signal frequency generated from the sensor part of the stator is 40.65 kHz, and it is sampled and stored by the Handyscope HS4 data acquisition card of TiePie engineering. The sampling frequency is set to be 500 kHz, and the sampling time of each group data is 2 s.
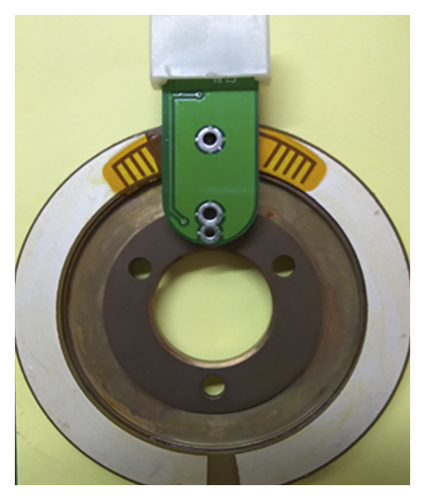
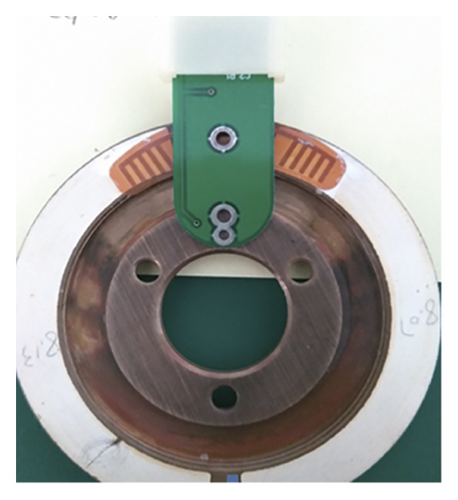
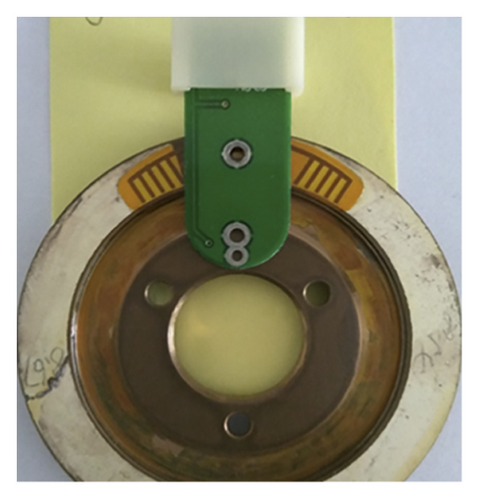
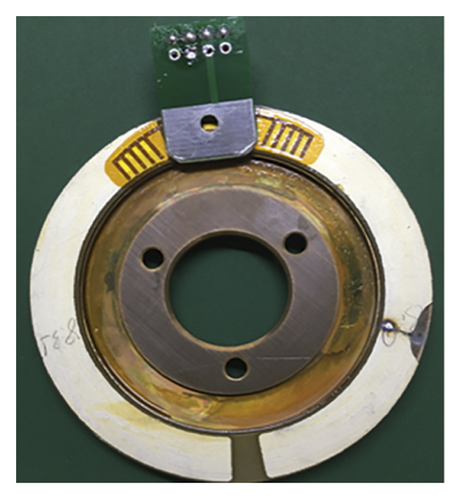
The piezoelectric ceramics of four degradation states are shown in Figure 3.
- (1)
Normal state: intact.
- (2)
Slight degradation: the average width of the crack is 0.2 mm, and the length is 7.6 mm.
- (3)
Severe degradation: the average width of the crack is 0.7 mm, and the length is 8.7 mm.
- (4)
Failure state: the average width of the central crack is 0.4 mm, and the length is 2.3 mm. In addition, there are defects (12.2 mm2) and pitting corrosion (4.1 mm2) located on both sides of the crack, respectively.
There are 80 groups of data that were collected in each degradation state, in which 10 groups of data noted as D1 will be used as standard data for verifying the rationality and feasibility of MMS-PE, 30 groups of data noted as D2 will be used for parameter optimization of PE, and the remaining 40 group of data noted as D3 will be used as the test data for degradation state identification. The waveform of one group of standard data selected from D1 is shown in Figure 4.
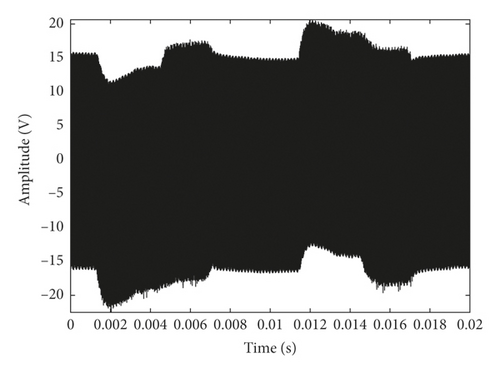
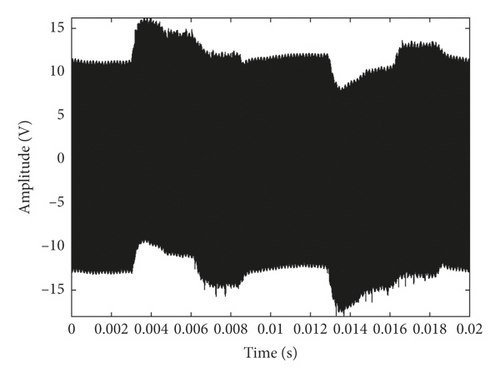
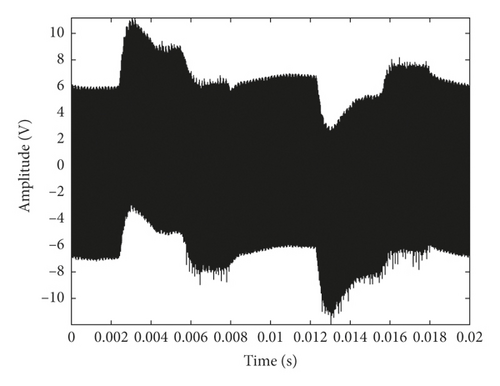
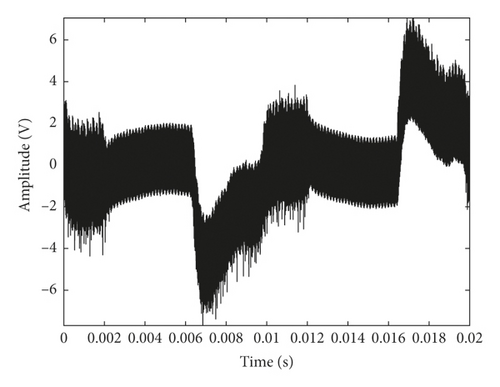
From Figure 4, we can easily notice that the amplitude of the signal is gradually decreasing with the development of degradation, and the changes of the signals also become more and more violent. However, in fact, as the motor load increases, the amplitude of MEV will also decrease correspondingly. So the complexity of the signal, in stead of the amplitude, is suitable to be adopted as the analysis object for fault feature extraction of piezoelectric ceramics in this paper.
5.2. Signal Reconstruction Based on MMS Components
The flat structure element g = [0, 0, 0] is used for multiscale morphological analysis. Take a group of standard data selected from D1 as an example, and the MMS components in four degradation states are shown in Figure 5. The sixth and subsequent components are close to 0, so there are only five components (0.02 s) given in Figure 5 due to limitation of the paper space.
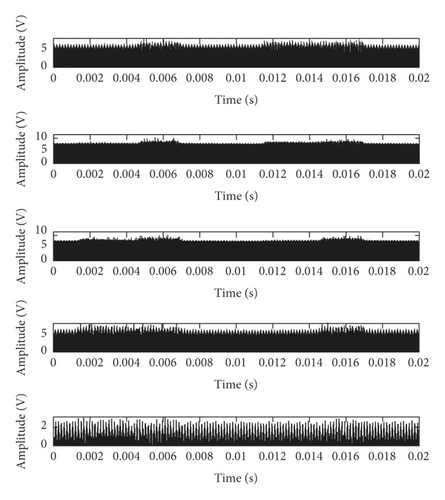
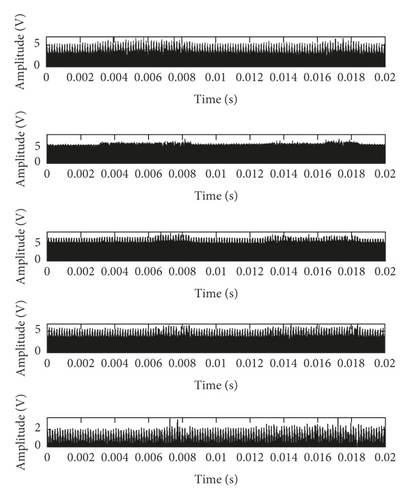
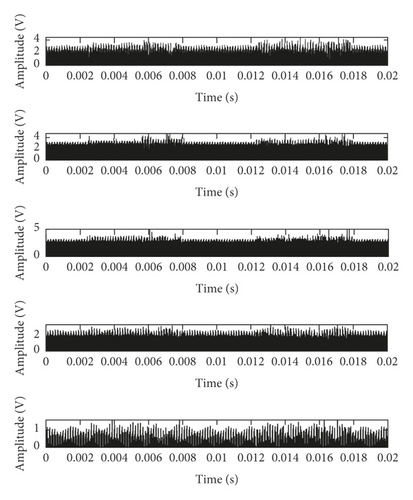
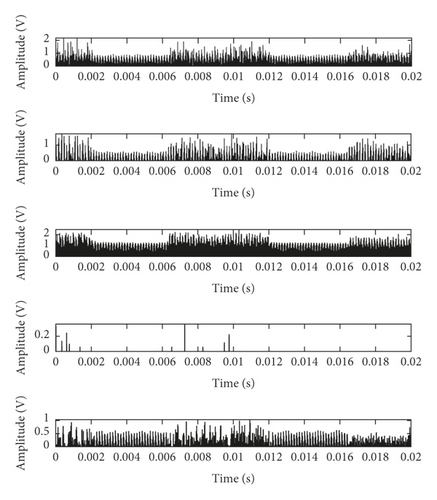
The RMS statistics of the MMS components are shown in Table 1.
| Layer 1 | Layer 2 | Layer 3 | Layer 4 | Layer 5 | |
|---|---|---|---|---|---|
| Normal state | 3.27 V | 5.36 V | 6.29 V | 5.19 V | 1.52 V |
| Slight degradation | 2.30 V | 4.21 V | 4.92 V | 4.02 V | 1.35 V |
| Severe degradation | 1.43 V | 2.05 V | 2.36 V | 2.02 V | 0.67 V |
| Failure state | 0.43 V | 0.34 V | 0.93 V | 0.02 V | 0.30 V |
The waveform of the reconstructed signal in Equation (9) based on weight coefficient αc is shown in Figure 6.

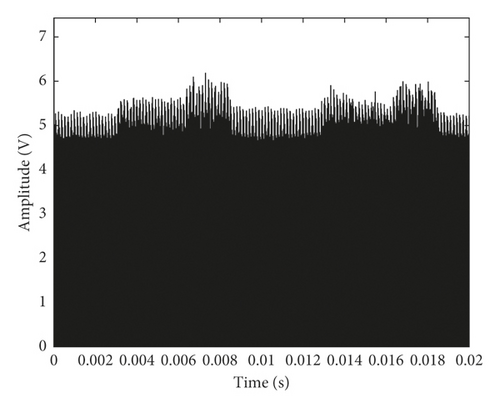
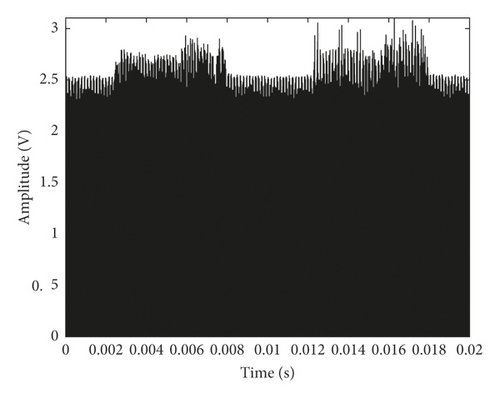
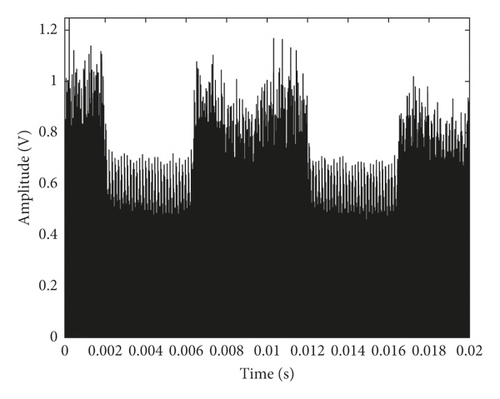
From Figure 6, it can be seen that the waveform retains the morphological features in different degradation states. However, in order to describe the fault feature quantitatively for degradation state identification, MMS-PE should be calculated based on this waveform information in the following discussion.
5.3. Fault Feature Extraction
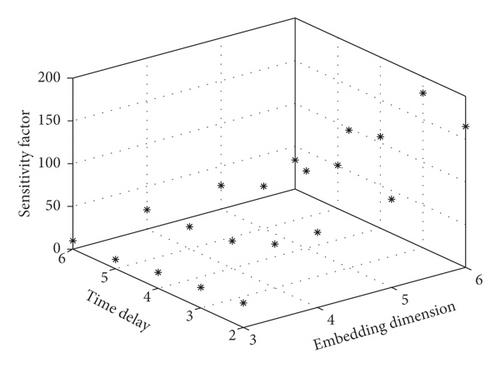
In consideration of computation and the loss of wave information, the values of embedding dimension m and time delay τ need to be limited to a certain range in MMS-PE calculation. In this paper, the selection of above two parameters will be discussed in the integer range where m is from 3 to 6 and τ is from 2 to 6. Among the 80 groups of data in each degradation state, there are 30 groups of data noted as D2, which will be used for parameter optimization of MMS-PE. After the reconstructed signals of D2 were obtained via MMS components, the sensitivity factor of the normalized MMS-PE according to Equation (13) is shown in Figure 7 and Table 2.
| τ = 2 | τ = 3 | τ = 4 | τ = 5 | τ = 6 | |
|---|---|---|---|---|---|
| m = 3 | 28.70 | 23.98 | 18.66 | 10.86 | 9.84 |
| m = 4 | 87.85 | 51.20 | 31.91 | 25.71 | 22.67 |
| m = 5 | 103.07 | 160.89 | 90.36 | 49.55 | 27.54 |
| m = 6 | 164.72 | 180.80 | 107.02 | 50.64 | 33.88 |
According to the above statistical results, the sensitivity factor reaches the peak 180.80 as m = 6 and τ = 3.
The results of above three cases are shown in Figure 8.
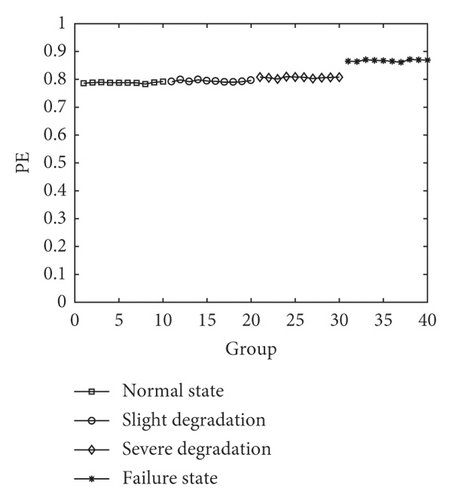
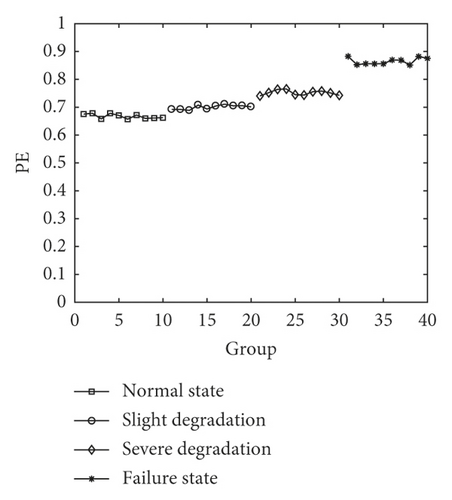
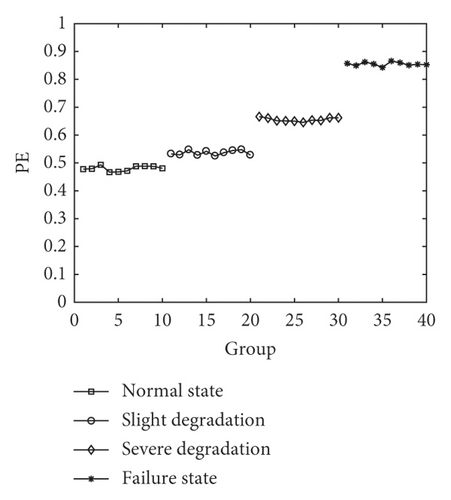
From Figure 8, we can conclude that the distinction between adjacent states is more and more obvious with the increase of factor. In Figure 8(a), dimension (m = 3) limits the numerical accuracy of PE so that the MMS-PE values in the first three states almost coincide. In Figure 8(b), it can be seen that the result reflects only a slight uptrend as the fault degradation, and it presents a strained distinction from the normal state to severe degradation. There seems to be not enough space for the subsequent degradation state identification. Figure 8(c) reflects a clear uptrend of the MMS-PE value with the degradation of piezoelectric ceramics, and it shows a better discrimination especially from the normal state to severe degradation. Therefore, m = 6 and τ = 3 is regarded as the parameter optimization result in this paper.
In order to explain the necessity of signal reconstruction based on MMS components, the normalized PE (m = 6 and τ = 3) results of the original standard data are given as Figure 9.
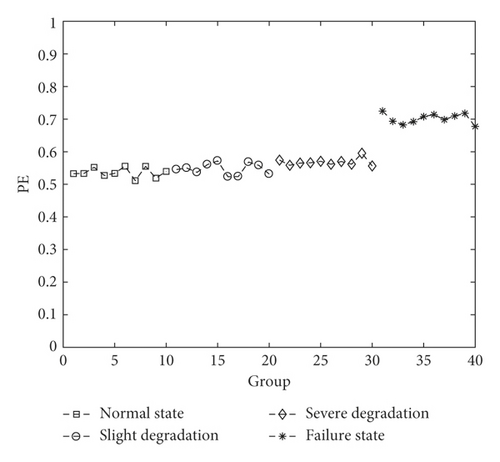
Compared with Figure 8(c), the PE result of the first three states in Figure 9 has no obvious monotonous trend, and the amplitudes of these points too close to be distinguished. The main reason is that the complexity of the original signal is similar. In fact, such a result coincides with the waveform information in Figure 4. In addition, the value of the failure state is obviously bigger than the ones of the first three states, while the waveform of the failure state is obviously more violent than the ones of the first three states in Figure 4. And it also an explanation that PE does have the ability to reflect the complexity of the signal.
5.4. Comparison with the Other Methods
Recently, the local characteristic-scale decomposition (LCD) as a new adaptive time-frequency analysis method based on intrinsic time-scale decomposition was proposed by Yang et al. [28]. LCD method has been applied for the fault feature extraction of the hydraulic pump and bearing successfully [29, 30]. In order to further validate the performance of the proposed method in this paper, the LCD method is adopted to extract the fault feature of piezoelectric ceramics in the ultrasonic motor for the following comparative analysis.
The LCD energy entropy calculation results of the original signal and reconstructed signal based on MMS components are both given in Figure 10.
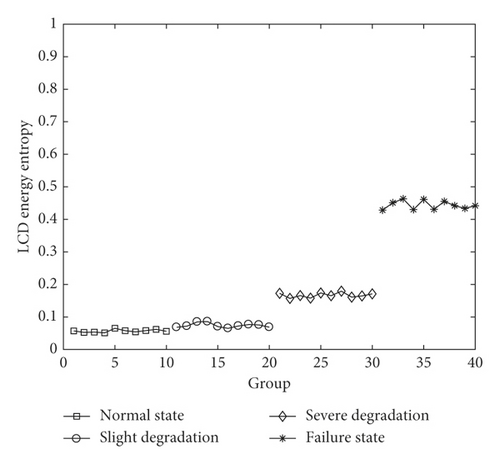
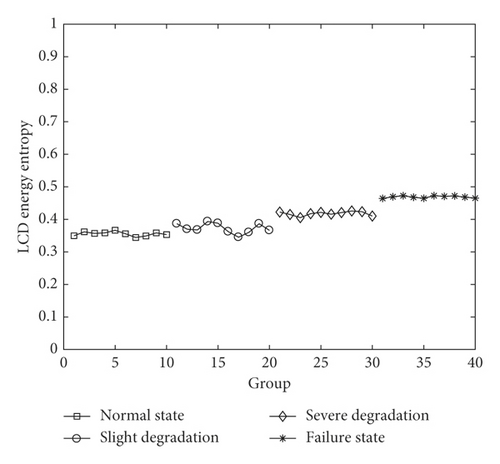
According to Equation (18), the more homogeneous the energy of ISCs, the greater the entropy. Figure 10 presents a reasonable trend that the LCD energy entropy increases with the fault degradation. The main reason is that, as the piezoelectric ceramics is intact, the MEV signal is caused by sinusoidal vibration via the sinusoidal driving signal, and the energy is mainly concentrated on a few ISCs, so the entropy is small. Once the crack appears, the complexity of the signal will increase. The energy of the signal disperses to some other ISCs, and the energy entropy will also increase. However, normal state and slight degradation cannot be distinguished in Figure 10(a), and the entropy difference between adjacent states is too small to be applied for the degradation identification in Figure 10(b). On comparing Figures 10(b) with 8(c), the effect based on LCD energy entropy seems not as outstanding as the proposed method.
5.5. Application on Degradation State Identification via PDD Analysis
The average probability distributions of 10 groups of standard data can be noted as Ps = {psi | i = 1, 2, …, 720}, where . Then, we can obtain the four standard probability distributions corresponding to four degradation states, which are recorded as Ps_normal, Ps_slight, Ps_severe, and Ps_failure. According to Equation (15), PDD between test data and standard data of four degradation states can be calculated, and the result of state identification is the degradation state whose PDD is the smallest. In this way, we can determine whether the identification results are consistent with the actual state so as to verify the validity of the method.
In total, there are 160 groups of data in D3 which is used as the test data for degradation state identification. The test data in D3 are numbered as follows: 0–40 groups are normal state data, 41–80 groups are slight degradation data, 81–120 groups are severe degradation data, and 121–160 groups are failure state data. Limited by the paper space, only the first 5 groups of test data’s PDD statistics in each degradation state are given in Table 3.
| Group number | PDD to normal state | PDD to slight degradation | PDD to severe degradation | PDD to failure state | Identification results | Judgement |
|---|---|---|---|---|---|---|
| 1 | 0.0744 | 0.1573 | 0.3542 | 0.6758 | Normal state | Right |
| 2 | 0.0687 | 0.1128 | 0.4031 | 0.6743 | Normal state | Right |
| 3 | 0.0956 | 0.1254 | 0.3755 | 0.6392 | Normal state | Right |
| 4 | 0.0842 | 0.1363 | 0.3687 | 0.6654 | Normal state | Right |
| 5 | 0.0659 | 0.1124 | 0.3255 | 0.6171 | Normal state | Right |
| 41 | 0.1706 | 0.0990 | 0.2498 | 0.5751 | Slight degradation | Right |
| 42 | 0.1032 | 0.0776 | 0.2960 | 0.5255 | Slight degradation | Right |
| 43 | 0.1277 | 0.0619 | 0.2342 | 0.5506 | Slight degradation | Right |
| 44 | 0.1046 | 0.1155 | 0.2585 | 0.5699 | Normal state | Wrong |
| 45 | 0.1197 | 0.0463 | 0.2224 | 0.5861 | Slight degradation | Right |
| 81 | 0.3052 | 0.2650 | 0.1047 | 0.3786 | Severe degradation | Right |
| 82 | 0.3531 | 0.2497 | 0.0639 | 0.4257 | Severe degradation | Right |
| 83 | 0.3285 | 0.2651 | 0.0449 | 0.3880 | Severe degradation | Right |
| 84 | 0.3250 | 0.2661 | 0.0758 | 0.4068 | Severe degradation | Right |
| 85 | 0.3417 | 0.2873 | 0.0362 | 0.3649 | Severe degradation | Right |
| 121 | 0.6126 | 0.5602 | 0.3374 | 0.0632 | Failure state | Right |
| 122 | 0.5838 | 0.5263 | 0.3997 | 0.1069 | Failure state | Right |
| 123 | 0.6296 | 0.5654 | 0.3511 | 0.0962 | Failure state | Right |
| 124 | 0.5378 | 0.4982 | 0.3729 | 0.0512 | Failure state | Right |
| 125 | 0.5743 | 0.5148 | 0.3364 | 0.0837 | Failure state | Right |
The recognition results of the whole 160 groups of test data are shown in Figure 11.
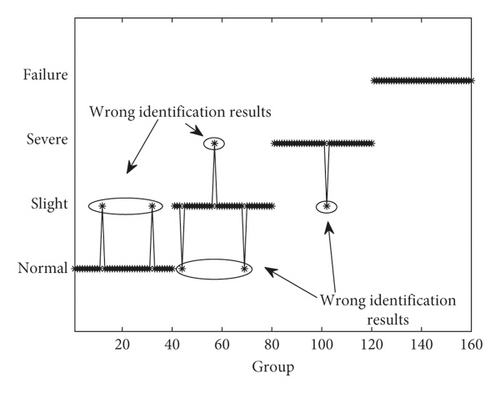
In the whole 160 groups of test data, there are only 6 wrong identification results, and that is to say, the accuracy rate is as high as 96.25%. In addition, the identification results of failure state test data (141–160) in Figure 11 are completely correct, and this result shows good agreement with Figure 8(c) where the difference value of MMS-PE between failure state and the first three states is clear and large enough. The wrong identification results are mainly focused on the states between normal and slight degradation for the reason that the MMS-PE values of normal state and slight degradation are relatively similar to each other. Overall, the PDD analysis based on MMS-PE is feasible to identify the degradation states of piezoelectric ceramics in the ultrasonic motor accurately. Furthermore, proposing a more effective method to distinguish the morphological feature between normal state and slight degradation will be the main work of our future research.
6. Conclusions
- (1)
The crack of piezoelectric ceramics in the ultrasonic motor can affect the vibration of the stator. As a result, the mathematical morphology of MEV generated from the monitor part changes. MMS components of the MEV signal can be used for fault feature extraction.
- (2)
MMS-PE increases obviously with the deterioration of ceramics, and it is feasible to be taken as the fault feature of piezoelectric ceramics of the ultrasonic motor. The proposed sensitivity factor based on double sample Z value analysis can be used for parameter optimization of embedding dimension and time delay in the PE calculation to improve the discrimination of fault feature in different degradation states.
- (3)
The PDD analysis based on MMS-PE is feasible to ensure the high accuracy of degradation state identification for piezoelectric ceramics of the ultrasonic motor. It is meaningful for the condition-based maintenance of the ultrasonic motor.
Conflicts of Interest
The authors declare that there are no conflicts of interests regarding the publication of this paper.
Acknowledgments
This project was supported by National Natural Science Foundation of China (Grant no. 51877070), China Postdoctoral Science Foundation (Grant no. 2017M623404), Natural Science Youth Foundation of Hebei (Grant no. E2017208086), and Science and Technology Research Youth Foundation for Hebei College (Grant no. QN2017329).
Open Research
Data Availability
The data are confidential for the reason that it comes from military research institute.


