Analysis and Experimental Study of Acceleration Model for Short Interval and Multiple Impact Equipment
Abstract
Short interval and continuous high-impact experiments have very significant engineering application values, and impact acceleration is a key performance index of these dynamic experiments. This paper aims at the shortcomings of the existing multiple high-impact equipment, designs a new type of multiple high-impact equipment based on the collision contact mode by multiple impact components, and studies the composition of acceleration in impact experiment. The research results indicate that it is unreasonable to analyze the impact acceleration only based on rigid body dynamics theory and ignore the effect of the stress wave loading during an impact experiment. On this basis, a line contact model is adopted to modify the equivalent damping coefficient and obtain a nonlinear spring damping contact force model based on the line contact, and then a rigid body acceleration model of the impact experiment is established. A stress wave acceleration model is also established based on the one-dimensional stress wave transfer theory of the tested specimen. The established acceleration model is verified by different corresponding impact experiments. At the same time, the collision contact process of the impact experiment is also simulated which is combined with the finite element method. The simulation results were fundamentally consistent with the experiments and a fact that proves the correctness of analysis and modeling. The research results not only provide theoretical support for the design and analysis of the impact equipment and a new idea to realize multiple high-impact loading but also provide a methodology to be applied to the analysis and modeling of acceleration for similar high-impact experiments.
1. Introduction
Short interval and continuous high-impact phenomenon have existed in many occasions of production and life, such as rock drilling and engine piston motion. This repeated dynamic loading of high strain rate is the key factor for many core component damages and material fatigue failures. Previous studies have shown that, even though the impact stress is much lower than the yield limit of material, the accumulated plastic deformation will still be generated under multiple impact conditions, which leads to failure [1]. In addition, a multiple high-impact experiment is also a key step to measuring the dynamic characteristics of various metallic and nonmetallic materials. This type of experiment plays an important role in the development of new materials and new products. Therefore, multiple high-impact experiments have been receiving more and more attention from experts, scholars, and engineers.
The existing single-impact equipment such as Machete hammer and falling ball are difficult to realize short interval and multiple impact loading; the multiple impact method of vibration table is capable of obtaining only a limited impact amplitude, unable to meet the requirement of specific experiment. In view of the shortcomings of existing impact experimental methods, Nanjing University of Science and Technology has designed a new rotary impact equipment of short interval and multiple impacts that can realize continuous high-impact loading on the tested specimen. However, in the process of impact experiment, due to the complexity of the impact mechanical environment, the tested specimen not only bears the impact force but also gets affected by the stress wave loading generated by the impact [2–5]. The damage mechanism and damage effect of these two parts are different for the tested specimen, and this phenomenon also exists in impact experiments such as the Machete hammer and falling ball. Therefore, in order to study the failure mechanism and the elastic-plastic deformation law of the tested specimen under multiple impact environments intensively, it is necessary to analyze and establish the acceleration model of the impact experiment accurately, especially for the designed multiple impact equipment, and it is particularly necessary to analyze the composition of impact acceleration and provide technical support for optimization and parameter improvement of the impact equipment.
This paper studies and discusses the composition of acceleration in the impact experiment based on the designed multiple impact equipment, and it also analyzes that, during the impact process, the tested specimen not only generates a rigid body acceleration but also gets affected by the stress wave loading. On this basis, a nonlinear spring damping contact force model of line contact is established to describe the rigid body acceleration and a stress wave acceleration is established based on the one-dimensional stress wave transfer theory. On the basis of theoretical analysis, the correctness of the analysis model is verified by experiments and numerical simulations. The research results not only strongly support the design and experimental analysis of the multiple impact equipment but also provide reference for the analysis and modeling of acceleration in high overload experiments such as high-speed collision and explosion.
2. Experimental Equipment and Experimental Analysis
2.1. Experimental Equipment and Principle
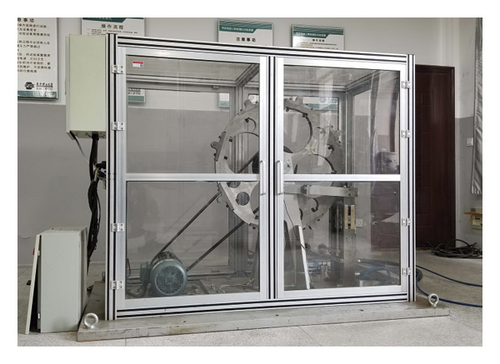
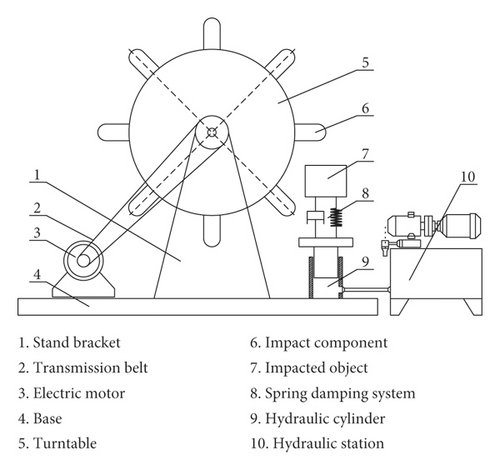
The prototype of the designed multiple impact equipment is shown in Figure 1, the principle is shown in Figure 2, and the block diagram is shown in Figure 3. The basic working principles are as follows. The core mechanism to realize multiple impacts is a massive turntable that is driven by a three-phase speed regulating motor. Multiple high-strength impact components are installed equidistantly on the circumference of the turntable, and they can obtain impact loading kinetic energy from the turntable that is driven by the motor. By controlling the motor speed, multiple impacts of different time intervals can be achieved. The tested specimen is installed in the impact fixture and integrated with the impact fixture as the entire impacted object, supported by a heavy load spring and a hydraulic mechanism to maintain at the initial position. During the experiment, the turntable speed is calculated according to the requirement of impact interval; after driving the turntable to the set speed, the impacted object is fed to the impact position by the hydraulic mechanism. A series of impact components of high rotation speed collide with the impact fixture in sequence, attaining multiple impact loading on the tested specimen. After each impact, the impacted object retreats and returns under the combination of the hydraulic mechanism and the heavy load spring, preparing for the next impact. After completing the specified number of impacts, the hydraulic mechanism is controlled back to make the entire impacted object retreat from the motion trajectory of the impact component, and then the turntable is braked, implementing a complete impact experimental process.

2.2. Impact Experiment and Analysis
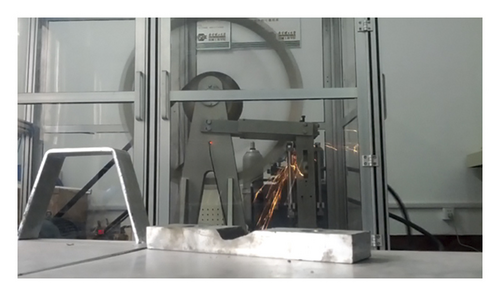
In order to accurately analyze the composition of impact acceleration of the multiple impact equipment and establish its mathematical model, we designed a comparison experiment by installing two acceleration sensors with the same parameters at the same horizontal position of the tested specimen. One sensor was installed directly, and another was installed after buffering and isolation. The outputs of the two acceleration sensors were simultaneously collected for a comparative analysis. The experimental process is shown in Figure 4. The obtained comparison curve of multiple impact acceleration is shown in Figure 5. The blue curve represents the impact acceleration obtained by direct installation, and the red curve represents the impact acceleration obtained after buffering and isolation.
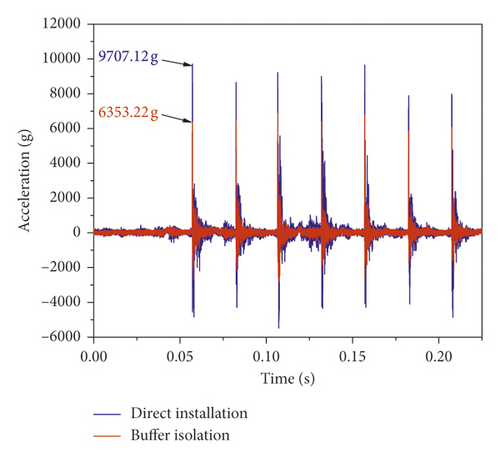
The seven pulses in the figure clearly reflect seven consecutive impacts in 150 ms, but the output of two acceleration sensors is significantly different in the numerical value. Taking the first impact pulse as an example, the peak acceleration of the directly installed sensor is 9707.12 g and has a significant pulse fluctuation. The peak acceleration after buffering and isolation is only about 6353.22 g, and the pulse fluctuation is smaller than that of the directly installed sensor.
The impact experimental process of the multiple impact equipment is analyzed based on the rigid body dynamics theory commonly used in impact experiments. In the process of transient collision contact, the entire impacted object only generates a small displacement, and the compression of the supporting spring is limited, so the elastic force can be neglected. In addition, the frictional resistance also can be neglected, and the collision contact force between the impact component and the impact fixture can be approximated as the external force of the entire impacted object. According to Newton’s second law, the entire impacted object will generate a rigid body acceleration that is inversely proportional to its mass. At this time, the two acceleration sensors in the tested specimen should have a consistent output, but the measured acceleration is quite different from this conclusion. Thus, it can be concluded that the single rigid body dynamics theory cannot accurately describe the composition of the acceleration in the impact experiment. During the impact process, not only the rigid body acceleration will be generated but also gets affected by the stress wave loading. Therefore, in order to accurately analyze the composition of the impact acceleration for the multiple impact equipment, we must take into account both the rigid body acceleration model and the stress wave acceleration model.
3. Impact Acceleration Modeling
3.1. Rigid Body Acceleration Model
According to the previous analysis, the key to solving the rigid body acceleration depends on the solution of transient collision contact force. The Hertz contact theory is a commonly used model for describing the contact force of objects. However, the Hertz contact theory is based on static or quasi-static conditions, so it cannot accurately describe the energy loss during the collision contact between the impact component and the impact fixture. In view of this problem, many experts and scholars explain the energy loss in collision contact process by introducing a damping term to the Hertz contact theory [7]. Khulief and Shabana [8] proposed the Kelvin–Voigt linear spring damping model, and Hunt and Crossley [9] improved the damping term of the Kelvin–Voigt model to nonlinear. On the basis of the Hunt–Crossley model, a series of improved models such as the Herbert–McWhannell model, the Lee–Wang model, and the Lankarani–Nikravesh model were proposed in order to adapt to different collision contact conditions. The evolution of these models lies in the development of the viscous damping factor, and its purpose is to continuously improve the accuracy of the viscous damping factor to describe the energy loss [10–14]. Currently, the Lankarani–Nikravesh model is the most widely used model in collision contact analysis, but the Lankarani–Nikravesh model fails to consider the inconsistent energy loss during the compression and recovery phases [15, 16], Flores separately calculated the energy loss in the compression phase and the recovery phase based on energy conservation and momentum conservation of the contact objects and obtained more accurate calculation results than the Lankarani–Nikravesh model [17]. However, the Flores model [18] is based on “one-dimensional direct central contact between two solid spheres,” which is only suitable for the case of a small contact area. In view of this problem, this paper modified the equivalent damping coefficient of the Flores model based on the line contact model, further establishing the collision contact model of line contact, which can describe the collision contact between the impact component and the impact fixture more accurately.
By using the above equation, the rigid body acceleration of the impact experiment can be established.
3.2. Stress Wave Acceleration Model
For the designed multiple impact equipment based on direct collision contact mode, the stress wave disturbance will inevitably be generated on the tested specimen during the dynamic impact process. In order to accurately analyze this stress wave acceleration, it is necessary to establish the stress-strain transfer model between the impact fixture and the tested specimen.
According to the connection relationship between the impact fixture and the tested specimen, a simplified model is established as shown in Figure 6. The tested specimen is installed between the upper and lower parts of the impact fixture and ensures the end face contact during the experiment. The impact component applies a vertical impact loading to the upper fixture. Assume the material and structural properties of the upper fixture are E1, A1, ρ1, and c1; the properties of the lower fixture are E2, A2, ρ2, and c2; and the properties of the tested specimen are Ee, Ae, ρe, and ce, where E denotes the elasticity modulus, A denotes the axial cross-sectional area, ρ denotes the material density, and c denotes the one-dimensional elastic stress wave velocity. Define the interface of the upper fixture and the tested specimen is interface I and the interface of the lower fixture and the tested specimen is interface II.
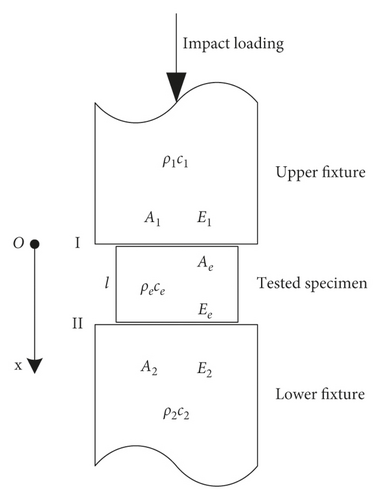
According to the stress wave transfer theory, the stress wave generated by impact loading is transmitted to interface I of the upper fixture and the tested specimen, partially transmitted into the tested specimen, partially transformed into a stretch wave, and reflected back into the upper fixture. Generally, the tested specimen will not generate a large deformation, which can be considered as an elastic deformation; for the convenience of analysis, neglect the attenuation and dispersion of the stress wave in the fixture and the tested specimen, and then the stress-strain transfer model in the tested specimen can be established based on the one-dimensional stress wave theory [24–27].
- (1)
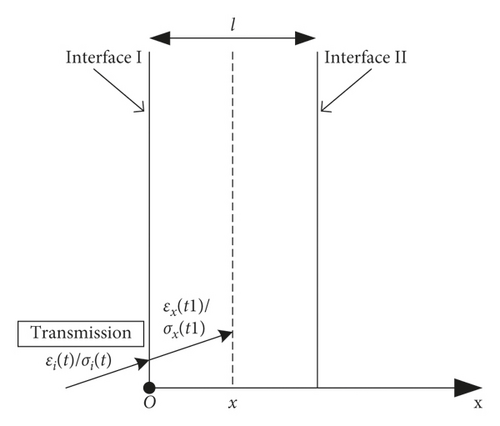
The initial transmission is shown in Figure 7(a). Assuming that the initial incident stress generated by impact loading is σi(t), when this incident stress is transmitted to any interface x of the tested specimen through interface I, the stress of interface x is
(26)where(27)where the products ρ1c1 and ρece are usually defined as the wave impedance of the upper fixture and the tested specimen, and the ratio of the wave impedance multiplied by its axial cross-sectional area is defined as nI. TI denotes the transmission coefficient of interface I. -
According to the stress-strain relationship σ = Eε, rewriting equation (26) in the form of strain, the initial transmitted strain at any interface x of the tested specimen is
(28) -
Defining γ = (E1/Ee)(2/(1 + nI))(A1/Ae), then the above equation can be simplified as
(29) -
In the current transfer process, the initial transmitted strain εx(t1) is the total strain of the tested specimen.
- (2)
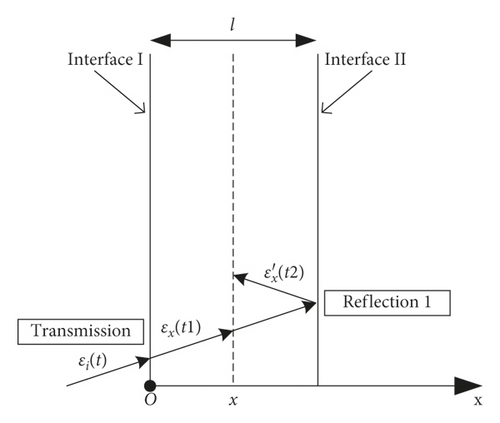
The first reflection is shown in Figure 7(b). According to the basic transfer theory of stress waves, when the transmitted stress wave εx(t1) arrives at interface II of the lower fixture and the tested specimen, also partially transmitted into the lower fixture, and partially reflected back into the tested specimen, this reflection strain can be expressed as
(30)where(31)where the products ρ2c2 and ρece are usually defined as the wave impedance of the lower fixture and the tested specimen, the ratio of the wave impedance multiplied by its axial cross-sectional area is defined as nII. FII denotes the reflection coefficient of interface II. -
Considering the continuous incidence of stress waves in the process of collision contact, at this time, the total strain εx(t2) at any interface x of the tested specimen is the superposition of initial transmitted strain εx(t1) and the above reflected strain . According to the linear superposition condition, the total strain at any interface x of the tested specimen in this process is
(32) - (3)
The second reflection is shown in Figure 7(c). Similarly, when the above reflected strain arrives at interface I again through the tested specimen, also partially transmitted into the upper fixture and partially reflected back into the tested specimen, this time the strain reflected back into the tested specimen can be expressed as
(33)where −1 is the change of reflection coefficient when the transfer direction of the stress wave changes.
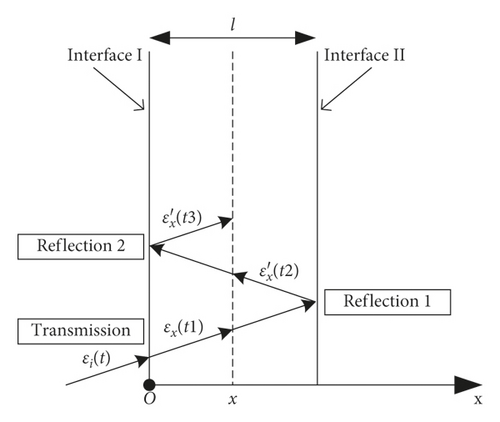

It can be seen from the above equation that the stress wave acceleration of the tested specimen depends on the number of transfer times k. Because the axial length l of the tested specimen is fixed, therefore, as long as we know the waveform and the duration of the incident stress wave, the stress wave acceleration of the tested specimen can be calculated by using the above equation. It should be noted that, according to the research result of Ravichandran [28], the stress wave usually needs to be reflected 3 to 5 times to realize the stress uniformity in the tested specimen; therefore, the duration of the incident stress wave should be at least guaranteed to t > (3∼5)t0.
4. Experimental and Simulation Verification
In order to effectively verify the established impact acceleration model, an experimental study was carried out based on the designed multiple impact equipment, combined with the ANSYS/LS-DYNA nonlinear dynamics simulation software; the nonlinear collision contact force and the stress-strain distribution of the tested specimen during the impact process were analyzed. Then, the rigid body acceleration and the stress wave acceleration of the tested specimen were obtained and compared with the experimental results for verification.
4.1. Rigid Body Acceleration Verification
In the model analysis, we describe the rigid body acceleration of the tested specimen by using collision contact force. However, due to the high dynamic characteristics of collision contact process, the collision contact force and the contact time are usually difficult to be measured directly, but we can indirectly obtain this collision contact force by measuring the effective filtered acceleration. In order to minimize the interference of the stress wave on the measurement of rigid body acceleration, and also convenience for the observation of experimental process, we designed a frame impact fixture and a cylindrical shell experimental fixture that matched with the impact fixture; the assembly relationship is shown in Figure 8.
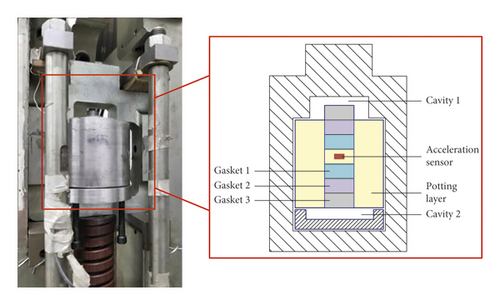
The cylindrical shell experimental fixture is clamped in the impact fixture. A cavity is designed at its upper end to ensure that the experimental fixture is kept in contact with the impact fixture only at the edge of the shell. The bottom of the experimental fixture is installed with the impact fixture through a concave base, to make sure the experimental fixture and the concave base are also only in contact at the edge of the shell. A high-g acceleration sensor is installed in the center of the experimental fixture and buffered and isolated by multiple layers of different wave impedance gaskets. Through the combination of cavity design in structure and mechanical filtering, the stress and strain transmitted into the acceleration sensor are minimized. At this time, it can be approximately considered that the acceleration measured by the acceleration sensor is the rigid body acceleration generated by the collision contact force. In addition, in order to better avoid the introduction of external interference signals, a built-in storage scheme is adopted in the experiment. The signal acquisition circuit and the power supply are directly potted in the experimental fixture, which is not shown in the figure.
A multiple impact experiment was carried out based on the designed experimental fixture, the turntable was speed up to 730 r/min, and the hydraulic mechanism is controlled to feed the impacted object to impact position; then the multiple impact experiment was started. A synchronous trigger signal acquisition circuit was used to acquire the impact acceleration based on the start signal of the hydraulic mechanism solenoid valve. The original output curve obtained by the acceleration sensor is shown in Figure 9.

The 11 pulses in Figure 9 clearly reflect 11 continuous impact processes. However, during the experiment, due to the impact loading cycle is not well matched to the natural motion cycle of the spring damping retreat and return system and it is also affected by the collision, friction, and other factors of the motion mechanism in actual impact process, this causes a certain difference in actual position and motion state of the impacted object for each impact, which leads to an inconsistent in each rigid body acceleration, and these effects need to be improved in subsequent designs and experiments, but the peak values and the pulse widths of multiple rigid body accelerations have no significant differences. It can be seen from the figure that the peak value of the rigid body acceleration is usually about 4000 g and the pulse width is about 200 μs.
In order to observe the time process of the collision contact more intuitively, a numerical simulation model of the impact experiment is established to assist the analysis of the impact process. The finite element method based on ANSYS/LS-DYNA is an effective method used for dynamic impact process analysis, which is widely used in solving practical engineering problems. Accurate calculation results can be obtained by accurate modeling and reasonable parameter settings. The continuous impact process of the multiple impact equipment can be regarded as the repetition of a single impact loading, which can be calculated repeatedly by restarting or remodeling, but in actual impact process, affected by collision, friction, and other factors of the motion mechanism, it is usually difficult to obtain the actual motion state of the impacted object after each impact; therefore, the initial simulation conditions of each impact process cannot be accurately obtained, so we only analyze the first impact process in the simulation. In order to accurately simulate the collision contact process between the impact component and the impact fixture, a proportional 3D model is established in SolidWorks according to the actual size of the multiple impact equipment; at the same time, only the impact component and the entire impacted object are modeled to simplify the calculation, simplify the fine structure of the impact component and the impacted object that does not affect the simulation results, remove the minor features such as threaded holes and fillets, and then imported into HyperMesh for further processing.
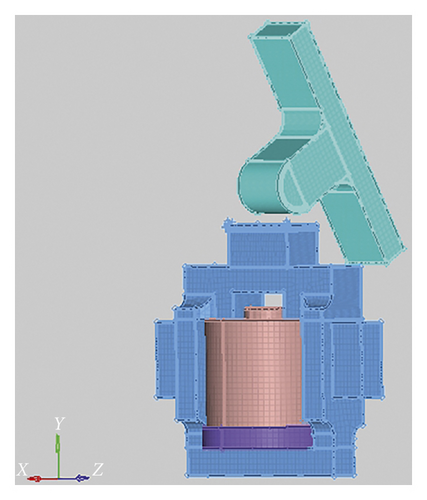
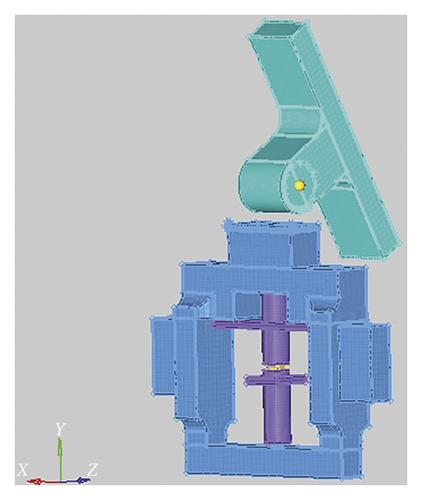
The established finite element model is shown in Figure 10, and the basic unit of the model is mm-g-μs. Since the impact component and the impacted object are both solid objects, and without a large deformation in the process of the collision contact, the hexahedral element Solid164 can be used for mesh division, and the mesh of the contact area between the impact component and the impact fixture is refined to improve the calculation accuracy. The minimum mesh size is 0.5 mm. The materials and parameters of the simulation model are set according to the actual equipment, in which the material of the impact component and the impact fixture is 65 Mn, and this is a kind of spring steel which meets the national standard GB/T 1222-2007, of high hardness and good toughness, commonly used in high wear resistance occasions such as principal spindles of the grinding machine and the rail. Due to the high impact velocity of the experiment, there are both elastic deformation and slight plastic deformation in the process of the actual collision contact; therefore, the material model of the impact component and the impact fixture is defined as the bilinear isotropic material model. The material of cylindrical shell experimental fixture is 2A12 Al, because the experimental fixture is tightly installed with the impact fixture and does not bear the direct impact, almost without any plastic deformation, so an isotropic linear elastic material model can be used. The basic material property parameters is shown in Table 1.
| Material | Density (kg/m3) | Elasticity modulus (GPa) | Poisson’s ratio | Yield strength (MPa) |
|---|---|---|---|---|
| 65 Mn | 7820 | 211 | 0.288 | 430 |
| 2A12 Al | 2780 | 72 | 0.33 | 345 |
In order to ensure the correct contact between the impact component and the impact fixture, automatic surface to surface contact is defined between the impact component and impact fixture, also the impact fixture and experimental fixture. In the process of impact collision contact, for the impacted object, due to the limit of feeding rail in structural design, only the inertial motion along the impact loading direction is produced after the impact; therefore, the rotational freedom and the translational freedom in other two directions can be restrained, and only the translational freedom along the direction of impact loading is retained. For the impact component which mounted on the turntable, due to structural constraints, its main motion is also along the impact loading direction in the process of impact, so the rotational freedom and the translational freedom in other two directions are also restrained, and only the translational freedom along the direction of impact loading is retained. In order to ensure the accuracy of the simulation results, the surface and the bottom of the impacted object are set as no reflection boundary, to eliminate the influence of boundary reflection wave on calculation results; at the same time, considering the effect of gravity acceleration, the vertical downward gravity acceleration is set to 9.8 m/s2 for the entire finite element model. Configure the calculation time as 1 ms, output a result file every 1 μs, and then submit to LS-DYNA for solution.
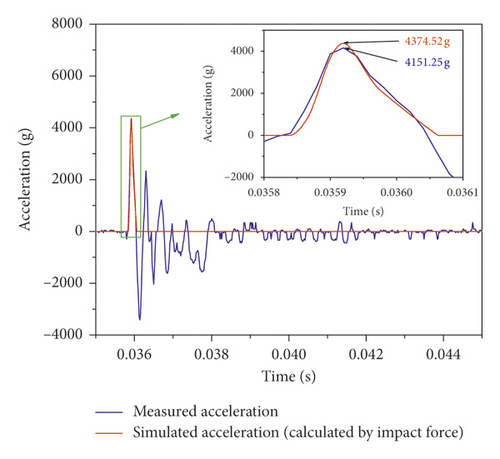
The collision contact force time curve of the first impact process between the impact component and the impact fixture is obtained by simulation, and then the rigid body acceleration of the impacted object can be calculated according to Newton’s second law and compared with the first impact acceleration curve measured by using the acceleration sensor, as shown in Figure 11. In the figure, the blue curve is rigid body acceleration measured by the acceleration sensor, and the red curve is rigid body acceleration calculated by the collision contact force in the simulation. It can be seen from the figure that the measured peak value of the rigid body acceleration is 4151.25 g, and the pulse width is 200 μs. The numerical calculated peak value of the rigid body acceleration is 4374.52 g (corresponding collision contact force 19685.34 N), and the pulse width is 220 μs, as the simulation is based on ideal conditions, but the actual impact process is usually affected by collision, friction, and other factors, which will result in the measured peak value being lower than the simulation result, and also a deviation in curve shape, but the two curves still have good consistency, which proves that the measured acceleration essentially reflects the rigid body acceleration generated by the actual collision contact force. It can also be seen from the figure that the collision contact process between the impact component and the impact fixture is not a complete elastic collision. At the beginning of the collision contact process, the impact component and the impact fixture are in elastic deformation phase, and the slope of the pulse curve is small; after a period of time, the impact component and the impact fixture enter into the plastic deformation phase and the slope of the pulse curve grows quickly. The simulation curve reflects this change process well, but the measured curve only reflects the change trend due to the limited sampling frequency of the built-in storage scheme, and there are also distortions in the waveform.
4.2. Stress Wave Acceleration Verification
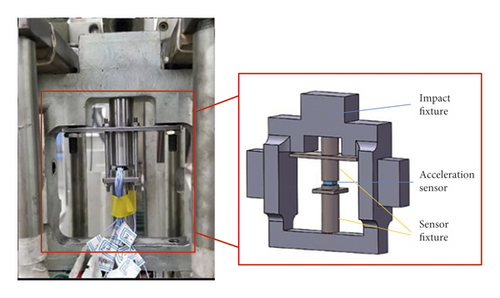
According to the above analysis, the output of acceleration sensor in the impact experiment is usually superimposed with a high amplitude acceleration generated by the stress-strain, and this stress wave acceleration can be obtained by measuring the incident and reflected strain in theory, but in practice, due to the limited length of the impact fixture, the measurement result of the stress-strain is not ideal. In this case, we improve the experimental design, indirectly analyzing this acceleration generated by the stress-strain based on acceleration sensor. In order to ensure the consistency of the collision contact model, the frame impact fixture in the above experiment is still used, but different from the above experiment that, in order to effectively introduce the stress wave generated by the impact loading, a sensor fixture is designed to match with the frame impact fixture, as shown in Figure 12. The sensor fixture is mainly composed of upper and lower cylinders of equal length. The material is the same as the impact fixture, according to the one-dimensional stress wave transfer theory, when the dielectric impedance matches, the stress wave can completely pass through the interface without reflection, thus the transfer continuity of the impact stress wave can be ensured. The sensor fixture is installed on the impact fixture through the bolt, and the contact surface is polished to ensure a good contact during the impact experiment. The acceleration sensor is installed between the upper and lower cylinders, limiting its displacement by the designed conformal groove on the contact face. Through the above designs, ensure that the stress-strain generated by the impact loading can be transmitted into the acceleration sensor as far as possible. At this time, the acceleration sensor can be equivalent to the tested specimen of the analysis model.
The turntable was speed up to 730 r/min, and then a multiple impact experiment was carried out. In order to obtain a higher sampling frequency, the output of the acceleration sensor was directly introduced to the oscilloscope, and also the start signal of the hydraulic mechanism solenoid valve was introduced to trigger the signal acquisition. The original output curve obtained by the acceleration sensor is shown in Figure 13.
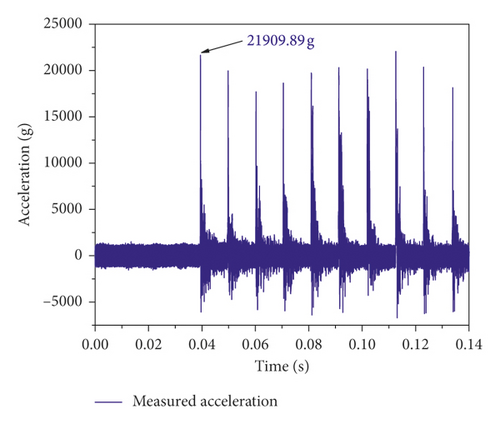
Compared with the previous experiment, due to the transmission and superposition of the impact stress-strain, the acceleration sensor is superimposed with a high amplitude disturbance, leading to a significant increase of the measured acceleration amplitude. The peak value of the first impact acceleration is 21909.89 g, which is about 4 times of the value from the previous experiment, the impact pulse width is 252 μs, the oscillation of the waveform is more obvious, and the consistency of the multiple impact pulses is even worse. It can also be seen from the figure that the inconsistent impact state caused by the collision and friction brings more effect on the stress wave acceleration.
A simplified simulation model is established that refers to the above research, as shown in Figure 14; in order to ensure the continuity of stress wave transmission, the material of the impact component, the impact fixture, and the sensor fixture are selected as 65 Mn, and the material of acceleration sensor is selected as 45 Steel; the material property parameters is shown in Table 2. A bilinear isotropic material model is still used for the impact component, the impact fixture, and the sensor fixture; the acceleration sensor which do not directly subject to impact loading can be adapted to the isotropic linear elastic material model. Note that, in order to effectively introduce the effect of stress waves, no reflection boundary should be set. Also only the first impact process is analyzed, and the simulation conditions are set according to experimental parameters.
| Material | Density (kg/m3) | Elasticity modulus (GPa) | Poisson’s ratio | Yield strength (MPa) |
|---|---|---|---|---|
| 65 Mn | 7820 | 211 | 0.288 | 430 |
| 45 steel | 7850 | 210 | 0.31 | 355 |
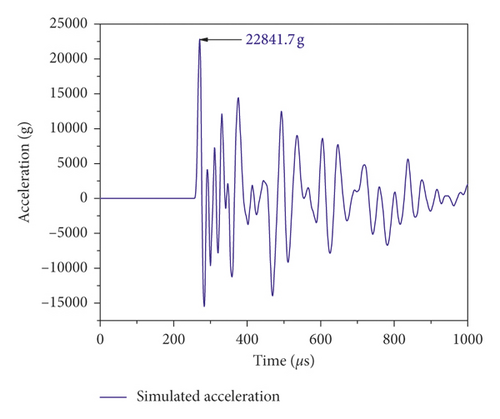
The simulated average stress wave acceleration curve of the tested specimen for the first impact is shown in Figure 15. The peak value of the simulated acceleration is 22841.7 g, essentially consistent with the experimental result. Thus, it can be concluded that, due to the transmission and superposition of the stress-strain generated by impact loading, the obtained peak value is significantly increased, verifying the correctness of the analysis model. It can be further obtained from the research conclusion that, when measuring the impact experiment based on the acceleration sensor, if the acceleration sensor cannot be effectively buffered or filtered, the result of the rigid body dynamics measurement is inaccurate; due to the superposition of the stress wave, the measurement result is much higher than the actual result.
5. Conclusion
In this paper, based on the designed multiple impact equipment, the composition of acceleration in the impact experiment is verified by theoretical analysis, simulation, and experiment, which provide theoretical support for the design and analysis of the impact equipment and expand the existing multiple high impact experimental method. Furthermore, it can be concluded that it is unreasonable to neglect the effect of stress wave and only analyze the acceleration of the impact experiment based on the single rigid body dynamics theory. This research conclusion is also applicable to the analysis of impact acceleration based on the rigid body collision contact mode, such as the Machete hammer and the falling ball; this conclusion can be further extended to high impact experiments such as penetration and explosion, and the output of high-g acceleration sensor is also affected by the stress wave loading, which will affect the experimental result measurements, such as impact force and rigid body motion trajectory. Therefore, in the impact experiment and data analysis, it is necessary to pay attention to both the rigid body dynamics theory and the stress wave theory; thus, the research has a theoretical significance and a practical engineering value.
Conflicts of Interest
The authors declare that they have no conflicts of interest.
Acknowledgments
This research was supported by the Pre Research Project of General Armaments Department (Project number: 41419070201), the Postgraduate Research & Practice Innovation Program of Jiangsu Province (Project number: KYLX16_0420, KYCX18_0388), and the Key Basic Research Projects of Basic Strengthening Plan (Project number: 2017-JCJQ-ZD-004), and the support is gratefully acknowledged.
Open Research
Data Availability
All the data used to support the findings of this study are available from the first author upon request.


