Critical Distance of the Seismic Waves’ Impact in Disintegration of Rock Blasting
Abstract
The presented paper deals with attenuation of seismic waves, which depends on the degree of disintegration of the rock environment in which seismic waves are propagated due to the explosion of explosive charges during blasting operations. Measurements of the impact of seismic waves were conducted to determine the best possible way to absorb these waves. The aim of the article is to identify the existence of a critical distance and the determination of the critical point from which the propagation of the velocity is not dependent on the type of deposit and the environment in which the seismic wave propagates. Statistical methods were used for these findings. The result is the determination of the distance of 80 m in which the speed on the individual deposits varied. From this limit on, there was no significant difference in the speed of propagation on the individual deposits.
1. Introduction
Blasting operations have and always had a crucial role in human life. Depending on the conditions and the disintegration parameters, these operations may exceed the acceptable, safe limits, when they become harmful and can cause great damage. Increasing the weight of explosive charges increases the intensity of seismic waves. These waves propagate in the rock environment and gradually vibrate each part of the surrounding area. If the vibration intensity is large enough, the environment may be impaired or may be destroyed as discussed elsewhere [1–4].
Identifying these harmful effects and determining the seismic safety is nowadays a very current issue [5, 6]. It is necessary to find a convenient method of assessment, which not only secures the safety of the object integrity but also determines the most effective blasting operations technology on the other hand [7]. Impact assessment of seismic effects caused by blasting operations depends on the distance and blasting of the objects and the size of the load in the individual timing stages used in blasting [8]. To determine the size limit load and the minimum distance, it is necessary to establish the attenuation characteristics of seismic waves in the assessed area [9–11]. Technically unjustified high-seismic safety leads to the reduction of charges and blasts, which has an adverse effect on the economy of rock disintegration and mining. On the contrary, the underestimation of seismic effects can cause great material damage [12, 13].
Different empirically derived relationships for parameters, such as particle velocity (peak particle velocity: PPV) and peak particle displacement (PPD), are commonly used to estimate the amount of charge for blasting operations. The level of vibration with distance depends on the burden for the delay of charges, the frequency of vibration, characteristics of rocks (type, unit weight, layering, and inclination layers), the conditions of the explosion, the presence of water, the dissemination of surface and underground waves in the environment, and to a lesser extent on the method of initiation. The rock breakdown occurs due to tensile and shear stress [5, 14].
Neither of these relationships is able to consider the variations in the parameters of the rock and the uncertainty of conditions in situ. Therefore, various authors come with their deposit-specific calculation models or generalized computational models that still have a high degree of uncertainty. In this paper, we have therefore focused on the statistical evaluation of the dependence of velocity components (vx, vy, vz), vmax (PPV) vs. distance (L) and reduced distance (LR).
The aim of the submitted paper is to identify distances where maximum impact operations occur based on the effect of seismic waves on the rock mass, and the determination of the so-called critical distance from which the propagation of vibrations is independent of the charge, transmission environment, etc.
2. Materials and Methods
This relation, also referred to as the law of attenuation of seismic waves, can be very well defined. However, due to complex geological conditions, it can have a very low correlation [14, 18]. In order to construct the law of attenuation of seismic waves, it is necessary to use not only the recording of the vibrational manifestation as a whole but also the individual parts of the record corresponding to the individual time frames. The standards define information values of the seismic wave propagation of the constant K depending on the distance from the blast point, for subsoil from rock and semirock and other rock masses, excluding rock masses with groundwater in subsoil.
For the measurement of seismic effects were used four channel digital seismographs, Vibraloc ABEM from the Swedish company ABEM and VMS 2000 MP from the American company Thomas Instruments Inc., (Geospace). We also used digital seismograph UVS 1504 from the Swedish company Nitro Consult. Seismographs provide digital and graphic record of the three components of velocity in given environment, horizontal longitudinal: vx, horizontal lateral: vy, and vertical: vz. Seismographs ABEM Vibraloc, VMS 2000 MP, and 1504 UVS operate autonomously and automatically run the test of the channels without an operator intervention and influence in the measured and registered vibration characteristics. The geophones were placed on a special mount with steel sharp points that provide continuous contact with the concrete base.
Measurements of the velocities of seismic waves have been realized in 8 quarries in different rock environments. Due to the subsequent data comparison, we present results of measurements, which were realized in surface quarries Včeláre, Maglovec, Lietavská Lúčka, Brekov, Podhradie, Dargov, Kučín, and Trebejov in Slovakia. Surface quarry Včeláre is located in the rock environment of wetterstein limestones. Surface quarry Maglovec is in rock environment of diorite porphyrite. Surface quarry Lietavska Lúčka is formed by the marly limestones. Brekov is dolomitic limestone. Podhradie quarry is composed of pyroxene andesite. Dargov quarry is a quarry of andesite. Kučín quarry is a deposit of clinoptilolite and Trebejov is dolomite. Analytically, we determined the values of the reduced distance LR. From the particle velocity components (vx, vy, vz), we set the particle velocity for each measurement to a maximum value vmax. This is because of assessing the maximum particle velocity as those have the greatest effect of seismic protection. In particular, we used statistical methods. We assessed the strength of dependence between individual data by using correlation. By regression analysis, we determined the dependence on mathematical models for all the components of velocity on deposits. We used the logarithmic transformation (for LR and Vmax) and set the law of attenuation for each assessed deposit. We have used multivariate data analysis and ANOVA to evaluate the variability of velocity with respect to individual deposits and the variability of velocity in relation to distance.
3. Results and Discussion
3.1. Multivariate Data Analysis
- (i)
between input variables L and Q (positive correlation r ≈ 0.5)
- (ii)
between output variables vx, vy, and vz (positive correlation r ≈ 0.97),
- (iii)
between inputs and outputs (vx, vy, and vz)—L, LR (negative correlation r ≈ −0.6); this dependence has been subjected to further investigation through regression analysis.
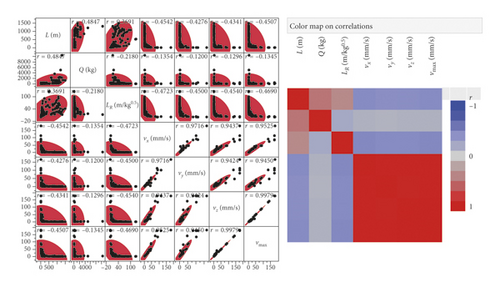
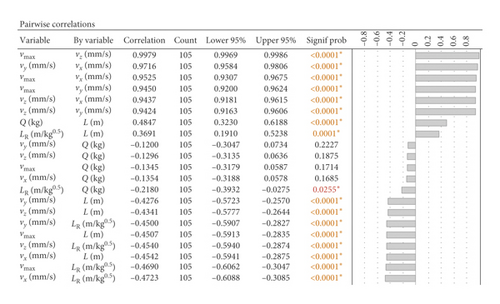
The analysis also revealed the fact that the output variables statistically do not depend on the size of the charge Q. The correlation cluster creates two significant clusters of examined variables, a positive correlation segment (red segment) at the output level and a negative correlation segment at the level of combination of inputs L and LR and output values (blue segment).
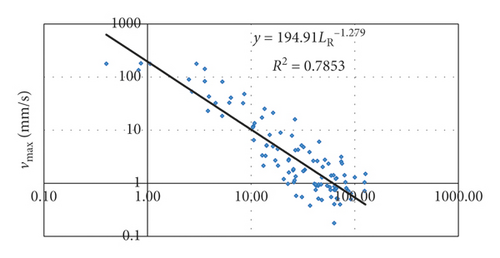
The speed of seismic waves spreading depends on the environment and has a logarithmic behavior. The following graph shows behavior of maximal speed components of spreading of seismic waves. Although we are interested in speed spreading at a shorter distance from the charge to capture the greatest slowdown in seismic wave propagation, we illustrate the behavior of speed at whole distance (see Figure 2). According to this behavior of velocity, by applying the method of least squares, we can find the regression function. Velocity components for individual deposits will be very similar.
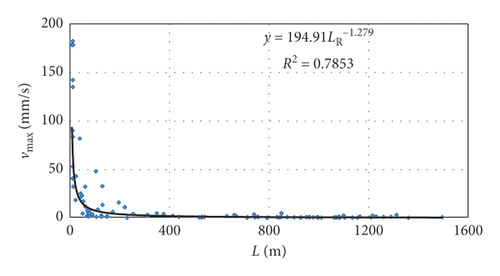
From law of attenuation of seismic waves, we can determine the size of the charge at a known distance and coefficient of attenuation K. The law of attenuation common for all 8 studied deposits is shown in Figure 3. The established regression model achieves a high coefficient of determination and is almost identical to that of Kumar et al. [14] who analyzed the rates of velocity on deposits from 24 authors. Peak particle velocities and their distribution are generally similar.
3.2. Analysis of Categorical Data
After analyzing the numerical variables, we proceeded to analyze on the principle of categorical data, while our aim was to verify the impact of the specific features resulting from the type of environment, given by the type of deposit and distance of measurements from the epicenter L on the measured values.
3.2.1. Analysis of Variability of Measured Maximum Speeds vmax by Individual Deposits
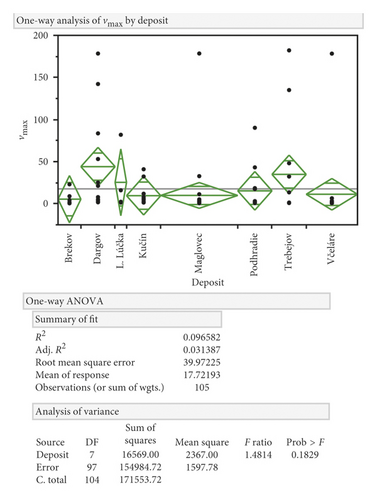
The results of the analysis point to some deposits where the scattering of values is more pronounced (e.g., Dargov and Trebejov) statistically; however, this is not a significant deviation, and from this, it can be concluded that the range of values of the measured maximum particle velocity is comparable for all objects surveyed and the difference is not statistically significant (see Figure 4).
3.2.2. Analysis of Variability of Measured Maximum Speeds vmax in Relation to the Distance from the Blast L and the Reduced Distance LR
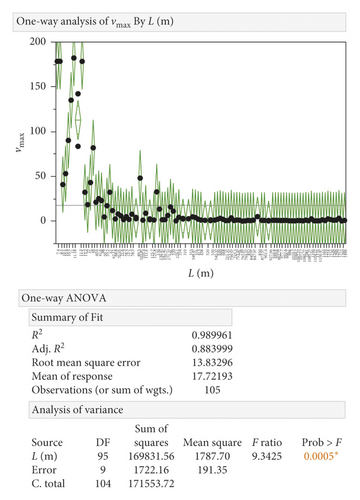
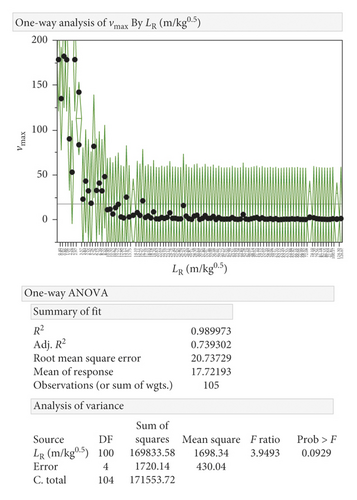
If we focus on the variability of the maximum particle velocity, depending on the distance from the blast, the results of the analysis have shown statistically significant variability of the values with respect to the measurement distance from the epicenter. Closer measurements show higher variability than measurements from a longer distance (see Figure 5). The analysis suggests some unification of the measured values at distant measurements; this was also confirmed with different weights of charges, which is reflected by LR indicator (see Figure 6).
Furthermore, we did continue in the LR assessment because LR is not a real physical distance, and it is a transformed variable. Based on previous findings, there was a need to analyze the data divided into the distance intervals from the epicenter with significantly different variability between intervals. The aim was to exclude the influence of environment (deposit type) on the variability of the measured velocity at the level of these intervals. We determined the boundaries by analyzing the vmax averages according to the individual L distances. Boundaries were set at L1 = 40 and L2 = 220 based on a graphical assessment of variability (see Figure 7). Three categories of intervals were established: <0; 40>; (40; 220>; (220; more>.

Once the intervals have been determined, the ANOVA analysis was performed for each interval separately, and the results demonstrate the merits of this division. The analysis showed statistically significant differences in measured speeds by deposit type. Table 1 summarizes the results of the analysis, while the normal letters characterize the results without statistically significant variability; the bold ones are with statistically significant variability: the letters AB and ABC indicate the mining segments according to the comparison of the average measured values (see Figures 8 and 9). Deposits in one segment do not have statistically significant differences in averages.
| Velocity direction | Distance (m) | ||
|---|---|---|---|
| <0; 40> | (40; 220> | (220; 1500> | |
| vx | AB | AB | AB |
| vy | ABC | AB | A |
| vz | AB | AB | A |
| vmax | AB | AB | A |
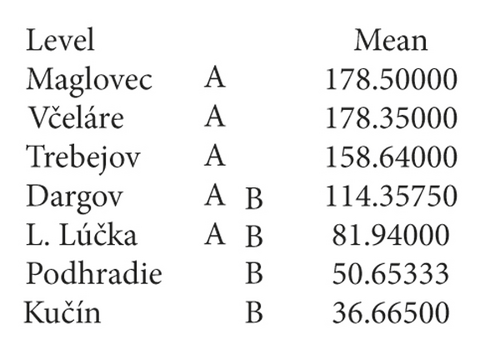
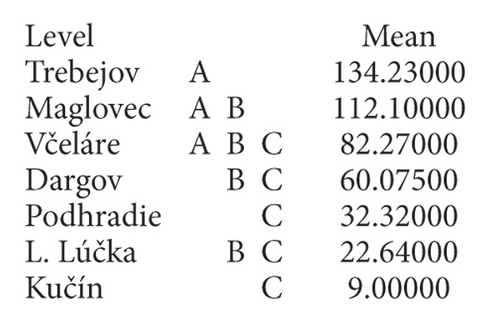
In the x velocity direction, the statistically significant variability between deposits was confirmed at the level of each interval; in the direction of velocity y and z, the statistically significant variability is confirmed at the interval <0; 40> and (40; 220> and unconfirmed at the interval (220; ∞>. When analyzing the maximum measured values, statistically significant variability was demonstrated only at the interval level (40; 220>.
The observed differences in the results of the individual particle velocity directions have led to the need to set a single boundary of the distance L, separating the analyses with a significant variability of the velocity values at deposit levels and low variability.
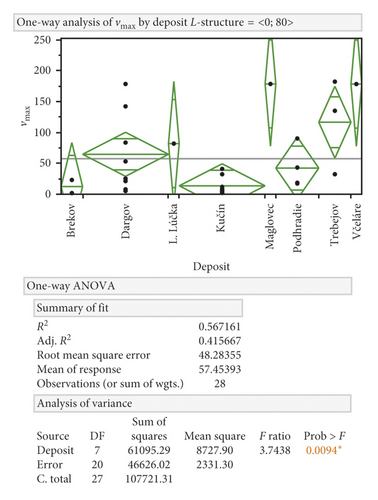
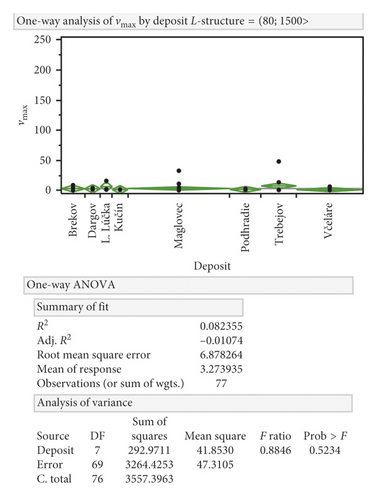
The results of these partial analyzes are summarized in Table 2, which presents the results of all analyzed boundary variants. The table shows the values Prob > F, where a value less than 0.05 points out to statistically significant variability between deposits (marked with bold). The values in the table were finally sorted from the smallest to the largest according to the ANOVA max column. Based on these findings, it can be stated that the boundary of the most significant differences between the intervals is at the distance of L = 80.
| L (m) | ANOVA (probability for velocity component) | |||
|---|---|---|---|---|
| vx | vy | vz | vmax | |
| 0–80 | 0.0387 | 0.0067 | 0.0086 | 0.0094 |
| 0–100 | 0.036 | 0.0055 | 0.0083 | 0.0096 |
| 0–90 | 0.036 | 0.0055 | 0.0083 | 0.0096 |
| 0–75 | 0.0497 | 0.011 | 0.0089 | 0.0097 |
| 0–150 | 0.0684 | 0.0276 | 0.0159 | 0.0195 |
| 0–60 | 0.0542 | 0.0049 | 0.0506 | 0.0508 |
| 150–1500 | 0.0274 | 0.0841 | 0.2082 | 0.0516 |
| 0–70 | 0.1804 | 0.0508 | 0.0502 | 0.0548 |
| 0–40 | 0.13 | 0.023 | 0.07 | 0.08 |
| 0–200 | 0.1 | 0.0368 | 0.0885 | 0.0998 |
| 0–210 | 0.1 | 0.0368 | 0.0885 | 0.0998 |
| 0–220 | 0.1 | 0.0368 | 0.0885 | 0.0998 |
| 200–1500 | 0.3697 | 0.3656 | 0.2476 | 0.4026 |
| 210–1500 | 0.3697 | 0.3656 | 0.2476 | 0.4026 |
| 220–1500 | 0.3697 | 0.3656 | 0.2476 | 0.4026 |
| 70–1500 | 0.3696 | 0.444 | 0.5626 | 0.5028 |
| 80–1500 | 0.4209 | 0.4153 | 0.5948 | 0.5234 |
| 100–1500 | 0.4408 | 0.4523 | 0.6134 | 0.5388 |
| 90–1500 | 0.4408 | 0.4523 | 0.6134 | 0.5388 |
After analyzing the variability of the measured maximum particle velocities vmax by individual deposits for distance up to 80 and over 80 m, the following can be stated. Between individual deposits, there are statistically significant variabilities of maximum particle velocities. From a distance of 80 m, the variability of the maximum particle velocity between deposits is statistically insignificant. We can graphically present previous statement (see Figures 10 and 11).
3.3. Discussion of Results
According to many years of experience in measuring the seismic effects of blasting, it has been found that when measuring the same blast on the same site, with several identical instruments, it is possible to measure the triple as well as the larger variance of the oscillation characteristics. Therefore, the measurement, evaluation, and assessment of seismic effects require a mathematical-statistical approach. There is a relationship between variables v and where the oscillation particle velocity is a dependent variable, and the distance L or reduced distance LR is an independent variable.
By staging the progress of each component of particle velocity in relation to the distance, it is evident that regression functions with a square model have a predominantly high coefficient of determination usually around 0.8. By logarithm, we get the relationship, which in rectangular coordinates represents a straight line. The parameters n and K of this regression line are determined statistically. This is a new approach that is not widely used in the world but gives good results. The K coefficient is adjusted with each new measurement because the inclination of the line changes. In the world, coefficients K and n are determined experimentally. Regression function model for vmax (PPV) is in almost complete agreement with Kumar et al. [14] and approaches of other authors.
In the introduction, it was defined that the attenuation is dependent on the size of the charge, the environment properties, and the distance of the examined receptor. The objective of the article was to prove or disprove the hypothesis, considering the variability of the charge size, which is at certain time step bounded by a particular interval. The hypothesis claimed that within the disintegration of rocks by blasting operations, there is a distance, where maximal destructive effects of seismic waves occur, and this can be determined by a very narrow range of distance, regardless of the size of charge and properties of the transmission environment.
Based on the analysis of the measured data, it was established that within the 10–80 m distance from the location of the load, there is a maximum attenuation of seismic effects.
4. Conclusions
We focused on the statistical assessment of changes in particle velocity of seismic wave propagation in relation to real distance as well as to the so-called reduced distance. The reduced distance, however, is a transformed variable whose advantage mainly lies in the comparability of the course of velocity on the individual deposits, and it also takes into account the influence of the weight of the charge. A complicated and inaccurate estimate of the real distance can be considered a drawback.
It is possible to conclude that the defined hypothesis was confirmed. A very important conclusion of this finding is that the maximum focus on the elimination of seismic effects should be focused on the area located within the interval of maximum seismic effect. This finding does not detract from the importance and significance of detailed monitoring of seismic effects; it is only a certain practical guidance for quick reference when designing the blasting operations (detonation). It also confirms the importance of performing the examination only in specific areas with maximum expected damage impact to buildings, as a result of blasting works (detonation).
In the future, we would like to focus on the criterial analysis, which will utilize the law of attenuation for the propagation of seismic waves in comparison with the coefficient of seismic waves propagation, in order to protect objects against the seismic effects of blasting works. Next investigation will be also carried out by numerical simulation in selected quarries.
Conflicts of Interest
The authors declare that there are no conflicts of interest regarding the publication of this paper.
Acknowledgments
This work was supported by the Scientific Grant Agency of the Ministry of Education, Science, Research and Sport of the Slovak Republic and the Slovak Academy of Sciences (grant no. 1/0509/18).
Open Research
Data Availability
The data (list of velocity components in distance) used to support the findings of this study are available from the corresponding author upon request.


