Inertial Vibration Characteristics of Track Chassis Caused by Reciprocating Motion of Crank Slider
Abstract
The crank slider of self-propelled baling machinery is used for straw compression on the crawler chassis structure. During the reciprocating motion of the crank slider, the inertia of the piston will cause a greater shock to baling machinery. In this paper, the inertia of the crank slider piston was analyzed on crawler chassis. The model and parameter values of the inertia force balance of the crank slider were established by the complete balance method. The test mode was used to analyze the natural mode and mode shape of the piston. The vertical vibration amplitudes of the crawler chassis beam were tested and used to reflect the specific inertial vibration characteristics of the self-propelled baling machinery caused by the reciprocating motion of the piston. The inertial vibration caused by the reciprocating motion of the crank slider was eliminated by the method of weighting the tail of the track beam. Results indicated that the self-balancing counterweight of the crank slider was 261.82 kg. The six natural modal frequencies of the piston were 4.62, 17.26, 29.82, 63.85, 83.73, and 141.58 Hz, respectively. During the reciprocating motion of the piston, the first-order frequency of the piston would be excited by feeding auger excitation frequency of 3.77 Hz and may cause resonance. And, the vertical vibrates of track beam was based on the measuring point 6 as a fulcrum. Adding a counterweight of 265 kg at the end of the track chassis would completely eliminate the self-propelled baling machinery inertial vibration caused by the reciprocating motion of the crank slider.
1. Introduction
The crank slider structure has been widely used in industrial engineering, but the inertial force of the reciprocating motion of the crank slider is an important reason for the inertial vibration of the fixed bracket. The crank slider of self-propelled baling machinery is used for straw compression on the crawler chassis structure. During the movement of the crank slider, the self-propelled baling machinery has strong vibrations, which affect the reliability of the whole machine and work efficiency seriously. In order to reduce the self-propelled baling machinery inertial vibration, it is necessary to obtain the characteristics of the reciprocating motion of the crank slider. The method of controlling the inertial vibration of self-propelled baling machinery was explored by studying the mode and cause of the piston of the crank slider.
In order to quest the inertial vibration caused by the reciprocating motion of the crank slider, Fonte et al. investigated the failure mode of two crankshafts of a single cylinder diesel engine and indicated that the inertial vibration caused by unbalanced mass [1]. Varedi et al. alleviated the undesirable effects of joint clearance by mass redistribution for a slider-crank mechanism [2]. Dardel et al. investigated the effect of joint clearance on vibration and the effect of clearance on the vibration of the bearing of a slider-crank mechanism [3]. The cause of inertial vibration was mainly caused by structural features. Inertia imbalance was a common problem in the field of crank slider mechanisms, especially on the engine and its crankshaft [4, 5]. Sadeq et al. investigated the dynamical behaviors and control of planar crank-slider mechanism, considering the effects of joint clearance and link flexibility [6]. However, the contribution of low rotational speed to inertial vibration was significant, and the ratio of slider-crank radius to link length ensured a minimum amount of torque vibration or irregularity [7, 8]. The existing control methods for inertial vibration were mainly to configure balance and eliminate inertial. The principles of inertial vibration generated by various crank sliders are similar, but the damping methods are significantly different [9].
The piston usually is a large mass. The inertial vibration generated by the piston motion was the source of vibration of the crank slider [10]. Camperi et al. presented a theoretical and experimental tuning of the velocity feedback gain of a plate with an inertial actuator to analyze a direct velocity feedback control unit, which can be tuned locally and provide a global vibration [11]. Inertial mass balance of the crank slider structure was mainly limited by vibration intensity. Active inertial vibration control effect requires the identification of a dynamics model used in tuning the crank slider controller [12]. Akbari et al. indicated that actuators and nonlinear controllers designed which were based on feedback linearization and sliding mode successfully suppressed the vibrations of the elastic linkage using two piezoelectric actuators [13]. Noda and Nakayama simulated the formulas in a noninertial moving coordinate system based on the finite difference method developed in the coordinates [14]. The vibration control analysis of the compression piston must incorporate the structural features of the self-propelled baling machinery.
The self-propelled baling machinery is a crawler chassis structure. When the crawler is walking, the working parts on the chassis execute the picking and compression of the straw. Langer et al. investigated the whole-body vibration exposure of agricultural tractor with large square baler [15]. Li et al. established the inertial force and rotation balance model of the baler rotary cutting feed device and derived the unbalanced excitation force caused by the unbalance of the rotary cutting feed rotor and the free vibration equation of the device [16]. The ANSYS workbench is usually used to rotate the feeding mechanism into the static analysis and obtain the equivalent stress distribution of the rotary cutting feed rotor. In order to obtain the dynamic vibration characteristics of the baler chain drive, Pan et al. used ANSYS to perform modal analysis on the chain drive system and analyze the modal vibration response by solving the mode shape of the baler chain drive system [17]. To optimize the structure of the straw picking and bundling machine, Tao et al. carried out lightweight design of the baler frame through static analysis, modal analysis, and transient dynamics analysis and improved the load-bearing structure of the baler structure [18]. In view of the problems of grass picking and grass leakage caused by the current baler operation, the left and right augers were added on the basis of the original picker, which widened the effective width of the picker. The intermediate hook shaft was used, and the gear ratio was changed by changing the number of teeth of the sprocket to increase the feeding speed of the feeder, but the problem of strong vibration in the picking and binding process was difficult to solve.
In this paper, in order to quest the inertial vibration characteristics of track chassis caused by reciprocating motion of the crank slider, the vertical vibration amplitudes of the crawler chassis beam were used to reflect the specific inertial vibration characteristics of the self-propelled baling machinery caused by the reciprocating motion of the piston. The inertial vibration caused by the reciprocating motion of the crank slider is eliminated by the method of weighting the tail of the track beam. The track chassis vibration reveals that the crank slider caused inertial vibration characteristics. The method of weighting the tail of the track beam can be applied to the vibration damping control of the self-propelled baling machinery.
2. Materials and Methods
2.1. Source of Inertial Vibration of Crank Slider
Self-propelled baling machinery has high picking efficiency and can be used for picking, feeding, conveying, compressing, and bundling of straw. The operating of machine is simple and the cost is low, which greatly reduced the labor intensity and cost of artificially collecting straw in the field. Physical structure of self-propelled baling machinery is shown in Figure 1. But, there was always a tricky vibration status expressed as strong vibration of the track chassis.
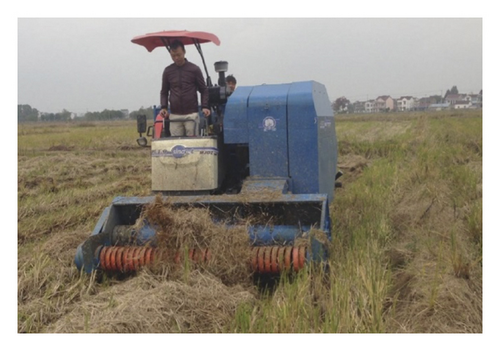
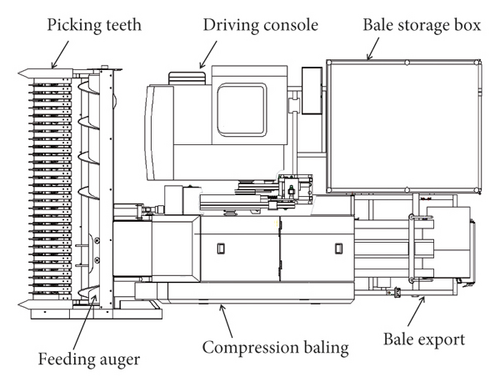
When self-propelled baling machinery was working in the field, the straw was picked up from the field to the position of the header, and then the straw was fed and conveyed to the compression baling by the feeding auger. Under the action of the feeding platen, the straw was entered into the storage chamber and pushed in by the grass pressing piston and pressed forward. When the compressed bale reaches a specified length, the insulation panel was automatically inserted into the storage chamber to cut the bale, and finally the compressed bale was bundled and discharged by the knotter [19].
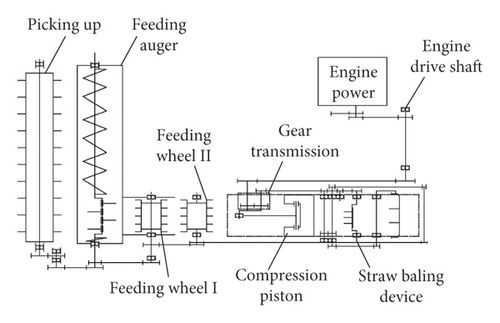
The self-propelled baling machinery consists of a picking up device, feeding auger, feeding wheel, compression piston, gear transmission, straw baling device, and engine power. The engine drives the compression piston and straw baling device through the drive shaft and gearbox [20]. The power of the picking up device, feeding auger, and feeding wheel are provided by the compression piston using a sprocket and chain drive system. The structure and power transmission of self-propelled baling machinery is shown in Figure 2(a). The sectional view of the internal structure self-propelled baling machinery is shown in Figure 2(b).
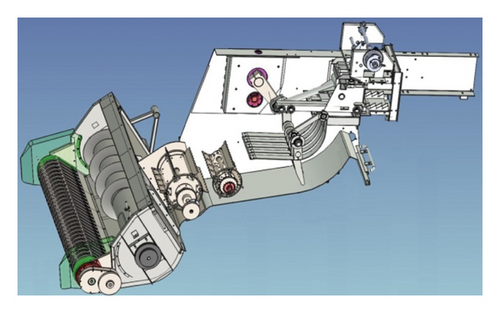
The compression piston is an important part of the self-propelled baling machinery. Due to the large mass of the structure, the moment of inertia is large. When the compression piston moves, it will have a significant impact on the vibration of the self-propelled baling machinery. The three-dimensional structure of the compression piston is shown in Figure 3.
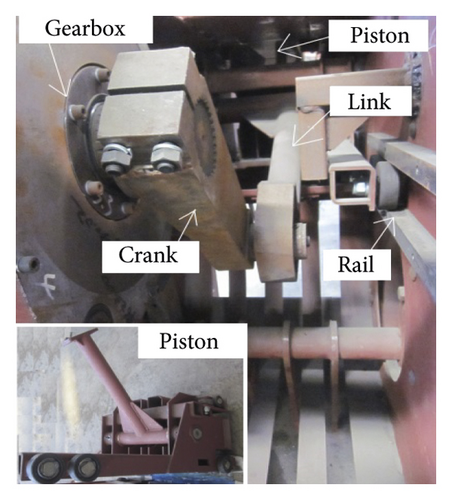
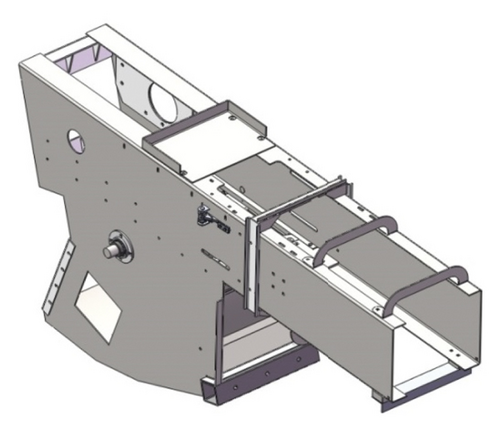
When the compression piston was compressed straw, the crank slider was reciprocating circular motion. The unbalanced inertial force during the process of straw compression in the crank slider mechanism would be produced. Inertial vibration of compression piston was emerged by reciprocating motion of the crank slider.
Self-propelled baling machinery was a track chassis structure. The feeding auger, feeding wheel, compression piston, gear transmission, straw baling device, and engine power were installed on the track chassis structure. The track had contact with the ground completely, and the track and the chassis frame were connected by two support beams. The slider trajectory of piston track and position are shown in Figure 4.
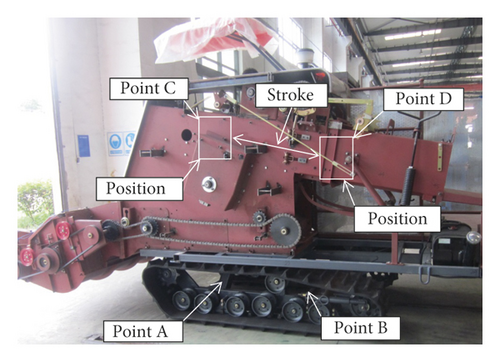
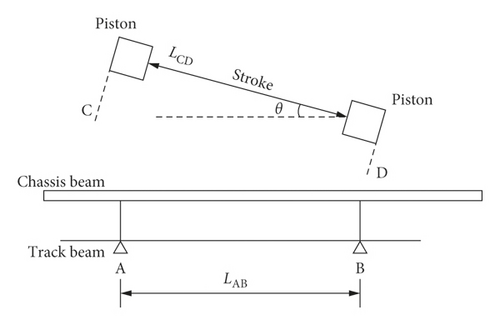
As shown in Figure 4(a), when the self-propelled baling machinery was at idleness, the weight of the whole machine was supported by the interval from point A to point B, the center of gravity of the whole machine was also located between A and B, and the whole machine was in a stable state. From the Figure 4(b), it can be seen that when self-propelled baling machinery was working, the piston reciprocated between C and D. The section of the piston movement coincided with the section of the track beam support point. Therefore, when the piston moved to point C, the inertial force of the piston would cause the whole machine to nod with support point A. Similarly, the inertial force of the piston would cause the whole machine to lift forward with support point B when the piston moved to point D.
2.2. Crank Linkage Structure Dynamics
2.2.1. Motion Model of Piston Structure
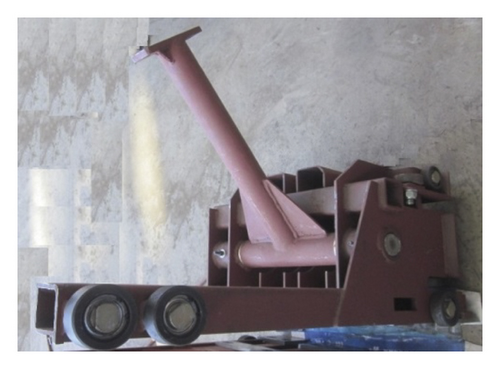
The physical structure of compression piston is shown in Figure 5(a). The crank rotated around the central axis of the gearbox. The connecting rod drove the piston to reciprocate on the sliding rail. In order to facilitate the analysis of the impact and vibration characteristics of the crank slider structure during the movement, the physical structure of the piston was simplified to the crank slider motion diagram. The result is shown in Figure 5(b).
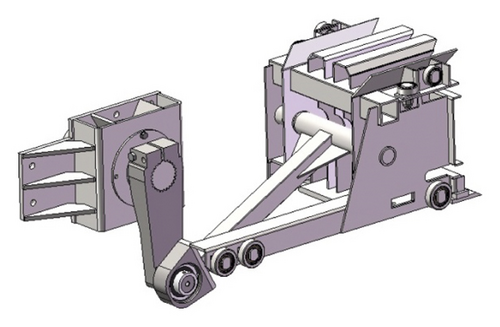
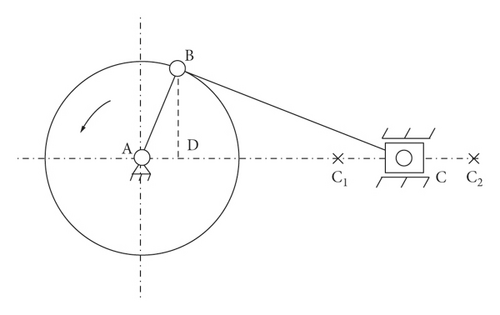
Figure 5(a) is a simplified motion diagram of the crank slider mechanism. Figure 5(b) indicates that point A was the center of rotation of the crank, point B was the point of connection between the crank and the link, and point C was the point of connection between the link and the slider. The points A and B moved at a constant speed around the axis A at an angular velocity ω. The crank radius was R, the link length was L, and the ratio of the crank radius to the link length λ was R/L. The points C1 and C2 were the extreme positions on both sides of the slider, respectively. Point D was the projection of point B on the horizontal axis.
It can be seen from Equation (8) that the speed of the position is proportional to the square of the rotational speed. When the crank speed is large, the acceleration of the slider generates a large inertia force.
2.3. Rotary Drive Fundamental Frequency
The fundamental parameters of the rotating device of the self-propelled baling machinery, the number of rollers of the bearing, the number of teeth of the sprocket, and the wrap angle can be calculated from Equations (10) and (11). Results of fundamental parameters of the rotating structure are shown in Table 1.
| Vibration source name | Rotating speed (rpm) | Exciting fundamental frequency (Hz) | Bearing rollers number | Exciting frequency (Hz) | Sprocket 1 teeth number | Exciting frequency (Hz) |
|---|---|---|---|---|---|---|
| Engine | 2400 | 40 | 15 | 600 | — | 0 |
| Engine drive shaft | 1354 | 22.57 | 14 | 315.98 | 32 | 722.24 |
| Knotted shaft | 96.5 | 1.61 | 13 | 20.93 | 32 | 51.52 |
| Mower shaft | 96.5 | 1.61 | 13 | 20.93 | 32 | 51.52 |
| Transport bale shaft | 193 | 3.22 | 13 | 41.86 | 21 | 67.62 |
| Gear transmission | 391.7 | 6.53 | 15 | 97.95 | 73 | 476.69 |
| Feeding wheel I | 569.8 | 9.50 | 13 | 123.5 | 30 | 285 |
| Feeding wheel II | 341.8 | 5.70 | 13 | 74.1 | 21 | 119.7 |
| Feeding auger | 226 | 3.77 | 14 | 52.78 | — | 0 |
| Picking up device | 141 | 2.35 | 13 | 30.55 | 58 | 136.3 |
From the results of Table 1 and Equations (12) and (13), the engine frequency was 40 Hz and the engine combustion excitation frequency and the inertial force excitation frequency were 80 Hz. Dynamics of the roller chain system was simulated by Pan et al. with ADAMS software and indicated that the lateral velocity fluctuation of the chain in the chain drive system was much larger than the longitudinal direction [17]. In this paper, the effect of chain vibration on the vibration of the crank slider is not considered.
2.4. Natural Frequency and Modal
2.4.1. Modal Analysis Method of Piston
The modal of the compression piston is inherent attributes and traits. There are two modalities for the compression piston. The first one is inherent natural mode, which is free without constrained state. The second one is working modalities, which is in the assembled state. When the rotation frequency is the same as the natural frequency of the compression piston, the barrel will send resonance and the vibration will increase dramatically.
ANSYS was widely used in many industries, and it was also used to describe and analyze the structural state [22]. The 3D model of the compression piston was developed by SolidWorks software (shown in Figure 3(a)) and saved as STEP format. The piston was 877 mm long, 420 mm wide, and 507 mm high. The piston was mainly welded from Q235 structural steel, angle steel, and square steel. Then, the 3D model was imported into ANSYS workbench [23]. The material properties selected during ANSYS analysis were as follows: elastic modulus E = 210 GPa, Poisson’s ratio μ = 0.33, density ρ = 7850 kg/m3, and yield strength σs = 235Mpa. Then, the restricted modality developed by ANSYS is shown in Figure 6(a).
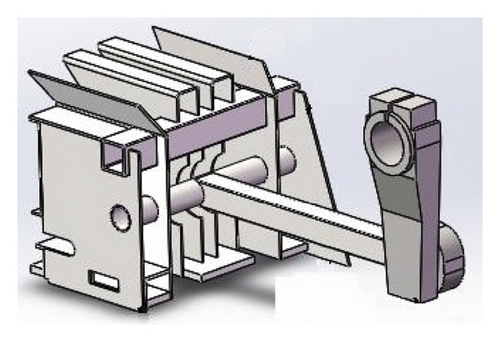
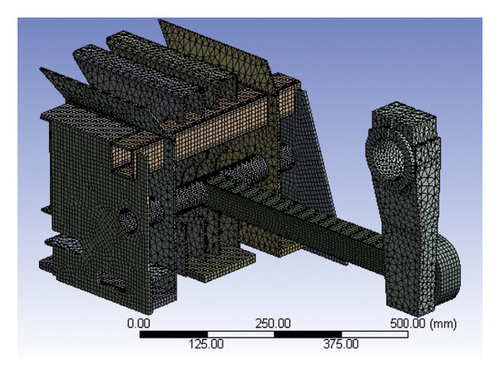
Meshing was an important step in modal analysis of ANSYS software. The meshing method combining the tetrahedron method and the sweeping method was used to generate a tetrahedral mesh for the irregular geometry [24]. For the regular geometry, the hexahedral mesh was generated by the sweeping method using the coordinated segmentation algorithm. Because the compression piston had a minimum structural thickness of 4 mm, the grid size was 4 mm, and the meshing result is shown in Figure 6(b). The total number of nodes in the finite element simulation model was 139238, and the total number of units was 37703.
2.5. Experiment Mode of Assembly Piston
In order to analyze the inertial vibration characteristics of track chassis caused by the reciprocating motion of the crank slider, the point representing the contour of the piston was selected to test the vibration. The vibration testing system was composed of a test object (track chassis), signal acquisition system, signal analysis, and processing system. The signal acquisition systems collected the electrical signal of every test point on track chassis in the 3 kinds of conditions. The system of signal analysis would handle and analyze the signals and then converted it into the desired frequency response function. The signal acquisition system used the United States of America (PCB) 356A16-type three-acceleration sensors, which is shown in Figure 7(a).
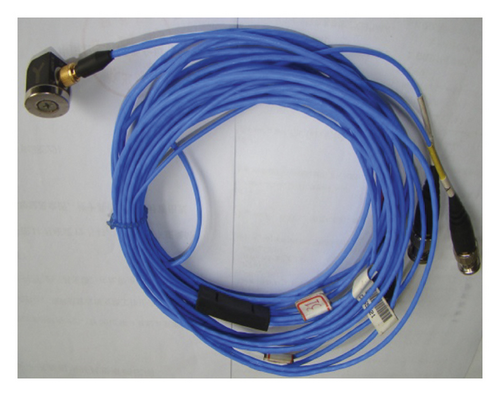
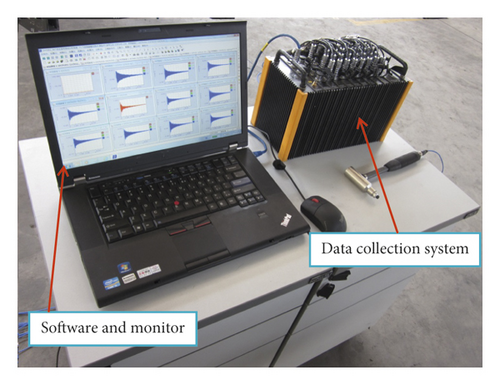
The Donghua testing company’s DH5902 dynamic signal acquisition instrument is shown in Figure 7(b). Test performance parameters of vibration instrument are shown in Table 2.
| Equipment name | Performance index | Parameter values | Manufacturer |
|---|---|---|---|
| Three-direction acceleration sensor of 356A16 | Sensitivity | 100 mV/g | American Voltage Company (PCB) |
| Frequency response | 0.3∼6 KHz | ||
| Range | ±50 g·pk | ||
| Lateral sensitivity | <5% | ||
| Dynamic signal acquisition instrument of DH5902 | Channel | 32 | Donghua Testing Company |
| Sampling bandwidth | 16, 100 KHz | ||
| End scale value | ±20 mv∼±20 V | ||
| Distortion factor | <0.5% | ||
Signal analysis and processing system is Donghua testing company’s signal analysis software DHDAS of 30 data transmission lines and connectors. The main modules of the DHDAS system included three kinds of modules, parameter setting module, display module, and signal analysis module. Testing and analysis of the parameters in software settings were as follows: the sampling frequency was 2 KHz; the analysis frequency was 781.25 Hz; sampling method was continuous sampling; the trigger mode was free acquisition; data block defaults to 1; and delay block defaults to 0. The average method was linear average, the average number of times was 5, time domain points was 512, frequency domain line number was 200, and overlap rate was 50%.
The modality of the piston is an important factor reflecting the bearing and vibration response. In order to obtain the experimental mode of piston, DH5902 dynamic signal acquisition instrument was used to test the experimental mode. The signal acquisition system and dynamic signal acquisition instrument were produced by the Chinese Donghua testing company. The test system consisted of the vibration signal acquisition system and signal analysis processing system, as is shown in Figure 7(b). The signal acquisition system collected the electrical signal of acceleration test point on frame under 3 kinds of conditions. Signal acquisition system used the United States of America (PCB) 356A16-type three-component acceleration sensors to test the vibration signals. The methods for testing and analyzing experimental modalities are available in reference [25].
The test used a single-point excitation multipoint to measure the response data. Each time 4 points were measured, 22 batches were completed, each batch was tapped 2 times for each excitation point, and the signal was linearly averaged. During the test, wiped the position of the measuring point at first and marked the position of the measuring pointed with a marker, and at the same time, the three-way acceleration sensor was attracted to the arranged measuring point. The three-way acceleration sensor, dynamic signal acquisition instrument, and dynamic signal analysis and processing software were accurately connected. Strike the excitation point with the exciting force hammer to ensure that each measuring point fully receives the excitation signal, observe the coherence coefficient of the pulse signal and the response point acceleration signal (the coherence coefficient of the vibration signal within 200 Hz is around 1), and ensure the measured data. The constrained modal test site and measurement points are shown in Figure 8.
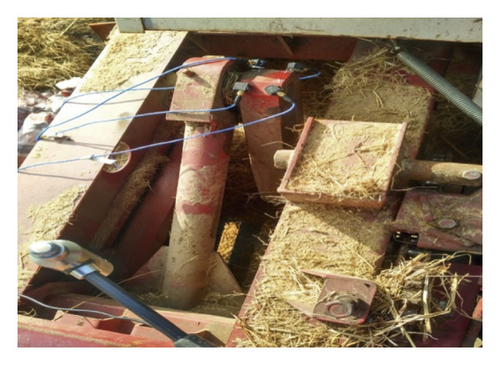
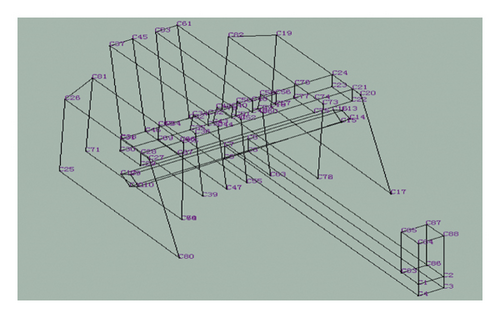
The single-input and multioutput method was used to test the modes of piston. Four 356A16-type three-component acceleration sensors were arranged in batches to test the vibration response of 88 points of the header platform, and the 13 channels received the excitation signal of the test hammer and the vibration signals of the acceleration sensors. Since the stiffness of the excitation point was set to be large and the frequency domain of the piston of interest is narrow, a medium-hardness nylon hammer was used as the excitation.
The information measured by the modal test requires the highest possible signal-to-noise ratio. Therefore, the arrangement principle of the measuring points is the position of the external force acting point, the important response point, and the cross-linking point of the component or the structure, and the connected measuring point should be able to display the overall shape of the piston. The model structure established in the modal test is shown in Figure 8(b). A total of 88 test points were established on the piston. The vibration test under single excitation was performed on 88 measuring points on the piston, and the constrained mode and mode were obtained by using the DH5902 dynamic signal acquisition instrument.
2.6. Vibration Test and Analysis Method
Based on the structural characteristics of the self-propelled baling machinery, the measurement points were arranged near the main exciting source and working parts so that more accurate vibration data can be obtained. The arrangement and structure of the 356A16-type three-acceleration sensors on self-propelled baling machinery are shown in Figure 9.
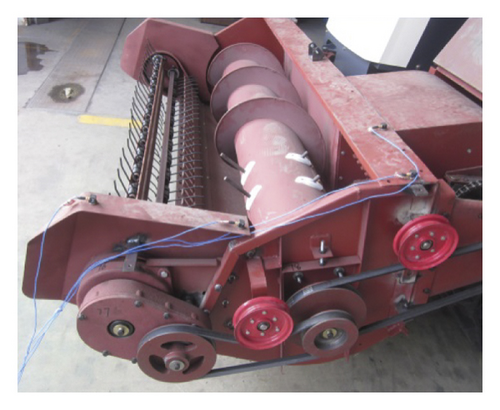
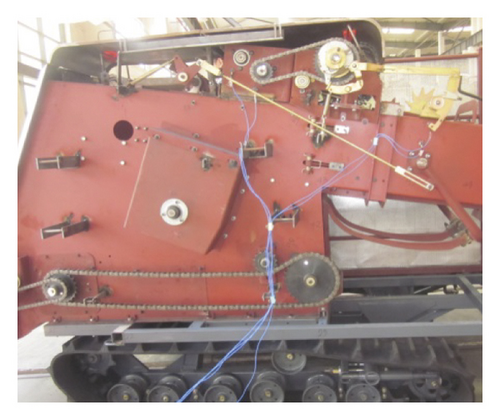
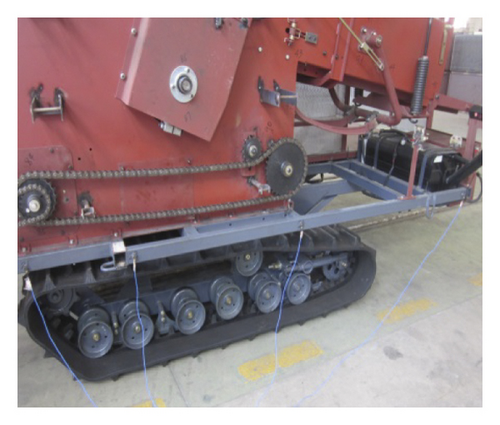
According to the installation direction of the acceleration sensor and the direction of the baling machinery structure, it was determined that the acceleration value of the X, Y, and Z direction tests of each acceleration sensor represents a value in a direction of the baling machinery structure.
This vibration test method mainly tests two working conditions of baling machinery, only when the engine was working and the whole machine was running at no load (including engine work). The test process used continuous sampling to acquire vibration signals. To avoid signal aliasing, the sampling frequency must be at least twice the frequency of the analysis signal. In order to ensure the integrity of the amplitude, the sampling frequency was at least 5 to 10 times the highest analysis frequency of the signal. Therefore, the sampling frequency was set to 2 KHz, and the number of time domain points was 8192.
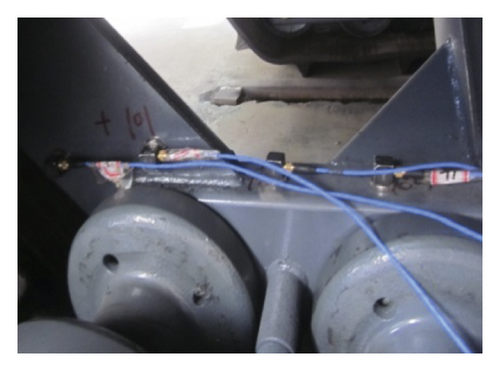
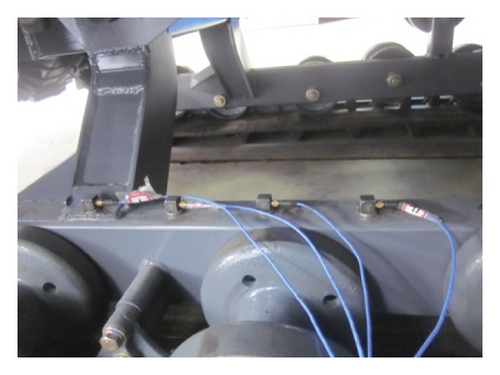
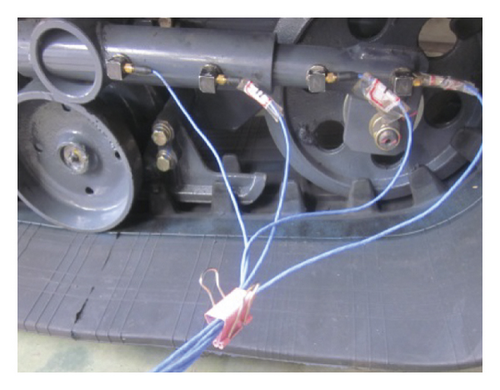
In order to test the reciprocating motion of the piston, the vibration of the crawler chassis was caused. By measuring 16 measuring points from left to right on the track beam, each measuring point was 10 cm apart. The vibration of the track beam was analyzed by the vibration amplitude of each measuring point when the piston reciprocates. The vibration measuring point arrangement on the track beam is shown in Figure 10.
3. Results and Discussion
3.1. Imbalance of Piston in Motion
The total mass of the crank slider mechanism was m, and the acceleration of the centroid P was as. In order to balance the total inertia force of the crank slider mechanism, the total inertia force of the mechanism was F = mas = 0. The mass of the crank slider mechanism m was not equal to 0. The center of mass of the crank slider mechanism should be kept still or at linear motion at a constant speed. Moreover, because the crank slider mechanism performs periodic reciprocating motion, it was impossible to obtain uniform linear motion in the center of mass. In order to balance the total inertia force of the crank slider mechanism, it was necessary to ensure that the total center of mass of the crank slider mechanism is stationary.
In order to obtain the unbalanced mass generated during the movement of the crank slider mechanism, this paper solved the unbalanced mass of the crank slider by solving the centroid static method of the crank slider mechanism [26, 27]. It was assumed that there was a mass ME at the point E in the opposite direction of the connecting rod, so that the center of mass of the ME and the MC was located at point B. Assume that there is a mass MF at the point F in the opposite direction of the crank so that the total center of mass of the mechanism is fixed at point A. Therefore, during the movement of the mechanism, the center of mass is fixed at point A and remains stationary, and the straw compression mechanism is theoretically completely balanced. The virtual masses ME and MF solved at this time were the unbalanced masses of the crank slider mechanism. The crank slider centroid balance method is shown in Figure 11.
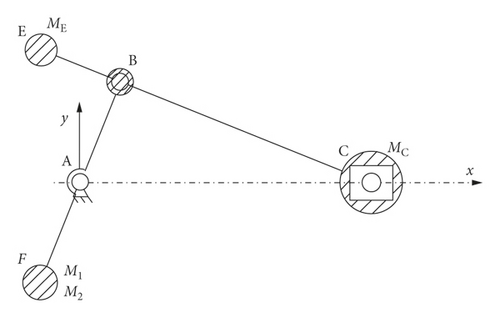
By dimensional measurement and weighing each part of the crank slider straw compression mechanism, the equivalent mass of the slider was 65 kg, the length of the connecting rod was 560 mm, the connecting rod was extended by 200 mm to E point, MERe = MCLBC can obtain ME = 182 kg. From this, the concentrated mass at point B can be about 247 kg and MBR = MFRf can be obtained as MF = 261.82 kg. The self-balancing of the straw compression mechanism was realized by adding two masses to the crank slider straw compression mechanism, and the unbalanced quality existing in the movement of the crank slider mechanism is obtained.
3.2. Modal and Mode Shapes of Piston
In the actual working process, the crank drove the piston to make the reciprocating motion. Therefore, the constrained modal analysis can reflect the actual vibration characteristics of piston better. After adding an axial displacement constraint to the piston drive shaft hole and setting the parameters for the modal analysis, the constrained mode of the compression device was solved, and the first 6-order nonzero mode parameters of the compression device constrained mode are shown in Figure 12.
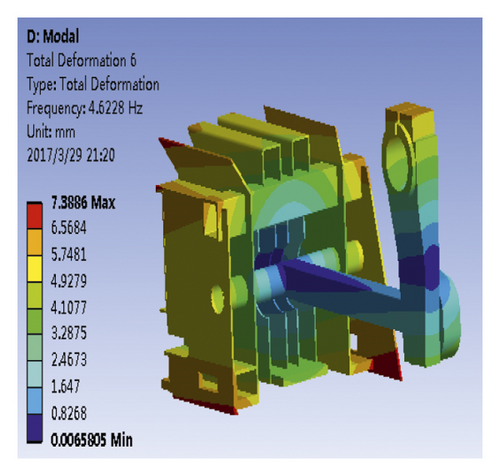
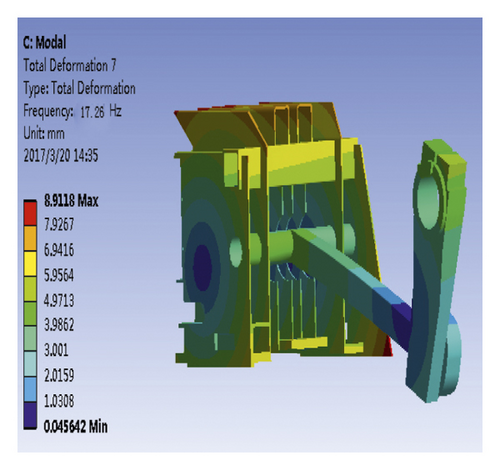
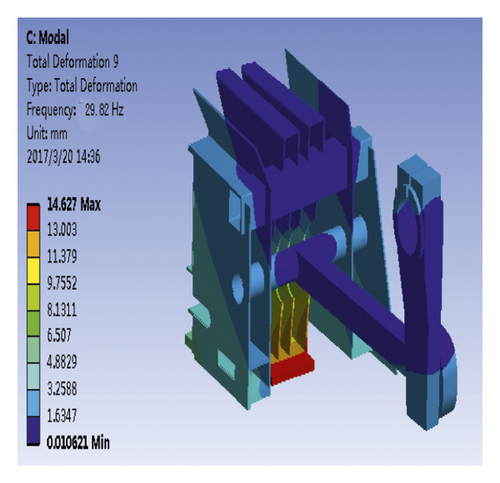
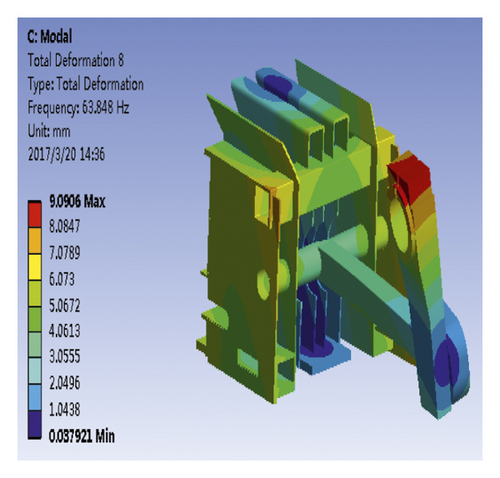
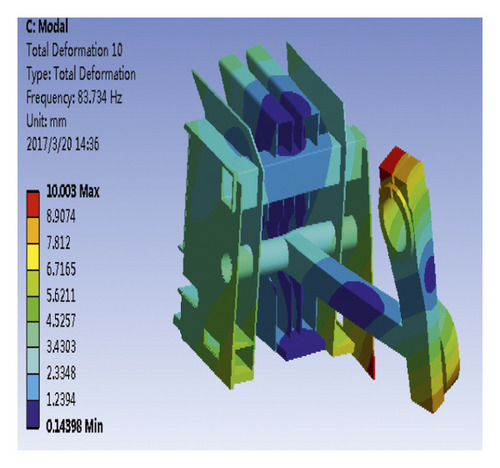
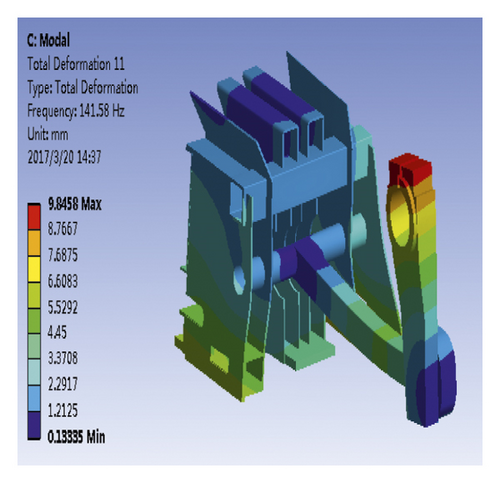
According to Figure 12, the first-order vibration frequency of piston was 4.62 Hz; the vibration mode was characterized by the crank and connecting rod bending. The second-order vibration frequency of the piston was 17.26 Hz; the vibration mode was mainly concentrated in the crank and connecting rod parts. When the second-order mode shape is compared with the first-order crank mode shape, the bending of the connecting rod of the second-order mode is more obvious. The third-order mode was mainly concentrated on the middle plate and the right plate. The deformation of the middle plate was large, and the vibration frequency corresponding to the third-order mode was 29.82 Hz. The fourth-order vibration frequency was 63.85 Hz, and the vibration mode was characterized by crank, connecting rod bending, severe deformation of the intermediate plate, and slight deformation of the right side plate. The fifth-order vibration frequency was 83.73 Hz, and the vibration mode was characterized by the crank, connecting rod bending, and severe deformation of the intermediate plate. The sixth-order vibration frequency was 141.58 Hz, and the vibration mode was characterized by the crank, connecting rod bending, slight deformation of the intermediate plate, and severe deformation of the left- and right-side plates. The natural frequencies and mode shapes of restricted modality are shown in Table 3.
| Modal order | Modal frequency (Hz) | Modal mode description |
|---|---|---|
| 1 | 4.62 | Crank, connecting rod bending |
| 2 | 17.26 | Crank, connecting rod bending, slight deformation of the middle plate |
| 3 | 29.82 | The middle plate is severely deformed, and the right-side plate is slightly deformed |
| 4 | 63.85 | Crank, connecting rod bending, severe deformation of the middle plate, slight deformation of the right-side plate |
| 5 | 83.73 | Crank, connecting rod bending, severe deformation of the middle plate |
| 6 | 141.58 | Crank, connecting rod bending, slight deformation of the middle plate, severe deformation of the left- and right-side plates |
3.3. Experiment Mode of Piston
Modal assurance criterion (MAC) is used to evaluate the quality of mode shapes of modal analysis or the similarity of two vectors. The degree correlation of MAC between the two sets of modal vectors is tested against the calculated modal frequency. When the value of MAC is closer to 1, it indicates that the two sets of modal vectors are completely correlated, in which the modalities are consistent. The degree correlation between the various modal frequencies of the piston was close to 1, and the result is shown in Figure 13.

By analyzing the collected data of the DH5902 dynamic signal acquisition instrument, the first 6 modal frequencies of the piston and the corresponding vibration mode map were obtained. The results are shown in Figure 14.
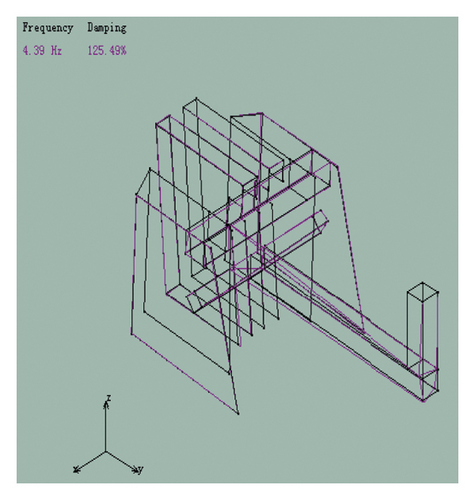
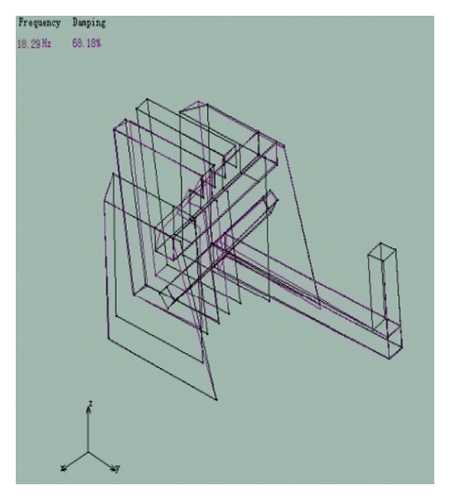
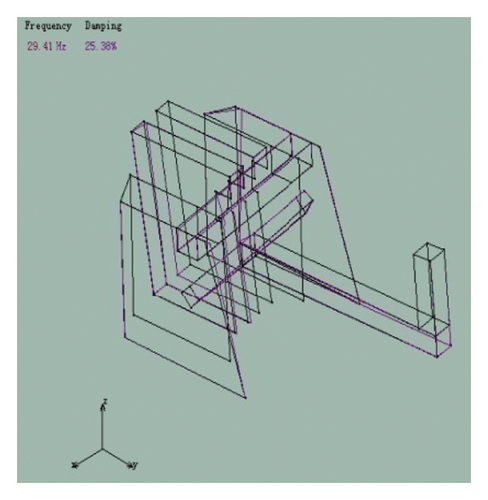
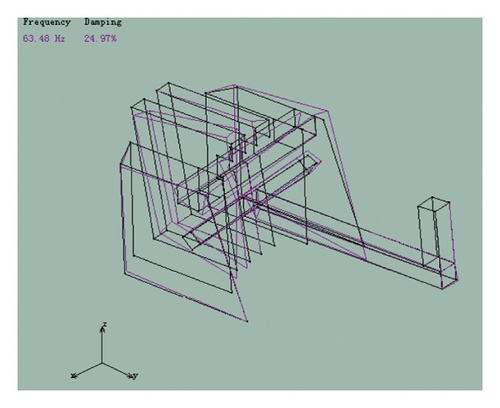
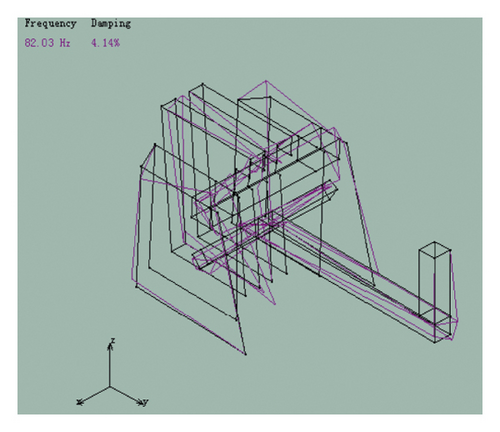
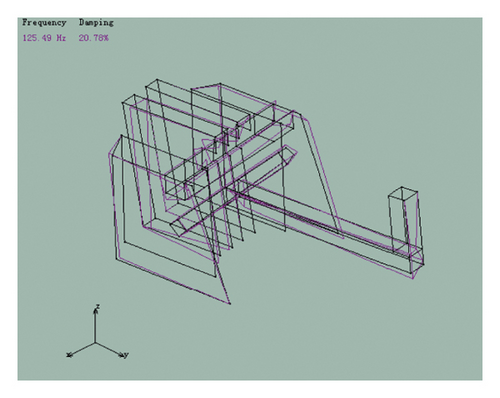
The finite element simulation results of the piston were compared with the modal test results. The results are shown in Table 4.
| Modal order | Finite element modal analysis results | Test modal analysis results | Relative error (%) | ||
|---|---|---|---|---|---|
| Simulation mode frequency (Hz) | Modal mode description | Test mode frequency (Hz) | Modal mode description | ||
| 1 | 4.62 | Crank, connecting rod bending | 4.39 | Crank, connecting rod bending | 5.2 |
| 2 | 17.26 | Crank, connecting rod bending, slight deformation of the middle plate | 18.29 | Crank, connecting rod bending, slight deformation of the middle plate | 5.9 |
| 3 | 29.82 | The middle plate is severely deformed, and the right-side plate is slightly deformed | 29.41 | Crank, connecting rod bending, slight deformation of the middle plate | 1.4 |
| 4 | 63.85 | Crank, connecting rod bending, severe deformation of the middle plate, slight deformation of the right-side plate | 63.48 | Crank, connecting rod bending, severe deformation of the middle plate, slight deformation of the left- and right-side plates | 0.6 |
| 5 | 83.73 | Crank, connecting rod bending, severe deformation of the middle plate | 82.03 | Crank, connecting rod bending, intermediate plate, left- and right-side plates are severely deformed | 2 |
| 6 | 141.58 | Crank, connecting rod bending, slight deformation of the middle plate, severe deformation of the left- and right-side plates | 125.49 | Crank, connecting rod bending, severe deformation of the middle plate, slight deformation of the left- and right-side plates | 11.3 |
According to Table 4, the experimental modal and finite element simulation results of the piston had relatively small relative error and the maximum relative error was 11.3%. The vibration modes of the pistons were basically the same, which showed that the obtained finite element simulation results and the modal test results had relatively high accuracy, and the accuracy of the finite element simulation was also verified. The main reasons for the relative error were (a) measurement error of the three-way acceleration sensor and interference error of the external signal during the test; (b) damping factors were not considered in the finite element analysis process, and the test results had damping effects in the test mode; (c) in the piston finite element model analysis, the influence of welding on the results was ignored; (d) in the finite element modeling of the piston, part of the structure that had less influence on the result was omitted.
Based on the results of Table 1, the exciting fundamental frequency of feeding auger was 3.77 Hz, which was close to 0.8 times the first-order frequency of the piston. Then, the piston was susceptible to being excited by the auger and causing resonance. There was no possibility that the excitation frequency of the piston and other vibration source structures will resonate. At the same time, the piston did not resonate with the excitation of other vibration source structures under the excitation of bearing rollers and sprocket teeth.
3.4. Vibration Test and Analysis Method
Select the middle stable segment of the signal to perform maximum, minimum, mean, and variance analysis. The FFT (fast-Fourier transformation) was performed on the segment of the signal to obtain a spectrogram [28]. The vibration signal of the left front and end of pickup frame was tested by the method, and the stable segment signal was selected for maximum value, minimum value, mean value, and variance analysis; the result is shown in Figure 15(a). Taking the stable segment in Figure 15(a) as the statistical sample segment, and the frequency response curve and frequency value obtained after FFT transformation are shown in Figure 15(b). This paper tested other vibration signals and other state vibration results of self-propelled baling machinery.
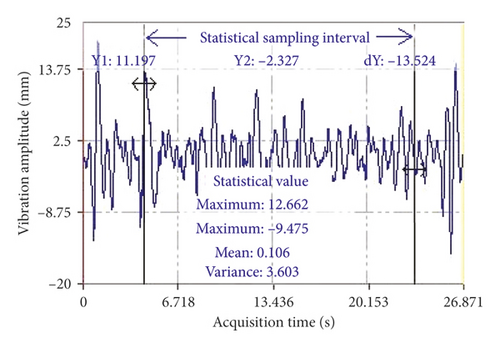
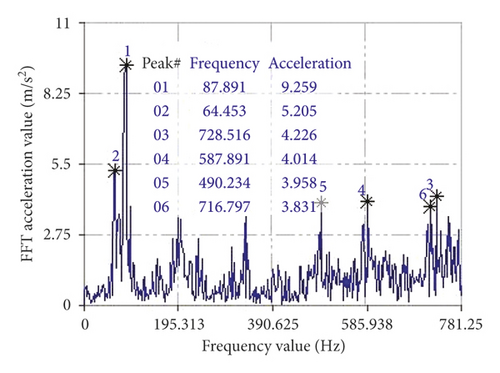
In order to study the vibration caused by piston excitation of self-propelled baling machinery, this paper tested the vibration value and frequency response value of the sample point on the pickup frame and piston sidewall when the piston was working. The vibration and frequency of the measuring point are shown in Table 5.
| Number | Vibration testing point site | X direction | Y direction | Z direction | |||
|---|---|---|---|---|---|---|---|
| Frequency (Hz) | Amplitude (mm) | Frequency (Hz) | Amplitude (mm) | Frequency (Hz) | Amplitude (mm) | ||
| 1 | Left front and end of pickup frame | 87.89 | 9.26 | 87.89 | 17.53 | 335.94 | 19.40 |
| 2 | Left back and end of pickup frame | 332.03 | 1.11 | 5.86 | 1.59 | 13.67 | 1.49 |
| 3 | Middle of pickup frame | 417.97 | 0.51 | 27.34 | 2.10 | 27.34 | 1.20 |
| 5 | Upper right part of conveyer trough | 160.16 | 0.68 | 80.08 | 2.83 | 80.08 | 0.70 |
| 6 | Middle of bundling mechanism | 76.17 | 0.13 | 80.08 | 0.90 | 80.08 | 0.41 |
| 7 | Lower tail of binding mechanism | 74.22 | 0.15 | 78.13 | 0.58 | 156.25 | 0.41 |
| 10 | Front of the track chassis | 80.78 | 0.60 | 80.08 | 0.94 | 525.39 | 1.67 |
| 11 | Middle of the track chassis | 80.08 | 0.48 | 80.08 | 0.84 | 748.05 | 0.86 |
| 12 | Rear ends of the track chassis | 537.1 | 0.57 | 80.08 | 0.53 | 80.08 | 1.18 |
According to Tables 4 and 5, the vibration in the X, Y, and Z directions of the pick-up station under the condition of only the engine operation reaches the maximum value of 1.46 m/s2 at the left end of the measuring point 2 (39.06 Hz was the engine). The combustion excitation frequency was half frequency of 80 Hz, 3.61 m/s2 (39.06 Hz was the half frequency of the engine combustion excitation frequency of 80 Hz), and 2.21 m/s2 (74.22 Hz was close to the engine combustion excitation frequency of 80 Hz). In the X and Y directions, the main frequency was 39.06 Hz and there was coupled vibration in the horizontal direction.
The vibration in the X, Y, and Z directions of the pick-up table under the working condition of the working part reaches the maximum value of 9.26 m/s2 at the left front end of the measuring point 1 (87.89 Hz was the frequency multiplication of the engine intermediate shaft 22.57 Hz)), 17.53 m/s2 (where 87.89 Hz was the engine intermediate shaft 22.57 Hz multiplier), and 19.40 m/s2 (of which 335.94 Hz was the engine intermediate shaft 22.57 Hz multiplier). And, there was also coupled vibration in the horizontal direction, in which the vibration energy in the Y and Z directions was large, which was the dominant factor in the vibration of the pick-up table. The vibration phenomenon caused by the continuous excitation of the baler in the actual working process was investigated by Tao et al. [18]. The maximum accelerations of the X, Y, and Z directions of the baler frame were 0.299 m/s2, 0.234 m/s2, and 0.460 m/s, respectively. It can be seen that the self-propelled baling machinery studied in this manuscript has a huge vibration.
As shown by Table 5, the frequency corresponding to the amplitude peaks of the measuring point 5 (upper right part of conveyer trough), the measuring point 6 (middle of bundling mechanism), and the measuring point 7 (lower tail of binding mechanism) on the conveying baling frame in the X, Y, and Z directions was the combustion excitation frequency of the engine 80 Hz, and its double frequency was 160 Hz. The frequently occurring frequency of 48.83 Hz was the half-frequency of the rolling element passing through the transmission shaft end bearing with a frequency of 97.95 Hz.
At the same time, the vibration frequency of the measuring point 10 (the front of the track chassis), the measuring point 11 (the middle of the track chassis), and the measuring point 12 (the rear ends of the track chassis) was measured and is shown in Table 5. It can be seen that, under the operating conditions of piston, the vibration frequency of the front of the track chassis was about 80 Hz. The combustion excitation frequency was mostly transmitted directly to the fuselage through the rigid connection of the frame. Benajes et al. indicated that the piston bowl geometry has an effect on the engine combustion excitation frequency [29]. That is to say, the shape of the weight has an effect on the balance effect. However, the weight of piston did not affect the balance of inertial vibration in this study.
3.5. Track Chassis Vibration Caused by Piston
The time domain waveforms of each measuring point were converted into displacement amplitude by means of quadratic integration and filtering. The vibration amplitude results of the 16 measuring points on the track beam in the vertical direction are shown in Table 6.
| Measuring point number | Upward vibration amplitude (mm) | Downward vibration amplitude (mm) | Vibration peak amplitude (mm) | Upper and downward amplitude mean (mm) | Upper and downward amplitude difference (mm) |
|---|---|---|---|---|---|
| 1 | 4.9 | −3.86 | 8.76 | 4.38 | 1.04 |
| 2 | 1.85 | −2.77 | 4.62 | 2.31 | −0.92 |
| 3 | 1.43 | −2.42 | 3.85 | 1.925 | −0.99 |
| 4 | 1.34 | −2.12 | 3.46 | 1.73 | −0.78 |
| 5 | 0.97 | −1.4 | 2.37 | 1.185 | −0.43 |
| 6 | 0.85 | −1.2 | 2.05 | 1.025 | −0.35 |
| 7 | 1.04 | −1.42 | 2.46 | 1.23 | −0.38 |
| 8 | 1.77 | −2.81 | 4.58 | 2.29 | −1.04 |
| 9 | 2.14 | −2.51 | 4.65 | 2.325 | −0.37 |
| 10 | 3.27 | −3.7 | 6.97 | 3.485 | −0.43 |
| 11 | 4.81 | −4.67 | 9.48 | 4.74 | 0.14 |
| 12 | 4.78 | −4.97 | 9.75 | 4.875 | −0.19 |
| 13 | 5.54 | −5.74 | 11.28 | 5.64 | −0.2 |
| 14 | 6.62 | −6.69 | 13.31 | 6.655 | −0.07 |
| 15 | 6.4 | −6.32 | 12.72 | 6.36 | 0.08 |
| 16 | 7.4 | −7.56 | 14.96 | 7.48 | −0.16 |
- The vertical vibration sweeping surface and vibration amplitude change trend line are shown in Figure 16.
As can be seen from the Figure 16(a), the downward vibration of track beam was because the track and teeth were made of rubber material. When the track vibrates vertical, the teeth were compressed, thus causing downward vibration of the track beam. Vibration amplitude at both ends measuring points of the track beam had much larger amplitude of displacement in the vertical direction. The vibration amplitude of measuring points 6 was the smallest on track chassis beam, which indicated that the support point of the track chassis beam of self-propelled baling machinery was the sixth point. The support point of the track beam on the ground can be determined based on the point with the smallest amplitude [30].
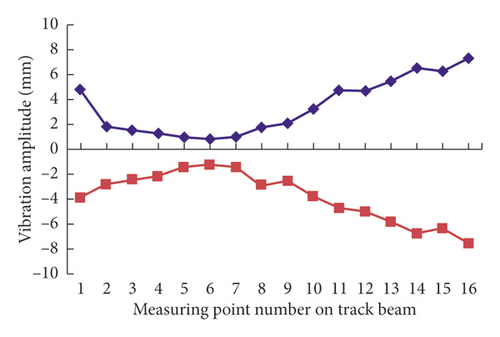
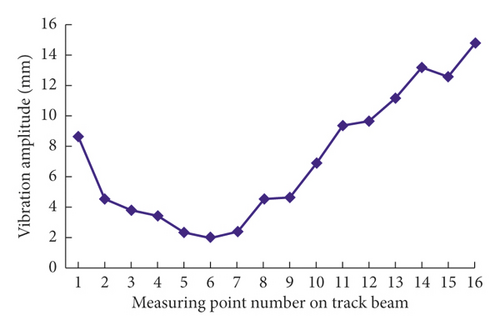
The peak-to-peak vibration amplitude of the track beam is shown in Figure 16(b). The peak-to-peak vibration amplitude of measuring points 4–6 was the smallest and stable along the direction of the beam. Combined with the results of Figures 16(a) and 16(b), it can be known that 4–6 points were always in contact with the ground during the vibration of the track beam. The vertical vibrates of track beam was based on the measuring point 6 as a fulcrum.
From Figure 16, it can be concluded that, in order to reduce the vibration amplitude of the self-propelled baling machinery during the reciprocating motion of the piston, it was necessary to make the self-propelled baling machinery have the largest grounding area at the time of the crawling, so the center of gravity C of the whole machine must be after the shift; the ideal center of gravity was located approximately at the point D of the middle of the two struts to which the chassis was connected to the track beam.
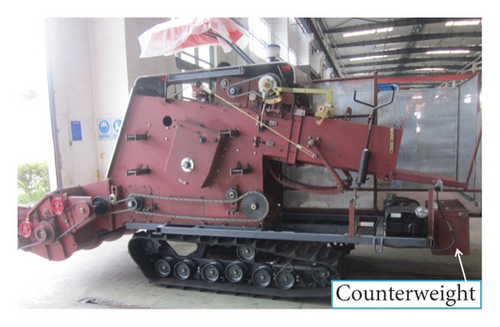
In order to move the center of gravity back to point D, you need to add a weight at the end of the self-propelled baling machinery. Its weight was M. Firstly, when the straw compression and bundling mechanism worked, the piston reciprocated between point E and point F. When the piston was at the limit point E and point F, the piston speed v = 0 and the acceleration a ≠ 0, so the piston had an unbalanced inertial force FE. Inertial balance analysis of crawler chassis structure is shown in Figure 17.
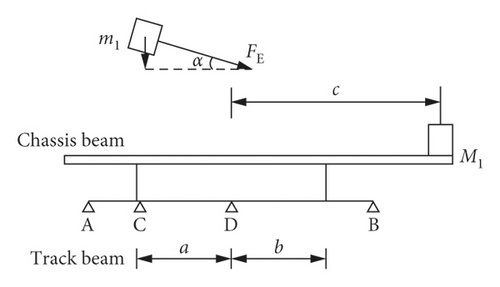
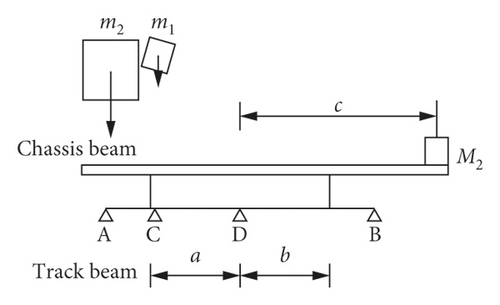
Let the crank move around the fulcrum at an angular velocity ω, the radius of the crank R, and the connecting rod L; the ratio of the crank radius to the length of the connecting rod was λ = R/L, the counterclockwise angle of the crank was θ, and the mass of the slider was m1.
According to Equations (16)–(18), the mass M1 to be added which was required to balance the vertical component of the inertial force FE can be obtained.
In addition, since the assumed center of gravity was located at point D, the whole machine needs to be balanced at both ends of point D. Therefore, it was necessary to add a mass M2 at the tail of the baler.
From Equation (19), the approximate mass M2 of the mass added to the tail of the baler to maintain the balance of the two ends of the machine can be determined.
By dimensional measurement and weight estimation of each part of the baler, the equivalent mass of the slider was 65 kg, the radius of the crank was 265 mm, and the length of the connecting rod was 560 mm. Let a = b = 370 mm, c = 1000 mm, inertial force the angle between the FE and the horizontal direction was 8° for α, and the rotational speed of the crank was 96.5 rpm. Angular velocity was 10.10 rad/s. The angular velocity can be obtained and substituted in Equations (16)–(18) for the vertical component of the equilibrium inertial force FE. The mass of the added mass was M1 = 5 kg.
For the same reason, taking m2 = 500 kg in the substitution Equation (19), the mass of the mass added to the tail of the baler can be adjusted to maintain the balance of the two ends of the machine, M2 = 260 kg, and the final need was at the tail of the baler. Add the total mass of the weights, M = 265 kg. By adding a mass to the tail of the baler, the vibration generated by the baler during operation can be effectively reduced.
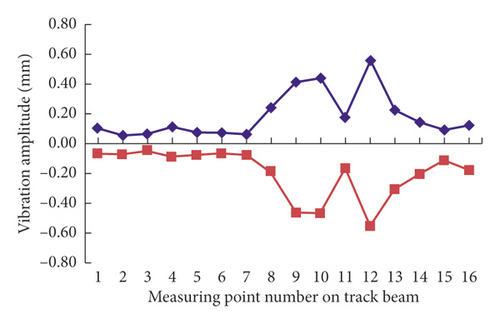
When a counterweight of 265 kg was added at the end of the track chassis, the vibration amplitude results of the 16 measuring points on the track beam in the vertical direction are shown in Table 7.
| Measuring point number | Upward vibration amplitude (mm) | Downward vibration amplitude (mm) | Vibration peak amplitude (mm) | Upper and downward amplitude mean (mm) | Upper and downward amplitude difference (mm) |
|---|---|---|---|---|---|
| 1 | 0.09 | −0.07 | 0.16 | 0.08 | 0.02 |
| 2 | 0.05 | −0.07 | 0.13 | 0.06 | −0.02 |
| 3 | 0.07 | −0.05 | 0.12 | 0.06 | 0.02 |
| 4 | 0.11 | −0.09 | 0.20 | 0.10 | 0.02 |
| 5 | 0.07 | −0.07 | 0.14 | 0.07 | 0.00 |
| 6 | 0.07 | −0.07 | 0.14 | 0.07 | 0.01 |
| 7 | 0.06 | −0.08 | 0.13 | 0.07 | −0.02 |
| 8 | 0.25 | −0.18 | 0.43 | 0.21 | 0.07 |
| 9 | 0.42 | −0.47 | 0.88 | 0.44 | −0.05 |
| 10 | 0.44 | −0.47 | 0.91 | 0.46 | −0.03 |
| 11 | 0.18 | −0.17 | 0.35 | 0.17 | 0.00 |
| 12 | 0.56 | −0.55 | 1.11 | 0.56 | 0.00 |
| 13 | 0.23 | −0.30 | 0.53 | 0.27 | −0.08 |
| 14 | 0.14 | −0.21 | 0.35 | 0.17 | −0.07 |
| 15 | 0.09 | −0.11 | 0.20 | 0.10 | −0.03 |
| 16 | 0.12 | −0.17 | 0.30 | 0.15 | −0.05 |
- The vertical vibration sweeping surface and vibration amplitude change trend line are shown in Figure 18.
According to Table 7, when a counterweight of 265 kg was added at the end of the track chassis, the vibration amplitude of track beam was obviously decreased (Figure 18). The maximum vibration amplitude of track chassis was 0.56 mm, which was significantly smaller that inertial vibration amplitude 7.40 mm. The grounding area of the track beam was significantly increased. The main grounding points of the track were 1–7 points, but the 8–14 points were tiny vibrations. It can be seen that the vibration of the track beam after the weight balance was significantly reduced. It was effective to use the counterweight to control the inertial vibration of track chassis caused by reciprocating motion of the crank slider.

4. Conclusion
- (1)
The self-balancing of the straw compression mechanism was realized by adding two masses to the crank slider straw compression mechanism, and the unbalanced quality existing in the movement of the crank slider mechanism was obtained. The inertial vibration caused by the reciprocating motion of the crank slider eliminates 261.82 kg through the self-balancing weight of the crank slider.
- (2)
The six natural modal frequencies of the piston were 4.62, 17.26, 29.82, 63.85, 83.73, and 141.58 Hz. The relative error of piston experimental mode and finite element simulation result was relatively small, and the maximum relative error was 11.3%. During the reciprocating motion of the piston, the first-order frequency of the piston will be excited by feeding auger excitation frequency of 3.77 Hz and cause the resonance probably.
- (3)
The peak-to-peak vibration amplitude of the measuring points 4–6 was the smallest and stable along the direction of the beam. The vertical vibrates of track beam was based on the measuring point 6 as a fulcrum. By adding a weight of 265 kg at the end of the track chassis, the self-propelled packing machine inertial vibration caused by the reciprocating motion of the crank slider will be completely eliminated.
Conflicts of Interest
The authors declare that they have no conflicts of interest.
Acknowledgments
This research work was supported by the National Natural Science Foundation of China (51705212), Natural Science Foundation of Jiangsu Province (BK20170553), National Key Research and Development Plan (2016YFD0702004), and a project funded by the Priority Academic Program Development of Jiangsu Higher Education Institutions (PAPD).
Open Research
Data Availability
The data used to support the findings of this study are available from the corresponding author upon request.


