A New Feature Extraction Method for Bearing Faults in Impulsive Noise Using Fractional Lower-Order Statistics
Abstract
According to the performance degradation problem of feature extraction from higher-order statistics in the context of alpha-stable noise, a new feature extraction method is proposed. Firstly, the nonstationary vibration signal of rolling bearings is decomposed into several product functions by LMD to realize signal stability. Then, the distribution properties of product functions in the time domain are discussed by the comparison of heavy tails and characteristic exponent estimation. Fractional lower-order p-function optimization is obtained by the calculation of the distance ratio based on K-means algorithms. Finally, a fault feature dataset is established by the optimal FLOS and lower-dimensional mapping matrix of covariation to accurately and intuitively describe various bearing faults. Since the alpha-stable noise is effectively suppressed and state described precisely, the presented method has shown better performance than the traditional methods in bearing experiments via fractional lower-order feature extraction.
1. Introduction
Accurate condition monitoring of the key equipment parts is the main objective of intelligent diagnosis. As the most common and vulnerable support components of rotating machinery, rolling bearings have become the major monitoring objects. Therefore, feature extraction of bearing signals is a decisive factor for intelligent monitoring and diagnosis at present [1, 2].
The dynamic parameters, such as the driving force, damping force, and elastic force of the mechanical system, always demonstrate the nonlinear variation signals, especially during the emergency stage of equipment failure. Their vibration signals are non-Gaussian and nonstationary. Meanwhile, the complexity of institutions makes serious superimposing problems and same frequency interference phenomenon. Thus, the frequency of test signals is difficult to match the faulty frequency.
Aiming at this problem, the adaptive time-frequency analysis method is becoming the research hotspot of the existing vibration signal processing methods [3–5]. By further studying the relevant literatures, we have summarized the main types of traditional features. They include dimensionless parameters and various entropy values in the time domain [6–10], spectrum analysis in the frequency domain [11–14], and adaptive time-frequency analysis in the time-frequency domain [3, 15].
However, the conventional feature statistics usually ignores the distributing models of the adaptive signal components in engineering practice. For example, variance and high-order statistics of signal components are unbounded under alpha-stable noise conditions. Based on this finite statistics, the statistics mentioned above would show degradation performance of state description [16, 17].
Therefore, a new feature extraction method is introduced in this paper. The alpha-stable distribution model and signal processing method LMD are introduced in Sections 2 and 3. On the basis of further investigation of signal component distribution in Section 4, a new feature extraction method in fractional lower order is proposed in Section 5 and comparative analysis in Sections 6 and 7. Section 8 presents the analysis of computational complexity.
This new approach has three steps: First, LMD is chosen as the decomposition method of the nonstationary signals to achieve signal stability. Then, the signal pulse of the alpha-stable noise is effectively reduced by the optimal FLOS and lower-dimensional mapping matrix. Finally, the classification and identification of various faulty bearings are carried out precisely and intuitively. This new method solves the inaccurate description problem of various states in traditional methods by avoiding the infinite variance hypothesis.
2. Fractional Lower-Order Alpha-Stable Distribution
The alpha-stable distribution is an essential part of the non-Gaussian random distribution. The most striking characteristic is many samples far away from the mean value or the median, resulting in more peak pulses on the waveform in the time domain and thicker algebraic tails of those curves of probability density function PDF [18, 19].
The degree of the pulse characteristics is decided by characteristic exponent α. The smaller the value of α, the thicker the tails and the stronger the signal pulse. Figure 1 shows different PDF curves with different values of α. Gaussian distribution is the limiting case with α = 2, when φ(u) = exp{jaμ − σ2∣u∣2}; in addition, when 0 < α < 2, the random variable X is said to have fractional lower-order alpha-stable distribution, including Cauchy distribution (α = 1, β = 0) and Pearson distribution (α = 1/2, β = −1).
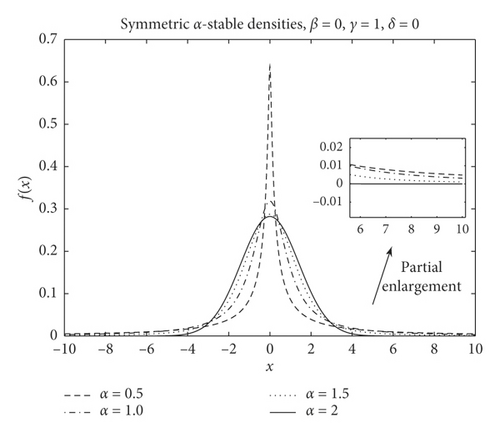
Undoubtedly, it is impossible that the probability density function PDF of fractional lower-order alpha-stable signals has the same convergence property of Gaussian signals. Because of the property of E|X|2 = EX2 = +∞, signal variance Var(X) = E(X2) − (EX)2 is divergent. This is the basic reason for degradation performance of state description and the difficulty of intelligent monitoring of mechanical equipment.
In recent years, the alpha-stable noise and FLOS processing methods have shown better performance than the traditional methods. As a hottest research topic in the field of signal processing, FLOS processing methods have more extensive applicability in the processing of underwater sound, radar signals, and speech signals, time delay estimation, and biomedicine domain, for example, a new diagnosing method of noisy Greek folk music excerpts based on the alpha-stable noise assumption [21], description of various faulty bearing statuses through alpha-stable parameters and kurtosis values [22], a novel fault diagnosis model for axle box bearings based on symmetric alpha-stable distribution feature extraction and LS-SVM [23], the LOD fractional lower order matched filters and improved local optimum detector [24], and analytical parameter estimation by a hierarchical framework based on the skewed alpha-stable characteristic function [25].
3. Nonstationary Signal Processing
Local mean decomposition (LMD) is an adaptive time-frequency analysis method. LMD could solve the shortcomings of traditional methods: the false time-frequency information from the fixed basis functions, a great deal of calculation from the multiparameter optimization, the Heisenberg limitation in the time-frequency domain, and the overenvelope and underenvelope problems of the EMD method. Thus, LMD has potential application in bearing signal processing, becoming the research hotspot of the existing adaptive time-frequency analysis methods [26–30].
Signal components PFi(t) represent the main frequency components of x(t). Combining with the maximum kurtosis criterion, PF1(t) is often chosen as the main feature of the faulty bearings, which may imply abundant bearing fault state information [31].
To a certain extent, the LMD algorithm transforms the feature extraction problem of nonstationary signals into that of stationary components, increasing the description accuracy and reliability of various equipment states.
4. Analysis of Time-Domain Distribution Characteristics
However, when the noise is impulsive and modeled as a non-Gaussian process, variance and second- and higher-order statistical characteristics of PF1(t) are infinite. This may reduce the accuracy and reliability of above statistics for the description of equipment states.
In order to investigate the distribution characteristics of bearing vibration signals, Yu et al. had contrasted the validity of the proposed statistical models [32]. It can be concluded that the alpha-stable distributed model is sufficient to thoroughly describe the statistical characteristics of faulty bearing signals with impulsive behaviors. In this paper, we have researched the noise-reducing ability of LMD in terms of tail heaviness and characteristic exponent α values of PF components.
4.1. Analog Vibration Signals
The vibration signals S1 and S2 are processed through the LMD algorithm to calculate the frequency function PDF of PF1(t). Figure 2 shows the comparison of PDF tail heaviness.
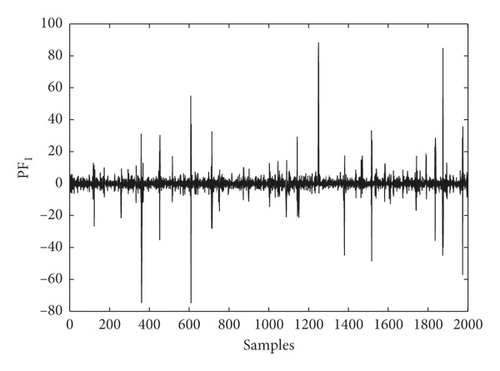
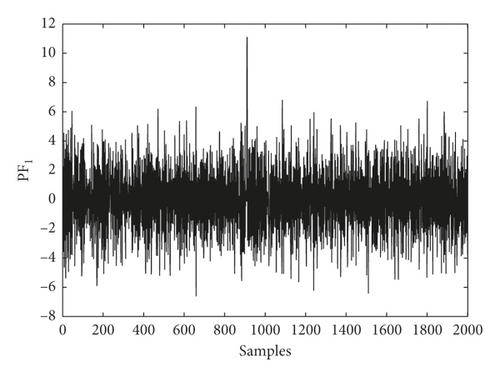
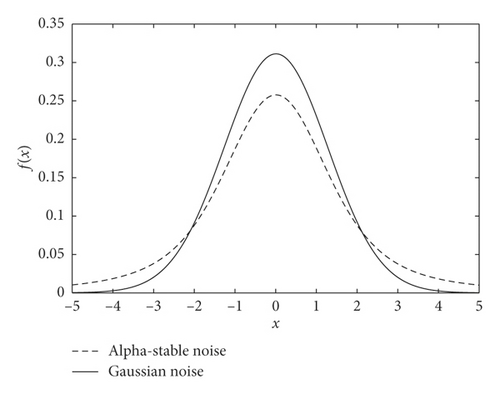
It is clear that PF1(t) of S1 has more evident pulse characteristics and thicker algebraic tails than that of S2. This phenomenon proves the fact that LMD cannot effectively deal with the alpha distributed noise. The PDF tail still shows the characteristics of alpha distribution. Therefore, the adaptive time-scale decomposition of vibration signals exhibits a performance degradation problem.
4.2. Actual Vibration Signals
SKF6205-2RS bearing database from Case Western Reserve University is used as an example to study the distribution properties of the practical bearing signal component PF1(t). This database includes normal bearings and faulty bearings with three faulty degrees ((a) 0.178 mm, (b) 0.356 mm, and (c) 0.533 mm): (A) normal condition, (B) rolling ball fault, (C) inner race fault, and (D) outer race fault. We record this database as X = {A, M.n}, where M.n represents the fault state M with the fault size n. It is clear that M ∈ {B,C,D} and n ∈ {a,b,c}. In this test, the rotational frequency fr = 29.167 Hz, the sampling frequency fs = 12000 Hz, the sample length Nh = 1024, and the number of samples N = 117.
The most striking characteristic of the alpha-stable distributed signals is more peak pulses in the time domain and thicker algebraic tails of probability density function PDF. As shown in Figure 3, the dotted lines present the PDF tail heaviness of faulty bearing components PF1(t) and the full lines of Gaussian components PF1(t) (with the same parameters except characteristic exponents α). It can be seen that the PDF curve of normal bearings has a thicker tail than the Gaussian curve, meaning that the background noise obeys the fractional lower-order alpha distribution. In this context, both the faulty vibration signals display the same characteristics, including rolling ball fault, inner race fault, and outer race fault.
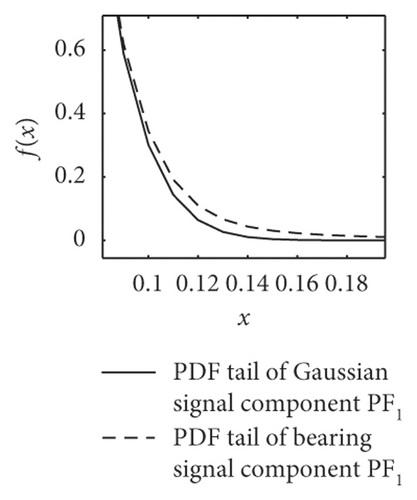
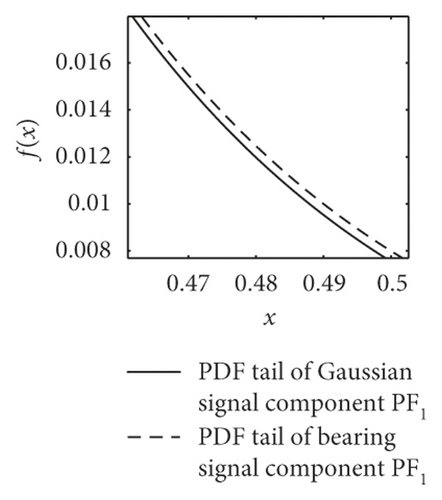
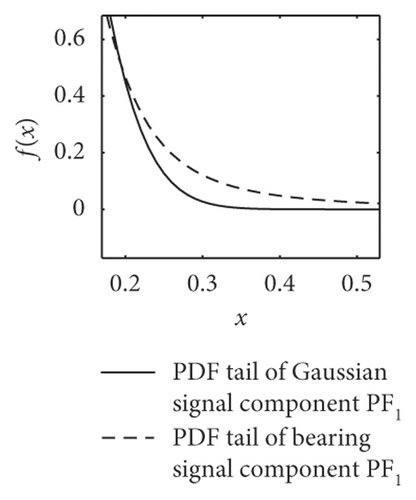
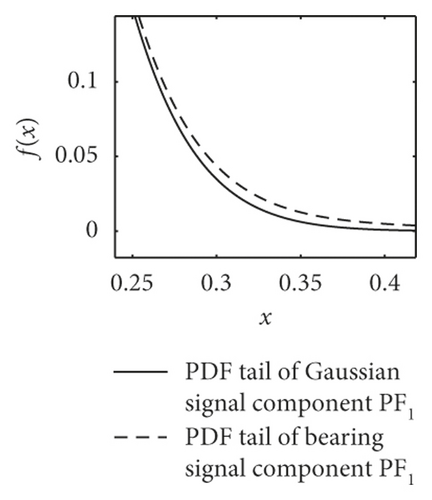
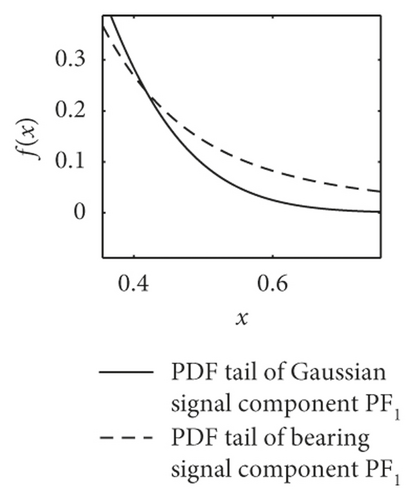
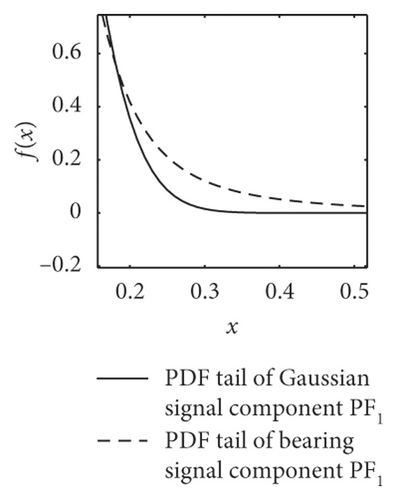
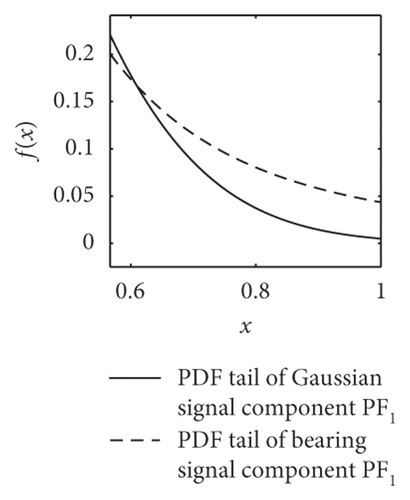
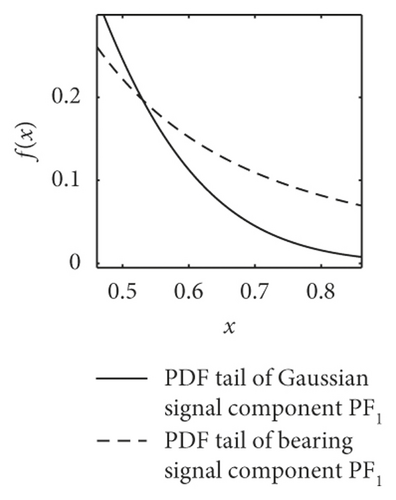
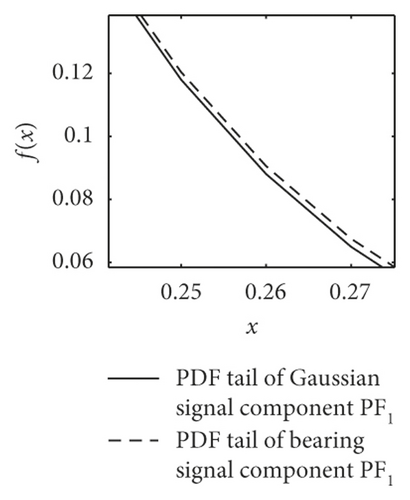
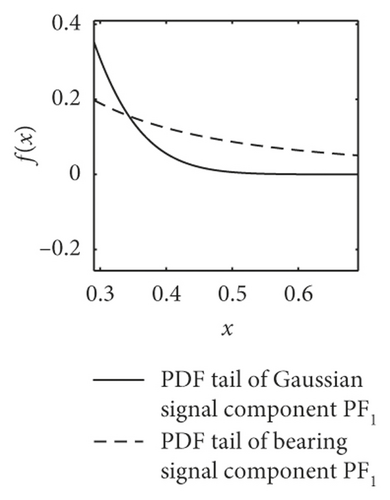
Furthermore, the mean values of characteristic exponents α of PF1(t) components are estimated by the Koutrouvelis regression method, as shown in Table 1 [34]. It can be seen that the corresponding characteristic exponents α of the bearings are distinguished obviously. The value of rolling ball fault is in the range of 1.61–1.99, the inner race fault is in 1.43–1.53, and the outer race fault, except for D.b samples, is in 1.01–1.2. This phenomenon basically accords with the change law of PDF tails in Figure 3.
| Samples | A | B.a | B.b | B.c | C.a | C.b | C.c | D.a | D.b | D.c |
|---|---|---|---|---|---|---|---|---|---|---|
| Mean values | 1.8971 | 1.9970 | 1.6187 | 1.9679 | 1.5221 | 1.5363 | 1.4333 | 1.1703 | 1.9899 | 1.0081 |
- (1)
There is no doubt that the alpha-stable distributed noise exists in the vibration signals under both normal and fault conditions.
- (2)
When the noise is impulsive and modeled as a non-Gaussian process, PF1(t) components fail to describe the vibration signals accurately, which has been a major drawback to the use of LMD.
Therefore, using the fractional lower-order features is more adaptive than the conventional second- and higher-order statistical moments to describe various signal states, effectively avoiding the invalid hypothesis.
5. Fractional Lower-Order Characteristics of Bearing Vibration Signals
Due to the impulsive noise and the nonstationary property, a fractional lower-order feature extraction method is introduced in this study. This new method adopts LMD to realize signal stability and obtains signal components with impulsive characteristic in the time domain. Then, the alpha-stable noise is weakened by the optimal fractional lower-order statistics (FLOS) and lower-dimensional mapping matrix. Finally, the feature matrix is constructed to effectively suppress the impulsive noise and accurately describe the equipment operational conditions. The algorithm flow is as follows (Figure 4).

5.1. The Optimal FLOS
The range of i is i ∈ {1,2, …, N} and j is j ∈ {1,2, …, J}. Here, N is the number of sample groups and J is the number of state types. Then, the best clustering center (x1, x2, …, xJ) of each state type is obtained by the K-means clustering algorithm. Finally, we could calculate the distance between Ei,j(p) and (x1, x2, …, xJ) in order to obtain the class separation distance Db and intraclass distance Di of each sample. At last, the optimal order popt could be selected by the maximum distance ratio .
5.2. Lower-Dimensional Mapping Matrix of Covariation
Under certain conditions, the validity is similar to the covariance of the random variables of Gaussian signals, which could strengthen the common components of the signals to a certain extent. For the high-dimensional covariant matrix, the Laplacian eigenmaps algorithm is used to carry out the lower-dimensional mapping matrix. LE is suitable for nonlinear feature mining and dimensionality reduction of high-dimensional data, based on the principle that “the weight of the connection edge between the subgraphs is as low as possible and the weight of the connection edge in the subgraph is as high as possible.” Finally, it could easily realize the optimal embedding of high-dimensional manifolds by the mapping theory.
6. Feature Accuracy Comparisons
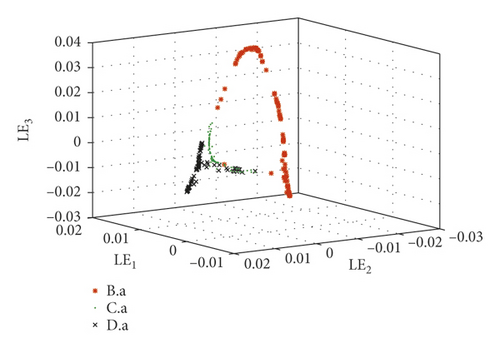
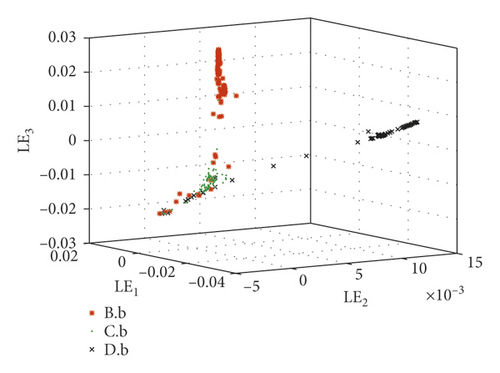
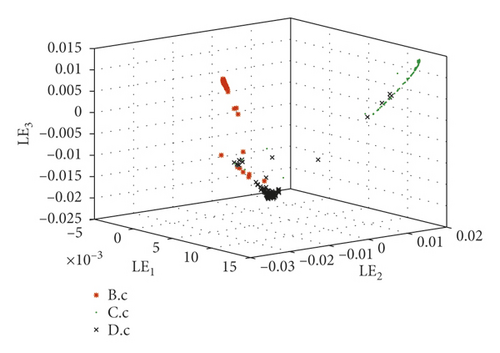
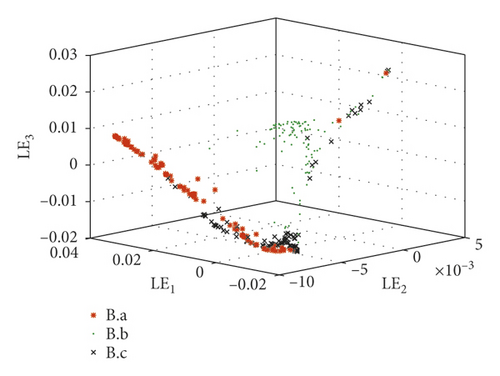
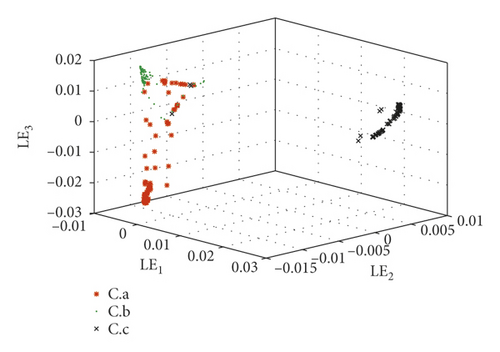
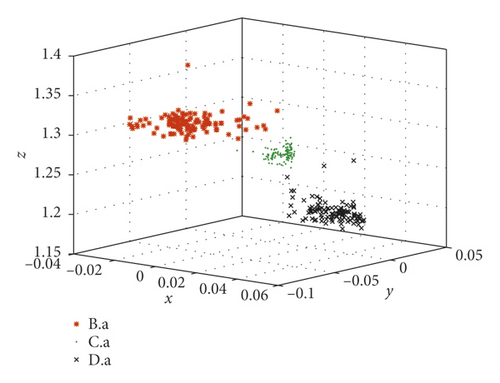
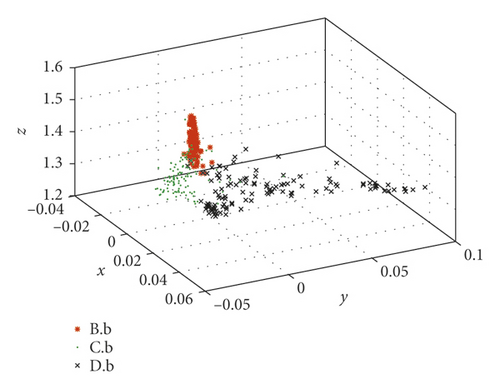
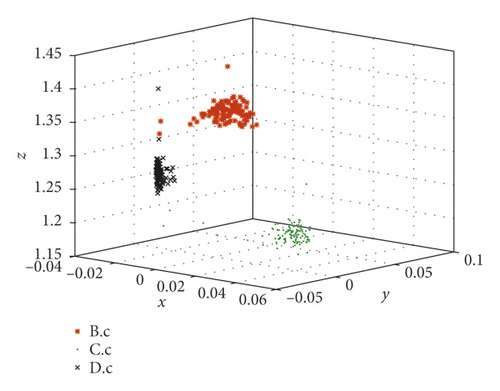
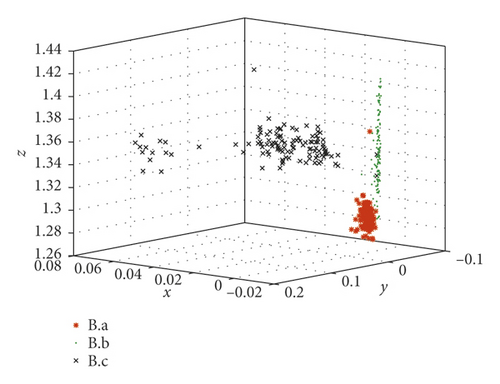
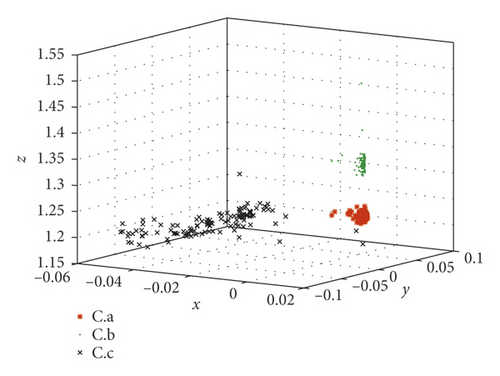
Take the SKF6205-2RS bearing signals as an example to compare the fractional lower-order features proposed in this paper with the multidimensional features in reference [30]. In reference [30], the same bearing signals, SKF6205-2RS bearing signals from the Case Western Reserve University Bearing Data Center, were processed by the same method LMD. Then, 23 conventional features such as variance, skewness, and kurtosis were considered to describe the status of bearings. As we know, they belong to second- and high-order statistics. The difference between reference [30] and this paper is the calculation of mapping matrix of PF1(t). They are calculated from 23-dimensional time-domain characteristics in reference [30] and fractional low-order features proposed in this paper, respectively. Faulty bearing samples are divided into 6 groups in Table 2.
| No. | Groups | Description |
|---|---|---|
| 1 | X = {M.n|M = B,C,D, n = a} | Three fault types in fault size a |
| 2 | X = {M.n|M = B,C,D, n = b} | Three fault types in fault size b |
| 3 | X = {M.n|M = B,C,D, n = c} | Three fault types in fault size c |
| 4 | X = {M.n|M = B, n = a, b, c} | Rolling fault in different sizes |
| 5 | X = {M.n|M = C, n = a, b, c} | Inner race fault in different sizes |
| 6 | X = {M.n|M = D, n = a, b, c} | Outer race fault in different sizes |
The range of parameter p is determined according to the minimum value of α. Take the variation of p as 0.1 and calculate the ratio value of . As shown in Table 3, the maximum ratio is 319.68 when the value p = 0.1.
| p | Ratio |
|---|---|
| 0.1 | 319.68 |
| 0.2 | 288.63 |
| 0.3 | 85.61 |
| 0.4 | 253.99 |
| 0.5 | 195.63 |
| 0.6 | 126.25 |
| 0.7 | 205.08 |
The covariation matrices CN×N of components PF1(t) are calculated according to formula (7). Taking CN×N to be the input matrix, we construct the Laplace characteristic matrix to enhance the fault components. Thus, we could obtain the lower-dimensional mapping matrix of each type of samples.
- (1)
The extracted features are constructed by just two types of statistics which are much fewer than those in reference [30].
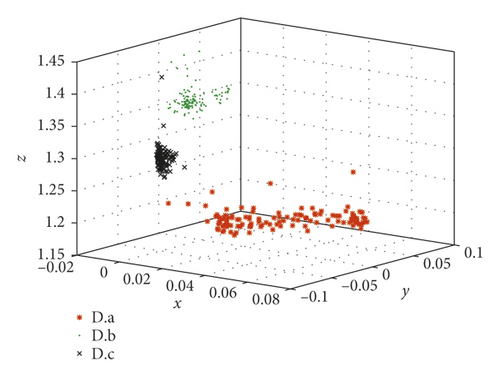
- (2)
These fault set samples are absolutely separated by the new features. It is proved that the fractional lower-order feature extraction proposed in this paper is more accurate for different state descriptions.

7. Feature Extractions of Form Roller Bearings
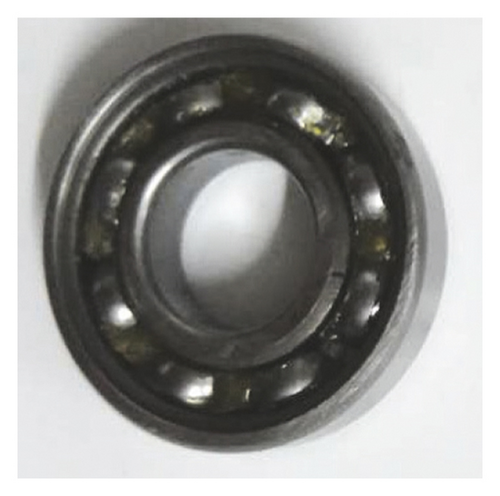
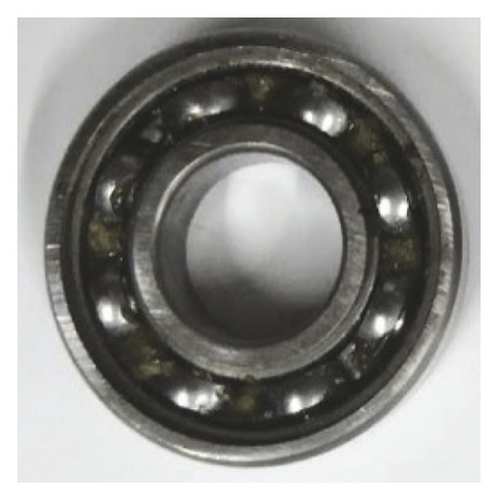
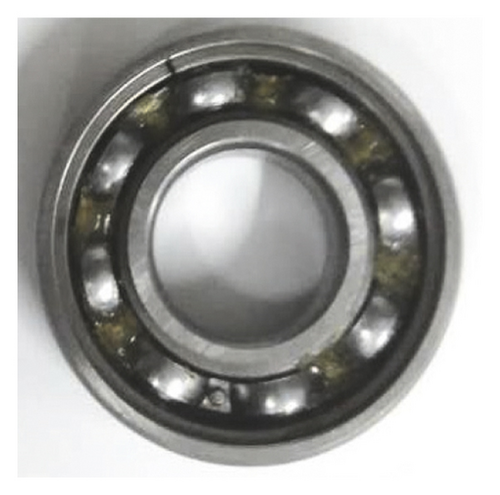
Offset printing press is a piece of high-precision industrial equipment that is designed to reproduce text and image at a high rate of speed and low cost. Accurate ink transfer is completed through the inking system and three-cylinder printing system. Form rollers ensure that the ink will uniformly overprint the image area of the plate. When their supporting bearing fails, it may cause oversize printing dots and inferior quality. Figure 7 shows different states of 6001 bearings. We had processed the inner race fault and outer race fault by line cutting. The fault sizes are 0.1 mm and 0.3 mm.
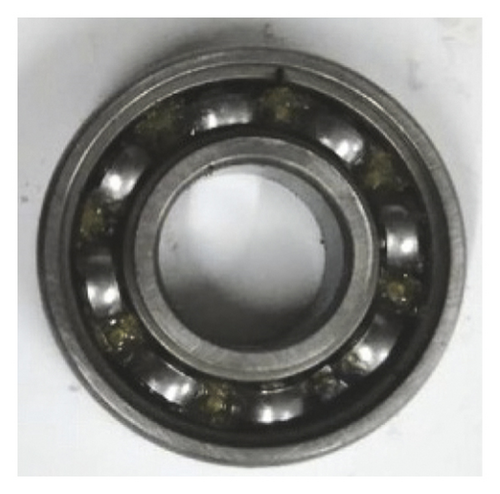
LMS test lab system is used to test and store the vibration signals of 6001 bearings (with the outer ring fixed). The model of acceleration sensors is PCB 333B30 (range is ±50 g and sensibility is 99.3 mV/g). In this real test, the rotational frequency of the form roller fr = 4 Hz, the sampling frequency fs = 6400 Hz, the sample length Nh = 2048, and the number of samples N = 190.
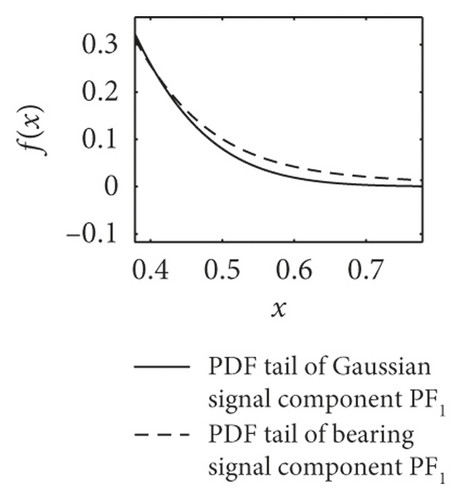
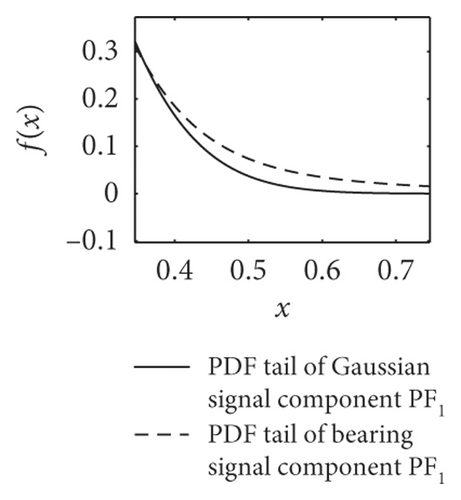
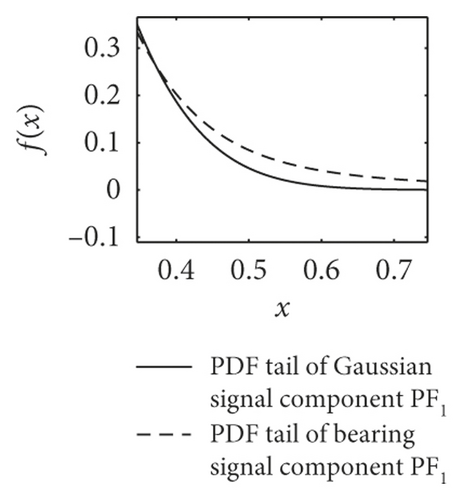
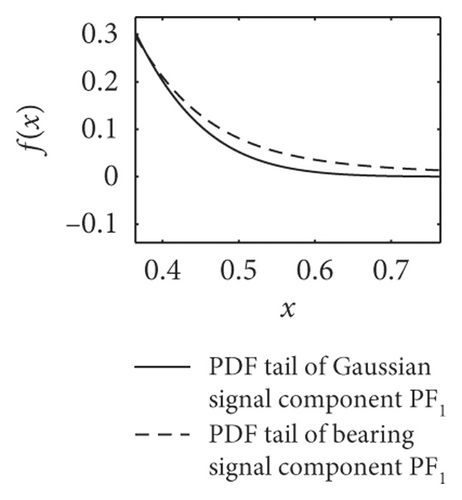
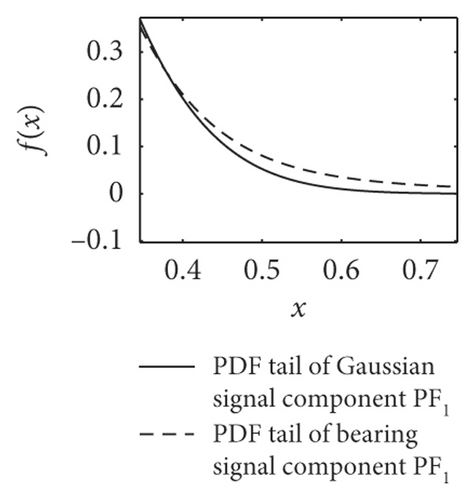
PDF curve comparison of normal and faulty signal components PF1(t) is shown in Figure 8. Table 4 shows the mean estimation of characteristic exponent α. It could easily prove that the alpha-stable distributed noise exists in the vibration signals of form rollers, and signal components PF1(t) yield the fractional lower-order alpha-stable distribution.
| Sample | Normal | Inner race 0.1 mm | Inner race 0.3 mm | Outer race 0.1 mm | Outer race 0.3 mm |
|---|---|---|---|---|---|
| Mean | 1.8192 | 1.7555 | 1.7307 | 1.7970 | 1.7960 |
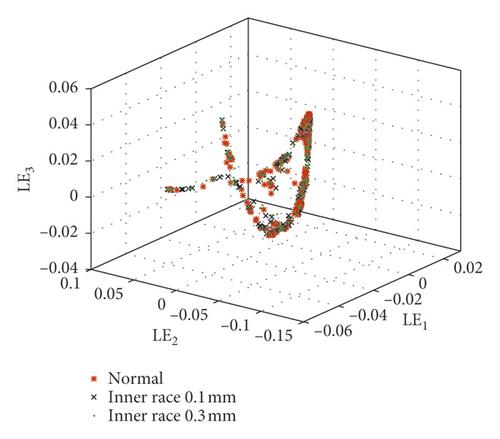
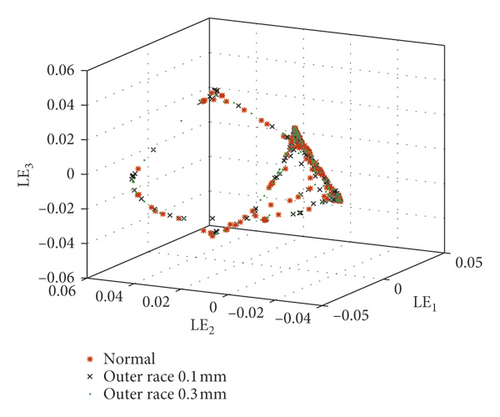
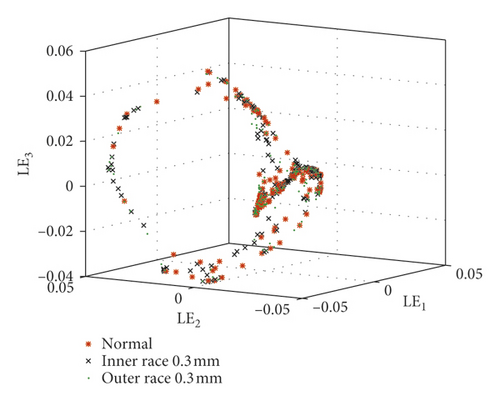
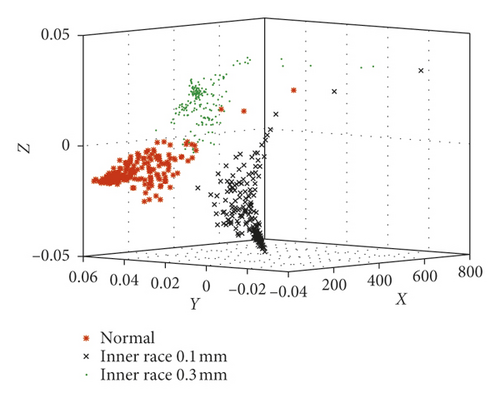
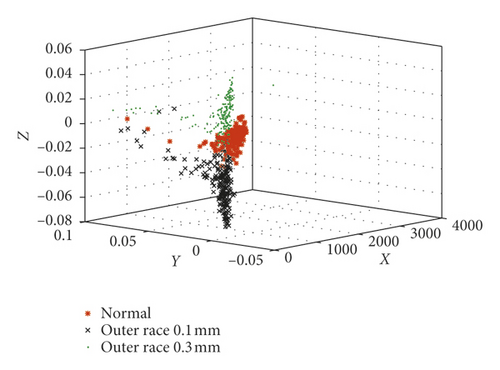
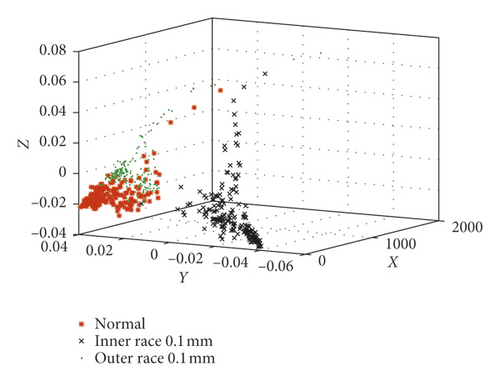
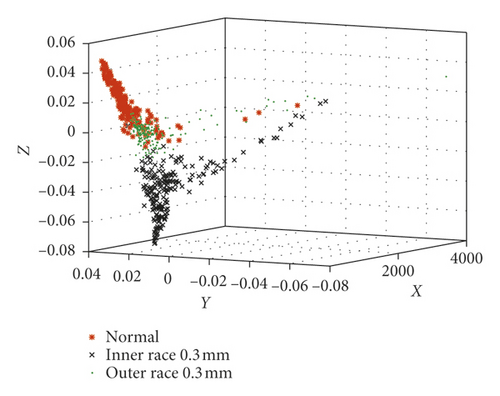
In order to fully compare and analyze the characteristics of each sample, these five kinds of bearing samples are divided into four groups in Table 5. Then, the optimal FLOS and mapped covariation matrices are calculated by algorithm flow in Figure 4 and formulas (5)–(9). Finally, fractional lower-order features are constructed to classify different fault types through 3D scattered plots. Figures 9 and 10 show the 3D scattered plots of the mapping matrix from 23-dimensional features in reference [30] and fractional lower-order features proposed in this paper. Lowercase roman letters (a)–(d) represent sample groups 1–4, respectively. In consideration of chaotic and rambling form bearing samples in Figure 9, the traditional feature extraction method degrades obviously in actual equipment status monitoring. On the contrary, with fractional lower-order noise suppressed by the new method in Figure 10, this vibration samples are distinguished much clearer in the three-dimensional space.
| No. | Description |
|---|---|
| 1 | Normal, inner race fault 0.1 mm, and inner race fault 0.3 mm bearings |
| 2 | Normal, outer race fault 0.1 mm, and outer race fault 0.3 mm bearings |
| 3 | Normal, inner race fault 0.1 mm, and outer race fault 0.1 mm bearings |
| 4 | Normal, inner race fault 0.3 mm, and outer race fault 0.3 mm bearings |

8. Analysis of Computational Complexity
Tables 6 and 7 show the computational complexity of programs. O(•) represents the time complexity of each algorithm. Here, l is the length of parameter p with the variation as 0.1. h is the iteration number of clustering centers. d is the complexity of distance calculation. t(23,3) is the complexity of the LE program in the reference, which has changed the dimension from 23 to 3. In a parallel manner, t(N, 2) represents the complexity of dimensional optimization from N to 2 via the LE program. It is obvious that O(max(J × Nh × N × l, N × l × h × d)) > O(J × Nh × N) and O(max(J∗Nh∗N2, t(N, 2))) > O(t(23,3)). The running time is almost three times that of the comparison method in reference [30]. This phenomenon indicated that the proposed method is more complex.
| Program | Calculation of 23-dimensional features | Feature optimization program of 23-dimensional features | Running time (s) (SKF6205-2RS) | Running time (s) (6001) |
|---|---|---|---|---|
| Method in reference [31] | O(J × Nh × N) | O(t(23,3)) | 21.227 | 43.729 |
| Program | Calculation of the optimal FLOS | Feature optimization program of covariation | Running time (s) (SKF6205-2RS) | Running time (s) (6001) |
|---|---|---|---|---|
| Proposed method | O(max(J × Nh × N × l, N × l × h × d)) | O(max(J∗Nh∗N2, t(N, 2))) | 69.711 | 158.839 |
Significantly, this paper focuses on the description accuracy of bearing status. Figures 5 and 6 have shown the advantages of the proposed method in terms of description accuracy. Then, monitoring people could autonomously choose the adequate method according to time tolerance or description accuracy.
9. Conclusions
In this paper, a kind of fractional lower-order feature extraction method is specifically introduced so as to solve the degradation problem of conventional methods. According to the optimal FLOS and low-dimensional mapping matrix, the equipment operational conditions are described precisely and effectively.
- (1)
The mixed vibration signal of the operation is an important class of α-stable distributed signals. On the basis of the aforementioned fact, the signals of faulty bearings, including rolling ball fault, inner race fault, and outer race fault, yield the characteristics of alpha-stable distribution.
- (2)
When the noise is impulsive and modeled as a non-Gaussian process, the LMD algorithm does not process the vibration signals effectively for impulsive noise still existing in PF components. Especially in the actual equipment status-monitoring process, the noise interference in conventional methods becomes more obvious.
- (3)
The improved performance is clearly demonstrated both theoretically and experimentally. In comparison with traditional methods related to Gaussian models, fractional lower-order features make more accurate description of bearings status. Monitoring people could autonomously choose the adequate method according to time tolerance or description accuracy.
This new method gives more insight into the distribution characteristics of the adaptively decomposed PF components. The present work could be applied to feature extraction of all signal components, and it would provide a certain theoretical support for further study of intelligent monitoring and diagnosis of the whole machine.
Conflicts of Interest
The authors declare that they have no conflicts of interest regarding the publication of this paper.
Acknowledgments
This work was supported by the National Natural Science Foundation of China (No. 51275409), the National Science Foundation for Young Scientists of China (No. 51305340), and the Natural Science Project of Shaanxi Provincial Department of Education (No. 17JK0545).
Open Research
Data Availability
Data related to this paper have been given in Supplementary Materials. The SKF6205-2RS bearing fault database from Case Western Reserve University is from “http://csegroups.case.edu/bearingdatacenter/home.” Form roller bearing vibration data are from the offset printing press PZ650.


