Calibration of Numerical Simulation Methods for Underwater Explosion with Centrifugal Tests
Abstract
The centrifugal underwater explosion tests and corresponding numerical simulations were carried out to study the laws of shock wave and bubble pulsation. A semiempirical method to determine JWL state equation parameters was given. The influence on numerical results caused by factors such as state equation of water, boundary condition, and mesh size was analyzed by comparing with the centrifugal underwater explosion test results. The results show that the similarity criterion is also suitable in numerical simulation; the shock wave peak pressure calculated by polynomial state equation is smaller than that of shock state equation. However, the maximum bubble radius and the pulsation period calculated by the two equations are almost the same. The maximum bubble radius is mainly affected by the boundary simulating the test model box, and the pulsation period is mainly affected by the artificial cutoff boundary. With the increase of standoff distance of measuring point, the mesh size required for the numerical calculation decreases; the size of the two-dimensional model is recommended to take 1/30 ∼ 1/10 explosion radius. In three-dimensional models, when mesh size is 2 times larger than explosion radius, the bubble motion change in the second pulsation period is not obvious. When mesh size is smaller than 1 time explosive radius, the full period of bubble pulsation can be well simulated, but calculation errors increase slowly and computation time greatly increases, so the three-dimensional mesh size is suggested to take the charge radius. Shock wave peak pressure is basically unaffected by gravity. As the gravity increases, the bubble maximum radius and the first pulsation period both decrease.
1. Introduction
Underwater explosion plays a vital role in military and civil construction. The load of underwater explosion mainly consists of two parts: shock wave and bubble pulsation, each of which accounts for about 50% of the total energy of explosion [1]. Researches of underwater explosion are mostly focused on these two aspects. There are two kinds of test methods widely used to study underwater explosion in the beginning of study, so called small equivalent charge explosion tests [2, 3] and mechanism tests [4–7]. In recent years, the two tests have also been highly developed. Zhang et al. [8] used the small charge explosion to study bubble dynamics with the technology of high-speed camera. Zhang et al. [9] studied the bubble motion near a raised free boundary in the small charge explosion test. However, the effects of buoyancy and gravity need to be ignored in most small equivalent charge explosion tests and mechanism test studies. Gel’Fand and Takayama [10] pointed out that, in the underwater explosion test, the shock wave can ignore the gravity effect but the bubble pulsation must consider that. According to the similarity criterion of underwater explosion model tests [11], Mach and Froude similitudes can be achieved simultaneously only when the gravity effect is considered. So, the centrifugal test is a good way to study underwater explosion. The China Institute of Water Resources and Hydropower Research has conducted some underwater explosion tests in centrifuge, and some of the test results can be found in references [12–14]. The similarity criterion and the laws of shock wave and bubble pulsation with the change of centrifugal acceleration were given.
Numerical simulation is a more convenient method to study underwater explosion problem. However, the accuracy is deeply affected by some factors such as state equation of water, boundary condition, and mesh size. Some studies have been conducted for numerical influence factors. Li et al. [15] analyzed different state equations of water in theory, proposed the applicable range of each state equation, and verified the theoretical results by numerical simulation. Chisum and Matsumoto [16, 17] studied the bubble pulsation by finite element software called MSC.DYTRAN. They pointed out that the pulsation period, the bubble center position, and the bubble deformation were deeply affected by the boundary condition in the first bubble period. Mu et al. [18] summarized the influence of different boundary conditions on bubble and proposed the range that the bubble can be regarded as spherical shape. Shi et al. [19] compared the numerical results of the shock wave specific impulse and peak pressures under different mesh sizes in air explosion models and presented a method to reduce the error caused by the mesh size. Zhang et al. [20] summarized a method to determine the mesh size through air and underwater explosion numerical simulation. However, there is a huge gap between experimental and numerical methods up to date. Many numerical researches lack the experimental verification. Calibration of numerical simulation methods for underwater explosion with test results is needed.
In this paper, the centrifugal underwater explosion tests of spherical explosive RDX were introduced, and the corresponding numerical simulations were conducted. In the process of numerical simulation, the calibration of the similarity criterion in numerical simulation was conducted, and a method to determine parameters of the JWL state equation was given. On the basis of 1g RDX explosive underwater explosion tests, different finite element models were used to study the influences of various factors, including the state equation of water, the boundary condition, and the mesh size. Finally, combining the numerical results of the optimal numerical model and centrifugal underwater explosion test results, some rules of shock wave and bubble pulsation were summarized.
2. Centrifugal Model Experiments of Underwater Explosion
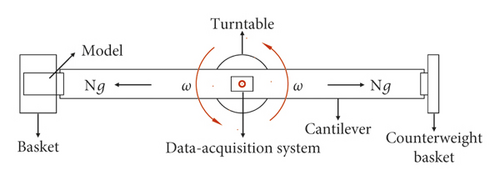
The underwater centrifugal explosion tests were performed on LXJ-4-450 centrifuge (Figure 1) in IWHR laboratory (the China Institute of Water Resources and Hydropower Research). The centrifuge can provide a maximum acceleration of 300g, which has a maximum rotation radius of 5.03 m and payload of 1.5 t. The dimensions of the centrifugal basket are 1500 × 1000 × 1500 mm. The centrifugal basket and model placed in it gradually become horizontal when rotating. Therefore, a centrifugal acceleration Ng, which is dozen times larger than the gravity acceleration, is formed along the cantilever direction. Neglecting the earth gravity and assuming the centrifugal acceleration remaining uniform, the small-scale model will have same gravity field as the prototype.

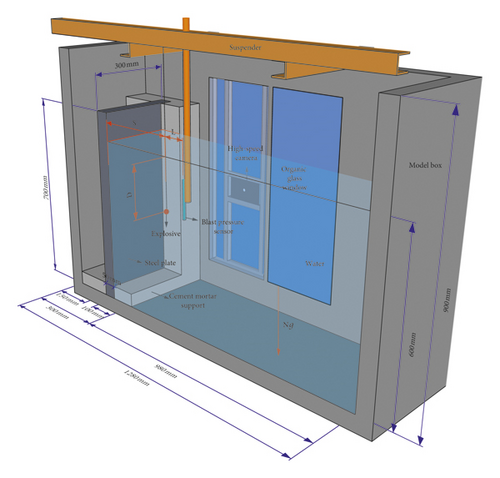
As shown in Figure 2, the test model container has a size of 1280 × 720 × 900 mm and is made of aluminum alloy. On the side of the container, there is an organic glass observation window, near which the high-speed camera (FASTCAM-ultima APX) is placed to capture the bubble. The high-speed camera has a frequency of 2000 fps and resolution of 1024 × 1024. The dimension of the steel plate is 700 × 600 × 50 mm, which is fixed by a cement mortar support with thickness of 50 mm. It is used to study the dynamic responses of the structure caused by underwater explosion, which is only regarded as the shell of model container in this paper. The explosive is in the same longitudinal plane and underwater depth D as the water pressure sensor (ICP138A25). The depth of water in the model box is 600 mm. All data are collected through a system with 32 acquisition channels on the top of the centrifugal shaft. The test cases are shown in Table 1, and it includes the different distances between the explosive and the sensor L and the distance between the explosive and the steel plate S.
| No. | Ng | W (g) | D (mm) | S (mm) | L (mm) | Filmed | Pm (MPa) | Rm (mm) | T (ms) |
|---|---|---|---|---|---|---|---|---|---|
| UE-Exp-01 | 40 | 1.010 | 300 | 150 | 175 | 36.98 | |||
| UE-Exp-02 | 40 | 1.024 | 300 | 250 | 250 | 25.46 | |||
| UE-Exp-03 | 40 | 1.015 | 300 | 200 | 300 | 21.49 | |||
| UE-Exp-04 | 40 | 1.023 | 300 | 300 | 350 | √ | 17.61 | 131.25 | 18 |
| UE-Exp-05 | 40 | 1.025 | 300 | 300 | 350 | √ | 18.21 | 131.52 | 18.5 |
| UE-Exp-06 | 20 | 1.020 | 300 | 300 | 350 | √ | 19.43 | 141.26 | 24 |
| UE-Exp-07 | 30 | 1.021 | 300 | 300 | 350 | √ | 18.30 | 134.17 | 21 |
| UE-Exp-08 | 50 | 1.038 | 300 | 300 | 350 | √ | 19.35 | 123.67 | 16.5 |
| UE-Exp-09 | 20 | 1.016 | 200 | 200 | 300 | 20.20 | |||
| UE-Exp-10 | 40 | 1.040 | 200 | 200 | 300 | 21.29 | |||
| UE-Exp-11 | 1 | 0.050 | 300 | 300 | 350 | √ | 3.5 | 62.4 | 11.5 |
| UE-Exp-12 | 20 | 0.050 | 300 | 300 | 350 | √ | 3.47 | 53.3 | 8.5 |
| UE-Exp-13 | 30 | 0.050 | 250 | 300 | 354 | √ | 3.08 | 49.6 | 7.5 |
| UE-Exp-14 | 40 | 0.050 | 300 | 300 | 350 | √ | 4.99 | 45.6 | 6.0 |
| UE-Exp-15 | 20 | 0.150 | 375 | 300 | 358 | 4.98 | |||
| UE-Exp-16 | 40 | 0.150 | 300 | 300 | 350 | √ | 3.31 | 69.6 | 9.5 |
- Note. Pm is the shock wave peak pressure, Rm is the maximum bubble radius in the first pulsation period, and T is the size of the first bubble pulsation period.
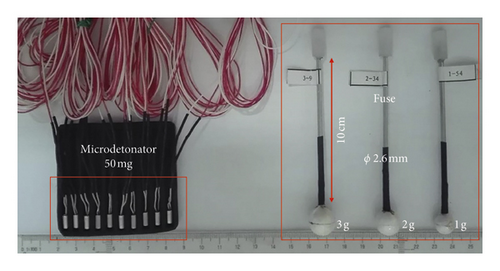
In order to improve the accuracy of model tests, the explosive used was a self-made RDX spherical explosive, and it took the way of a central detonation. The microdetonator detonates the detonating fuse, and then, the detonating fuse detonates the center of the charge. RDX spherical explosives and microdetonators are shown in Figure 3. The RDX spherical explosive consists of two separated hemispherical explosives. The 10 cm long detonating fuse with diameter of 2.6 mm has a dose (TNT equivalent) of 48 mg/m, and the dose of a microdetonator (RDX equivalent) is 50 mg. Sleeve, heat shrinkable tube, and plastic wrap are added to reinforce and protect the entire detonating device. The explosive has a density of 1.65 g/cm3 and a detonation velocity of 8160 m/s. As shown in Table 1, UE-Exp-11∼14 are underwater explosion test cases caused by a single 50 mg detonator, while UE-Exp-15∼16 are caused by three 50 mg detonators in series, which is used to simulate a 150 mg detonator.

3. Similarity Criterion for Centrifuge Underwater Explosion Tests
The similarity criterion is the theoretical basis of underwater explosion model test, which can be easily deduced by the tool of dimensional analysis. References [11, 13] have been given more elaborate research. The rationality of the similarity criterion also has been calibrated by a series of centrifugal underwater explosion tests [11].
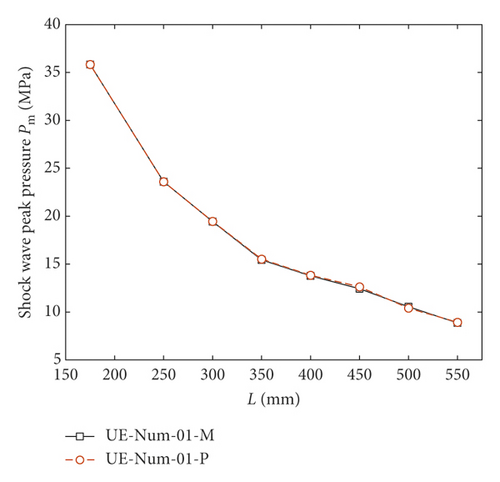
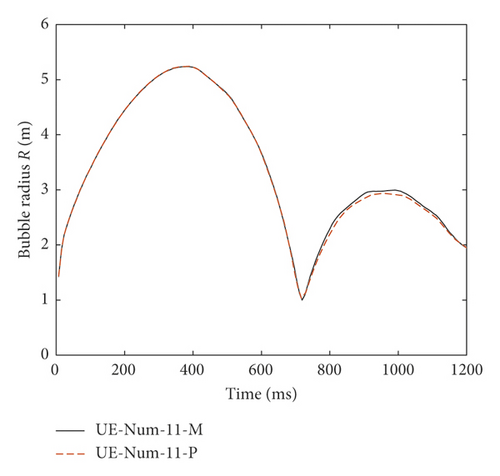
Table 2 lists the centrifugal similarity relation between the prototype and the model. Actually, the similarity criterion can also be deduced by balance and state equations and can automatically be satisfied in numerical simulation. This can be verified by two simple calculations (UE-Num-01 and UE-Num-11 in Table 3). The UE-Num-01 was used to calculate the shock wave, while the UE-Num-11 was used to calculate the bubble pulsation. The prototypes of the UE-Num-01 and UE-Num-11 were created through the similarity relation in Table 2. As it can be seen in Figure 4, the calculated variation of the shock wave peak pressure and the bubble radius are almost the same.
| Parameters | Dimension | Prototype | Model | Scale |
|---|---|---|---|---|
| Explosive mass | M | W | λ3W | λ3 |
| Explosive radius | L | Re | λRe | λ |
| Standoff distance | L | λL | ||
| Bubble radius | R | λR | ||
| Depth of explosive | D | λD | ||
| Time constant | T | θ | λθ | λ |
| Period | T | λT | ||
| Gravity acceleration | LT−2 | g | g/λ | λ |
| Water destiny | ML−3 | ρ0 | ρ0 | 1 |
| Explosive destiny | ρe | ρe | ||
| Atmosphere pressure | ML−1T−2 | P0 | P0 | 1 |
| Shock wave peak pressure | Pm | Pm | ||
| Flow velocity of water | LT−1 | μp | μp | 1 |
| Sound velocity | C0 | C0 | ||
| Detonation velocity | U | U | ||
| Explosive energy per unit mass | ML2T−2 | E | E | 1 |
| No. | Symmetry | Ng | SEW | Mesh sizes (mm) | Boundary 1 | Boundary 2 |
|---|---|---|---|---|---|---|
| UE-Num-01 | 2D | 40 | Shock | 0.5 | Flow out | Rigid |
| UE-Num-02 | 2D | 40 | Polynomial | 0.5 | Flow out | Rigid |
| UE-Num-03 | 2D | 40 | Shock | 0.5 | Flow out | STEEL 4340 |
| UE-Num-04 | 2D | 40 | Shock | 0.5 | Rigid | Rigid |
| UE-Num-05 | 2D | 40 | Shock | 0.5 | Rigid | STEEL 4340 |
| UE-Num-06 | 2D | 20 | Shock | 0.5 | Flow out | Rigid |
| UE-Num-07 | 2D | 30 | Shock | 0.5 | Flow out | Rigid |
| UE-Num-08 | 2D | 50 | Shock | 0.5 | Flow out | Rigid |
| UE-Num-09 | 3D | 20 | Shock | 5 | Flow out | Rigid |
| UE-Num-10 | 3D | 30 | Shock | 5 | Flow out | Rigid |
| UE-Num-11 | 3D | 40 | Shock | 5 | Flow out | Rigid |
| UE-Num-12 | 3D | 40 | Shock | 5 | Flow out | STEEL 4340 |
| UE-Num-13 | 3D | 40 | Shock | 5 | Rigid | Rigid |
| UE-Num-14 | 3D | 40 | Shock | 5 | Rigid | STEEL 4340 |
| UE-Num-15 | 3D | 50 | Shock | 5 | Flow out | Rigid |
| UE-Num-16 | 3D | 50 | Shock | 5 | Flow out | STEEL 4340 |
| UE-Num-17 | 3D | 50 | Shock | 5 | Rigid | Rigid |
| UE-Num-18 | 3D | 50 | Shock | 5 | Rigid | STEEL 4340 |
| UE-Num-19 | 3D | 50 | Polynomial | 5 | Flow out | Rigid |
| UE-Num-20 | 3D | 50 | Shock | 5 | Flow out | Rigid |
| UE-Num-21 | 3D | 50 | Shock | 5 | Flow out | Rigid |
| UE-Num-22 | 3D | 50 | Shock | 5 | Flow out | Rigid |
- Note. SEW is the state equation of water.
4. Numerical Simulation of Underwater Explosion
Among the available commercial finite element packages such as ANSYS LS-DYNA, ABAQUS, ANSYS AUTODYN, and MSC DYTRAN, ANSYS AUTODYN is a nonlinear explicit finite difference software with many solvers such as Lagrange, Euler, ALE (arbitrary Lagrange–Euler), Shell, and SPH, among whom coupling calculations can be performed, so that the high-order nonlinear problems caused by the interaction of solids, gases, and fluids can be addressed, and it can also solve the large deformation problems, such as explosive expansion and bubble pulsation involved in underwater explosion. ANSYS AUTODYN has good computational stability and provides material models and data. It also has techniques such as mesh redivision, mesh coarsening and refinement, and remap that creates a mapping between low-dimensional calculation results and high-dimensional models, which can greatly shorten modeling and calculating time.
The two-dimensional finite element method was used to study the shock wave. The models were established by the axisymmetric method. The mass of explosive is 1 g, and the radius of explosive is 5.25 mm. Centrifugal acceleration environment, model sizes, arrangements of charge measuring points, and boundary type are shown in Figure 5. The three-dimensional finite element method was used to study the bubble pulsation. The basic models are shown in Figure 6. Figure 6(a) is a model using rigid boundary to simulate the outer shell of the test model, while Figure 6(b) illustrates using STEEL 4340 model shell to simulate the outer shell of the test model. In the three-dimensional modeling, the remap technique was applied, in which the shock wave just touching the boundary in the two-dimensional model is mapped to the three-dimensional model to continue the computation.
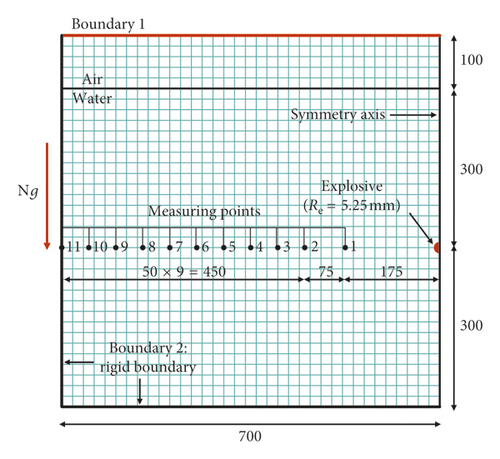
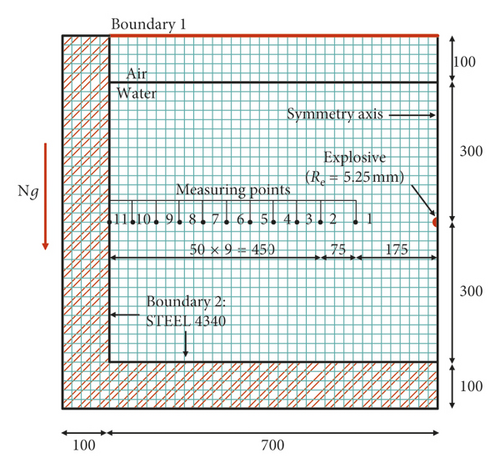
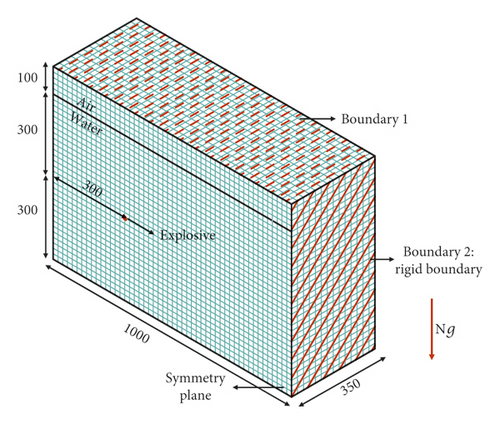
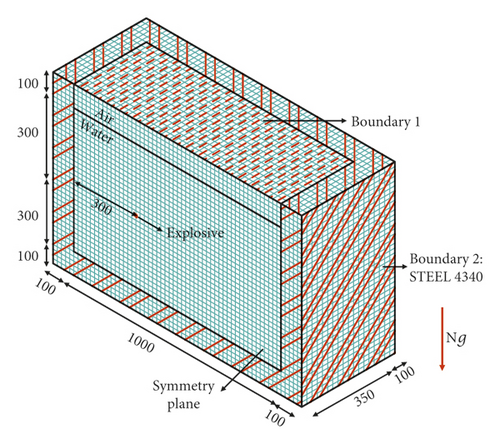
The numerical cases are shown in Table 3. The model UE-Num-01 was used to simulate the shock wave of test cases UE-Exp-01∼05. The models UE-Num-06, 07, and 08 were used to simulate the shock wave of test cases UE-Exp-06, 07, and 08, respectively. The models UE-Num-09, 10, 11, and 15 were used to simulate the bubble pulsation of test cases UE-Exp-04, 06, 07, and 08, respectively. The factors influencing the numerical results accuracy are as follows.
4.1. The State Equation Used in the Numerical Analysis
State equation is a functional relation characterized by object pressure, density, and internal energy. The main parameters in state equation are determined by tests. The state equations of each material can have different forms [21, 22] and are generally semiempirical and semitheoretical formulas. The materials involved in this paper are air, STEEL 4340, explosive, and water.
4.1.1. The State Equation of Air
4.1.2. The State Equation of STEEL 4340
4.1.3. The State Equation of Explosive
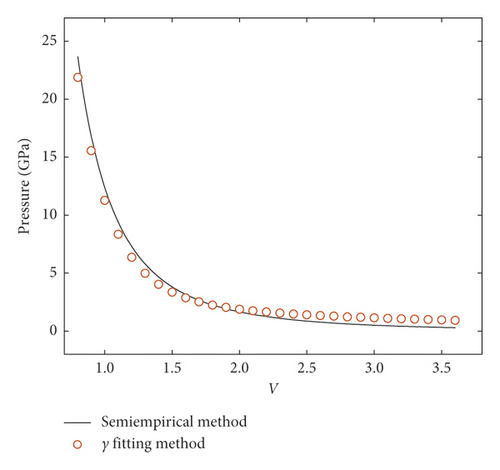
Because the explosives used in this test were developed specially, the parameters in the JWL equation should be determined first. The parameters can be determined by a semiempirical method and verified by the γ-fitting method [25].
The ω value could be 0.33, and R2 ≈ 0.27 R1(4 ≤ R1 ≤ 5) [28–30]. The parameters A, B, and C can be calculated by equations (14)–(16). The computed results of parameters are listed in Table 4.
| ρ0 (g/cm3) | D (km/s) | E0 (GPa) | γ | PCJ (GPa) | A (GPa) | B (GPa) | C (GPa) | R1 | R2 | ω |
|---|---|---|---|---|---|---|---|---|---|---|
| 1.65 | 8.317 | 9.536 | 2.9 | 29.266 | 565.295 | 1.21711 | 2.202399 | 4.2139 | 1.13775 | 0.35 |
Figure 7 is a P-V plot based on equations (6) and (17), which used the parameters of Table 4. The values obtained by the two methods are very close, so the data in Table 4 are verified to be reasonable.
4.1.4. The State Equation of Water
For the Grüneisen coefficient Г, the shock state equation makes Г = Г0. There are two kinds of Shock state equations, HULL and SNL state equations [32–34]. The parameters of the above two equations are shown in Table 5. In the SNL state equation, Г equals to 0, namely, the pressure is only determined by the density. This paper adopted the HULL state equation; in other words, the influence of internal energy was considered.
| Equation types | C0 (Km/s) | S1 | S2 | S3 | Г0 | a |
|---|---|---|---|---|---|---|
| HULL | 1.483 | 1.75 | 0 | 0 | 0.28 | 0 |
| SNL | 1.647 | 1.92 | 0 | 0 | 0 | 0 |
The polynomial state equation of water [24] has different formulas, and it is determined by the state of compression.
The parameters of polynomial state equation are shown in Table 6.
| A1 GPa | A2 (GPa) | A3 (GPa) | B0 | B1 | T1 (GPa) | T2 |
|---|---|---|---|---|---|---|
| 2.2 | 9.54 | 14.57 | 0.28 | 0.28 | 2.2 | 0 |
The state equation of water was set to different forms to study the influence on the numerical results of shock wave and bubble pulsation. UE-Num-01 and UE-Num-02 were used to study the shock wave, and UE-Num-15 and UE-Num-19 were used to study the bubble pulsation (Table 3).
4.2. The Boundary Condition Used in the Numerical Analysis
Due to the limitation of computing power, numerical simulation should avoid the large size calculation models. The boundary condition affects numerical simulation results greatly. In numerical simulation, boundary conditions should meet the need of calculation.
There are three kinds of boundary in numerical simulation, namely, transmitting boundary, flow out, and rigid boundary. Different boundary has different reflection on stress wave. In terms of reflection ability, the strongest one is rigid boundary and the weakest one is transmitting boundary. Transmitting boundary cannot be applied in the three-dimensional model, because three-dimensional model’s calculation consumes too much time, and if the transmitting boundary is applied, the model will lose too much energy, and it may lead to the break of computation. This paper focuses on the study of flow out and rigid boundary.
4.3. The Mesh Size
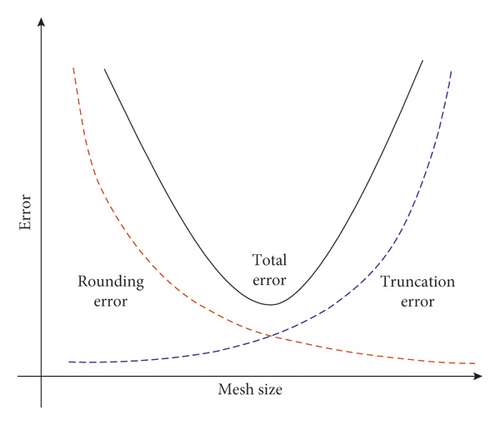
The mesh size must be small enough for improving the accuracy of computation. For large-size model computation, it is unreasonable to utilize the small mesh size. Firstly, it is because of the limitation of computing power. Secondly, when solving the difference equation in numerical computation, the limitation of computer’s word length causes the last significant digit of the floating-point number in the calculation process to be rounded up; thus, it can result in the accumulation of rounding error. Figure 8 shows the relationship between the error and the mesh size. Too small mesh size reduces the truncation errors caused by the differential equations being discrete into difference equations and increases the rounding errors caused by the rise of node’s number; therefore, it may contribute to an increase in the total error [35]. The mesh size must be within compass.
The mesh size influence was studied by changing the mesh size of UE-Num-01 and UE-Num-11 in Table 3. The mesh size of UE-Num-01 was set to 2 mm, 1.5 mm, 1.25 mm, 1 mm, 0.8 mm, 0.5 mm, 0.25 mm, 0.2 mm, and 0.15 mm, and the corresponding λ is 2.625, 3.5, 4.2, 5.25, 6.5625, 10.5, 21, 26.25, and 35. The mesh size of UE-Num-11 is, respectively, set to 20 mm, 15 mm, 12 mm, 10 mm, 7.5 mm, 5 mm, and 2.5 mm, and the corresponding λ is 0.2625, 0.35, 0.4375, 0.525, 0.7, 1.05, and 2.1.
5. Results and Discussion
5.1. The Influence Factors on Numerical Results
5.1.1. The Influence of State Equation of Water on Numerical Results
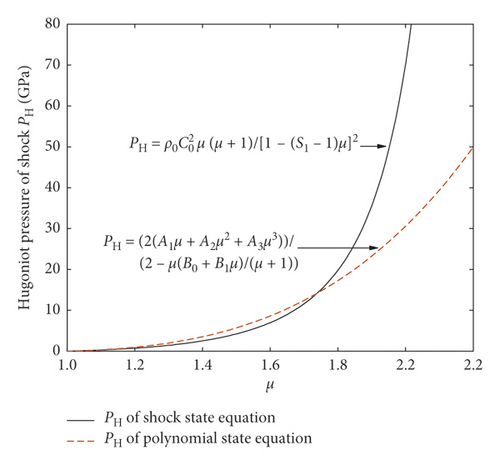
Figure 9 illustrates the influence of state equation of water on the shock wave peak pressure Pm. Table 7 illustrates the comparison between test results and numerical results of shock wave peak or bubble pulsation. The values of Pm calculated by the shock state equation are closer to the test values. Rm and T are almost unaffected by the state equation of water. The water peak pressures calculated by the polynomial state equation are slightly smaller than that calculated by the shock state equation, so Rm would be slightly larger, but the difference of the state equation did not affect the pulsation period T. It can also be concluded that the shock state equation is more suitable for the case when the compression ratio μ is larger, but results calculated with the two state equations are close in the lower compression state. That is, when in the initial stage of explosion, the compression ratio μ of water is very large, which may result in higher Pm calculated by the shock state equation. In the later bubble pulsation phase, the water is in a lower compression state, and Rm and T calculated by the two state equations are similar.
| Types | Test values | UE-num-15 (shock) | UE-num-19 (polynomial) |
|---|---|---|---|
| Rm (mm) | 123.67 | 125.08 | 125.27 |
| T (ms) | 16.50 | 16.18 | 16.18 |
The reasons for different results need to be explained from the state equation itself. It can be seen from equation (17) that the water pressure is mainly dominated by two parts, the Hugoniot pressure of shock PH and the Grüneisen coefficient Г. In this paper, Г = 0.28 is in the shock state equation directly, and substituting B0 = B1 = 0.28 into equation (26) of the polynomial state equation yields Г = 0.28, which indicates that the Hugoniot pressure PH becomes the only influencing factor for comparative analysis. Figure 10 shows the relation between PH and the compression ratio μ under two different state equations. It can be found from Figure 10 that the calculation results of the polynomial state equation are much smaller than that of the shock state equation in the high compression state, but they have the same PH in the low compression state. Therefore, the shock waves cause high compression to the water, so the Pm calculated by the shock state equation is larger than that of the polynomial. When the bubble pulsation occurs, namely, the low compression state, Rm and T calculated by the two state equations are the same.
5.1.2. The Influence of Boundary Condition on Numerical Results
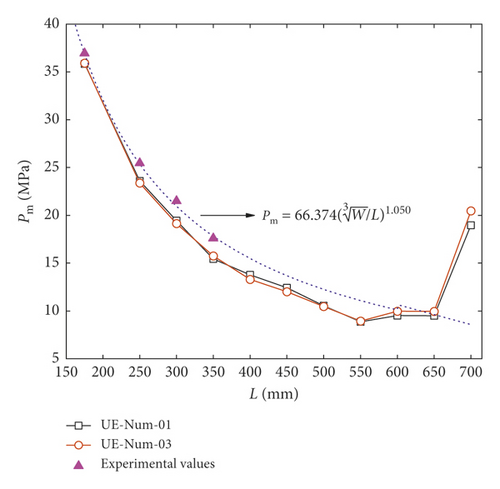
Figure 11 is a graph of Pm values varying with standoff distance L, which were calculated by models with different boundaries. Table 8 shows the Pm values of different measuring points, which were also computed by models with different boundaries. UE-Num-01 uses the flow out boundary as the artificial truncation boundary and also utilizes the rigid boundary to simulate the test model box. UE-Num-03 uses the flow out boundary as the artificial truncation boundary and the STEEL 4340 to simulate the test model box. UE-Num-04 uses the rigid boundary as the artificial truncation boundary and the rigid boundary to simulate the test model box. UE-Num-05 uses the rigid boundary as the artificial truncation boundary and the STEEL 4340 boundary to simulate the test model box. As shown in Table 8, UE-Num-01 has the same Pm value as the UE-Num-04, and the two models have the same Boundary 2 to simulate the test model but different Boundary 1 on the artificial truncation boundary, and the same situation can also be found in UE-Num-03 and UE-Num-05, so it can be concluded that the artificial truncation boundary (Boundary 1) has less influence on the shock wave peak pressure Pm. As shown in Figure 11, when L > 550 mm, the Pm does not decrease by law; in other words, Pm is obviously affected by the boundary condition; and the measuring point closer to the explosive center will be less affected from the boundary. As it can be seen from the measuring point 11 on the Boundary 2, Pm calculated by models with STEEL 4340 is larger than that of rigid boundary. That is, the reflection ability of STEEL 4340 is stronger.
| No. | L (mm) | Numerical results (MPa) | |||
|---|---|---|---|---|---|
| UE-num-01 | UE-num-03 | UE-num-04 | UE-num-05 | ||
| 1 | 175 | 35.85 | 35.89 | 35.85 | 35.89 |
| 2 | 250 | 23.60 | 23.36 | 23.60 | 23.36 |
| 3 | 300 | 19.45 | 19.13 | 19.45 | 19.13 |
| 4 | 350 | 15.45 | 15.76 | 15.45 | 15.76 |
| 5 | 400 | 13.78 | 13.30 | 13.78 | 13.30 |
| 6 | 450 | 12.42 | 12.01 | 12.42 | 12.01 |
| 7 | 500 | 10.55 | 10.47 | 10.55 | 10.47 |
| 8 | 550 | 8.87 | 8.94 | 8.87 | 8.94 |
| 9 | 600 | 9.52 | 9.98 | 9.52 | 9.98 |
| 10 | 650 | 9.50 | 9.95 | 9.50 | 9.95 |
| 11 | 700 | 18.96 | 20.44 | 18.96 | 20.44 |
Figure 12 is a plot of the bubble radius R ′ varying with time in the first pulsation period, which was calculated by models with different boundaries at hypergravity accelerations of 40g and 50g. Figure 13 has four pressure cloud maps at the moment that each of bubbles had the maximum radius under 50g.
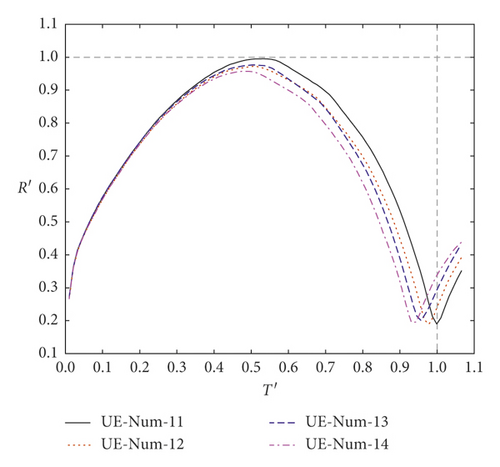
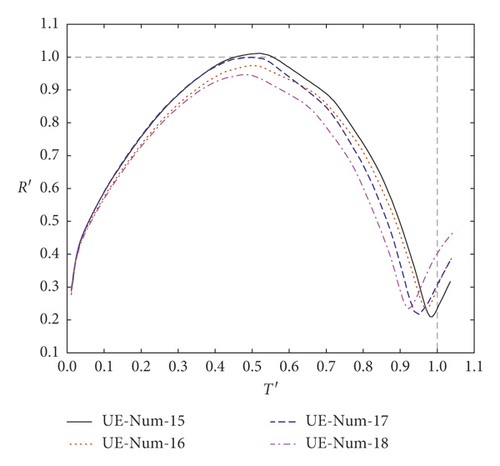
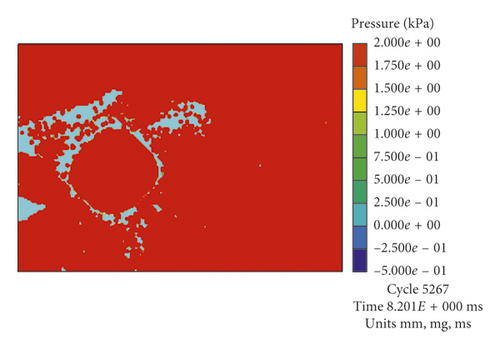
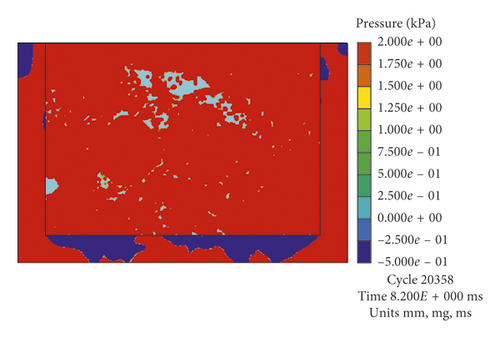
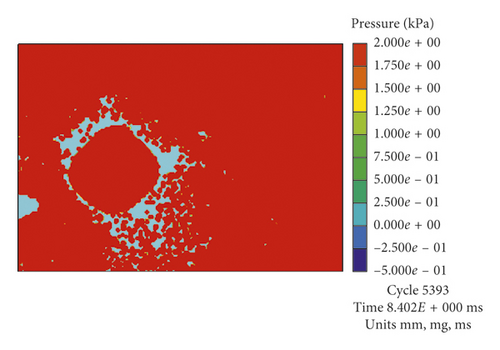
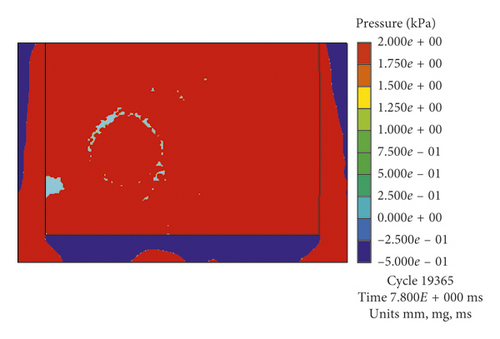
As shown in Figure 12(b), the values of R ′ calculated by the models UE-Num-15 and UE-Num-17 are larger than that calculated by the models UE-Num-16 and UE-Num-18. UE-Num-15 has the same Boundary 2 to simulate the test model box but different Boundary 1 on the artificial truncation boundary from UE-Num-17, which indicates that the Rm is mainly affected by Boundary 2. The STEEL 4340 has stronger reflection ability than the rigid boundary, so the Rm of UE-Num-15 and UE-Num-17 is larger than that of Rm of UE-Num-16 and UE-Num-18. In addition to the influence of Boundary 1, UE-Num-15 has the smallest water pressure and the largest Rm, while UE-Num-18 has the largest water pressure and the smallest Rm. It also can be found from Figure 13 that when using STEEL 4340 that simulates the test model box, the water pressure around the bubble is larger than that of using the rigid boundary, which results in the smaller bubble radius; namely, the maximum radius of UE-Num-15 and UE-Num-17 are larger than that of UE-Num-16 and UE-Num-18.
From Figure 12(b), the T of UE-Num-15 and UE-Num-16 is larger than that of UE-Num-17 and UE-Num-18, which indicates that the length of the bubble pulsation period is controlled by both Boundary 1 and Boundary 2, and Boundary 1 is the dominant one. The rigid boundary was applied to Boundary 1, which leads to the water pressure being larger at the same moment; that is, it made the bubble to shrink faster. In addition to the influence of Boundary 2, the order of the four model bubble pulsation periods is as follows: UE-Num-15 > UE-Num-16 > UE-Num-17 > UE-Num-18. The same relations described above can also be found in Figure 12(a). According to Figure 12, the R ′ and T ′ of UE-Num-11 and UE-Num-15 are closer to 1. That is to say, it is better to use the rigid boundary to simulate the test model box and use the flow out boundary to simulate the artificial truncation boundary.
5.1.3. The Influence of Mesh Size on Numerical Results

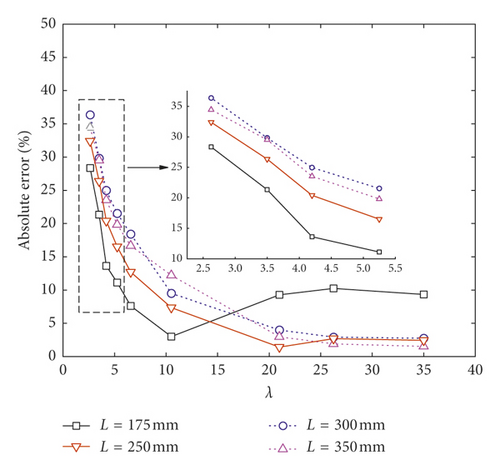
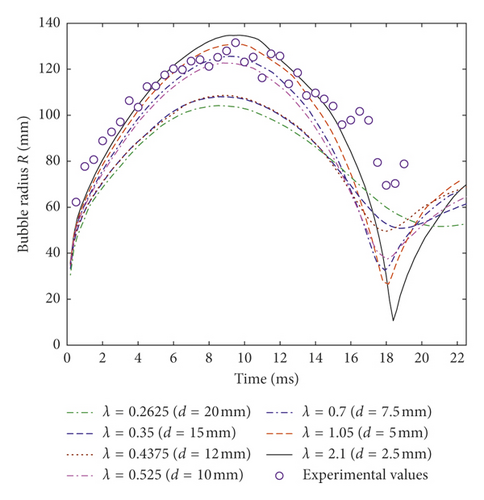
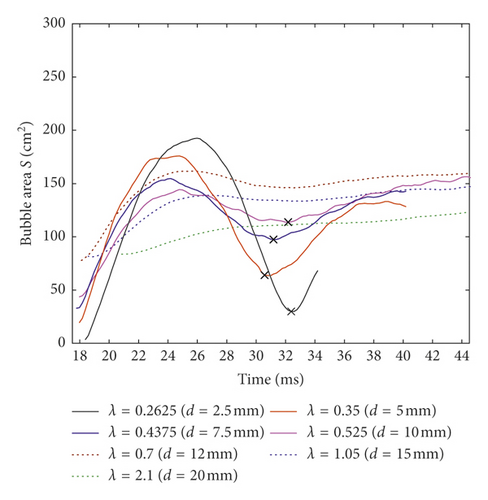
Figure 15(a) illustrates the relation between R under different λ in the first pulsation period and time, while 15(b) illustrates the Rm and T absolute errors. Figure 16 is a plot of the bubble area S varying with time in the second pulsation period under different λ. Table 9 illustrates the basic characteristics and computing time of different mesh size models. Numerical computing time in Table 9 means the time taken for each two-dimensional model to simulate 0.4 ms explosion, or for each three-dimensional model to simulate 30 ms explosion.

| λ | d (mm) | Symmetry | Cells/elements | Nodes | Numerical computing time |
|---|---|---|---|---|---|
| 2.625 | 2 | 2D | 122500 | 123201 | 6 min |
| 3.5 | 1.5 | 2D | 218089 | 219024 | 14 min |
| 4.2 | 1.25 | 2D | 313600 | 314721 | 17 min |
| 5.25 | 1 | 2D | 490000 | 491401 | 33 min |
| 6.5625 | 0.8 | 2D | 765625 | 767376 | 1 h·4 min |
| 10.5 | 0.5 | 2D | 1960000 | 1962801 | 4 h·17 min |
| 21 | 0.25 | 2D | 7840000 | 7845601 | 30 h·55 min |
| 26.25 | 0.2 | 2D | 12250000 | 12257001 | 59 h·17 min |
| 35 | 0.15 | 2D | 21780899 | 21790224 | 207 h·33 min |
| 0.2625 | 20 | 3D | 31500 | 34884 | 2 h·1 min |
| 0.35 | 15 | 3D | 75576 | 81600 | 4 h·2 min |
| 0.4375 | 12 | 3D | 148680 | 158100 | 8 h·4 min |
| 0.525 | 10 | 3D | 245000 | 258156 | 12 h·6 min |
| 0.7 | 7.5 | 3D | 592012 | 615600 | 20 h·10 min |
| 1.05 | 5 | 3D | 1960000 | 2012211 | 36 h·18 min |
| 2.1 | 2.5 | 3D | 15680000 | 15888021 | 493 h·50 min |
It can be seen from Figure 14(a) that, as the λ increases, Pm increases, and this tends to be stable gradually. When λ is 35, because the Pm of the measuring point 1 (L = 175 mm) begins to reduce, this is mainly because the effective data points to be saved under this model have exceeded the limitation of finite element software. It can be found from Figure 14(b) that, when λ is 10.5, the error of measuring point 1 has the smallest value; in other words, whenever λ increases or decreases from the value, the error both increases. The measuring point 2 (L = 250 mm) has the smallest error when λ = 21. When λ = 35, the measuring point 3 (L = 300 mm) and 4 (L = 350 mm) have the smallest error according to the present calculation. Therefore, different measuring points have different requirements on the mesh size. The error of measuring point closer to the explosive can reach allowed scope when the mesh size is relatively small. With the increase of L, the mesh size should decrease to meet requirement for numerical computation accuracy. As it can be seen from Table 9, the computing time of λ = 35 was 3.5 times greater than λ = 26.25, but the mesh size was only reduced by 0.05 mm. Thus, by reference to the error and computing time, if the shock wave is studied by the two-dimensional model, it is recommended that the mesh size can take (1/30–1/10) Re.
In the first bubble pulsation, as the mesh size L decreases, the Rm increases, and the error is the smallest when λ = 0525 (Figures 15(a) and 15(b)); i.e., the mesh size is about twice larger than the explosive radius. The T error is the smallest when λ = 1.05; i.e., the mesh size is about equal to the explosive radius. In the second bubble pulsation period, because the bubble shape is no longer approximately circular, the statistics were based on the bubble occupied area. It can be concluded from Figure 16 that the maximum bubble area Sm increases with the decrease of the mesh size. When λ < 0.525 (the mesh size is 2 times larger than the charge radius), the variation of the bubble area was little during the second period, and the critical point between the second and third pulsation period is not obvious. When λ > 0.525, the variation of bubble size can be clearly observed, and the critical point of different periods can be found, but the computing time will be prolonged greatly with the increase of mesh size. As shown in Table 9, the computing time of λ = 2.1 (the mesh size is about 1/2 times of the charge radius) is 13 times larger than that of λ = 1.05. Combining the error and the computing time, if the three-dimensional model is used to study the bubble pulsation, it is suggested that the mesh size can be the same as the explosive radius Re.
5.2. Test and Numerical Results on Shock Wave and Bubble Pulsation
| Experiment scheme | UE-exp-01 | UE-exp-02 | UE-exp-03 | UE-exp-04 | UE-exp-06 | UE-exp-07 | UE-exp-08 |
|---|---|---|---|---|---|---|---|
| Numerical values (MPa) | 35.85 | 23.60 | 19.45 | 15.45 | 16.02 | 15.53 | 15.66 |
| Relative error (%) | −3.06 | −7.31 | −9.49 | −12.27 | −17.55 | −15.14 | −19.07 |
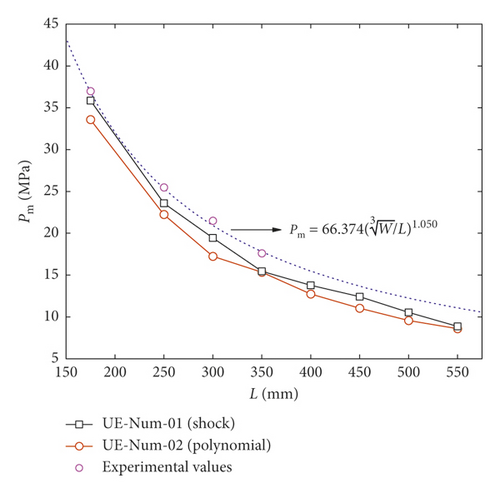
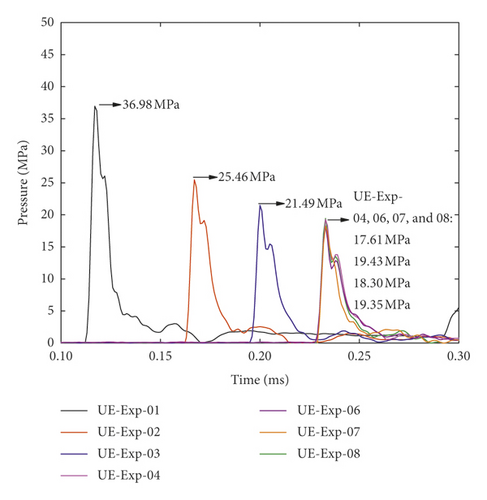
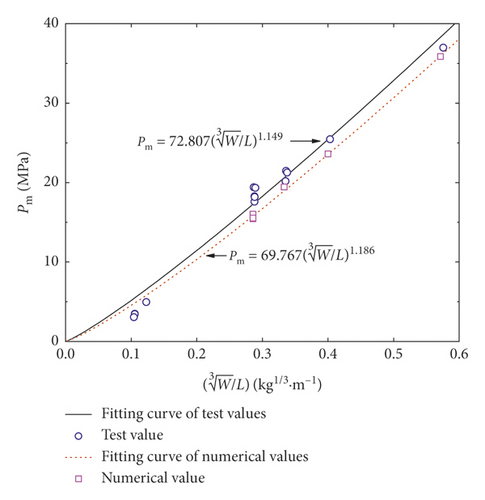
The shock wave pressures of UE-Exp-01, 02, 03, 04, 06, 07, and 08 are listed in Figure 17. From Figure 17, the results of UE-Exp-1, 2, 3, and 4 are obtained under 40g centrifugal acceleration, but their standoff distances are different. So, it can be concluded that, with the increase of standoff distance L, the shock wave peak pressure Pm decreases. UE-Exp-4, 6, 7, and 8 have the same standoff distance L but different centrifugal accelerations, and their shock wave pressures are almost the same, so it can be concluded that the influence of gravity can be ignored when studying the shock wave peak pressure.
Through the above analysis of numerical influence factors, UE-Num-01, 06, 07, and 08 are used in simulating UE-Exp-04, 06, 07, and 08 and UE-Num-01 is used in simulating UE-Exp-01, 02, 03, and 04. From Table 10, the same shock wave change trends are also drawn in numerical simulation. As shown in Figure 18, the test values of Pm are a little larger than numerical values of Pm, but they have the same change trend varying with proportional distance.
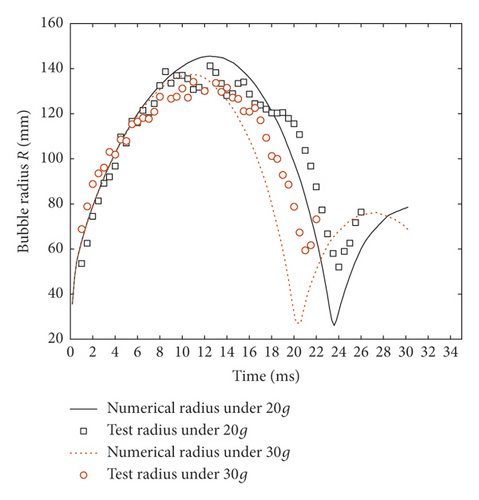
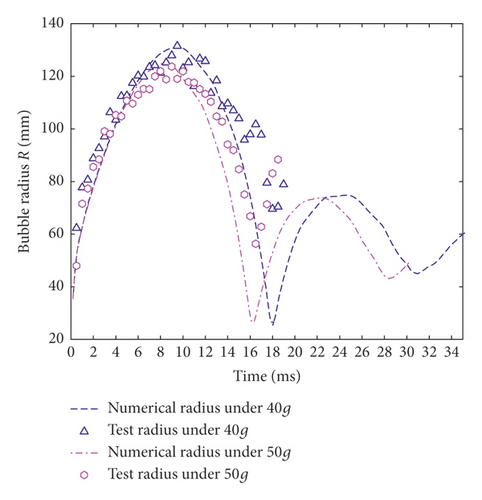
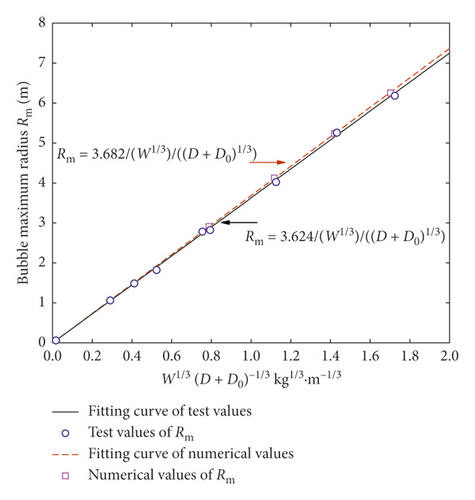
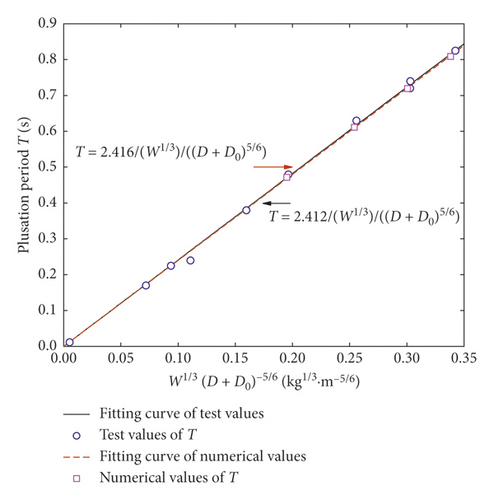
Through the above analysis of numerical influence factors, UE-Num-11 is used in simulating UE-Exp-04. Bubble pulsation pictures in the first period including the test case of UE-Exp-04 and its numerical simulation results are displayed in Figure 19. The results of the maximum bubble radius Rm and the pulsation period T under different test conditions are shown in Table 1. Due to the limitation of the shooting range of high-speed camera, some bubbles have exceeded the shooting range during the expansion process, but the bubble shape is still processed in a complete circle. In the contraction phase, the bubble is moved upwards, so the second pulsation period bubble pictures are incomplete. As shown in Figure 19, the experimental bubble expanded to the maximum at 9.5 ms under 40g, while numerical bubble at 9.58 ms. The bubble shape was still spherical during expansion, but gradually became spindle-shaped when contracted whenever it was in a test or numerical condition. The bubble contracted to the minimum at 18.0 ms in test and at 17.98 ms in numerical simulation.


| No. | Numerical results | Relative errors (%) | ||
|---|---|---|---|---|
| Rm (mm) | T (ms) | Rm (mm) | T (ms) | |
| UE-exp-04 | 145.49 | 23.58 | 2.99 | −1.75 |
| UE-exp-06 | 137.45 | 20.38 | 2.44 | −2.95 |
| UE-exp-07 | 130.93 | 17.98 | −0.45 | −0.11 |
| UE-exp-08 | 125.08 | 16.18 | 1.14 | −1.94 |
6. Conclusions
- (1)
The shock wave peak pressure calculated by the polynomial state equation is smaller than that calculated by the shock state equation. The difference in state equation of water has less effect on the bubble maximum radius and the pulsation period.
- (2)
The boundary simulating model box affects Rm more. The T is influenced both by the boundary simulating model box and the artificial truncation boundary, but the dominant one is the artificial truncation boundary.
- (3)
As the mesh size decreases, the shock wave peak pressure increases and tends to be stable gradually. It is recommended that the mesh size of the two-dimensional model takes (1/30 ∼ 1/10) explosive radius. In the first bubble pulsation period, when the mesh size takes about the explosive radius, the errors of the maximum radius and the bubble pulsation period are both the smallest. In the second bubble pulsation period, when the mesh size is twice larger than the explosive radius, it is impossible to see the dynamic change of bubble shape clearly. The mesh size of the three-dimensional model is recommended to take the 1 time explosive radius.
- (4)
The centrifugal underwater explosion tests and the corresponding numerical simulation prove that the shock wave peak pressure is not affected by the gravity effect, and the maximum radius and the bubble pulsation period decrease with the increase of gravity acceleration.
Conflicts of Interest
The authors declare that they have no conflicts of interest.
Acknowledgments
The research reported in this paper was supported by research grants from the State Key Program of National Natural Science Foundation of China (nos. 51339006 and 51679003) and the Project of Beijing Education Commission (Grant number: KM201610005010).
Open Research
Data Availability
The data used to support the findings of this study are available from the corresponding author upon request.


