Study on the Fracture Behavior of Cracks Emanating from Tunnel Spandrel under Blasting Loads by Using TMCSC Specimens
Abstract
Radial cracks may exist around tunnel edge, and these cracks may propagate and weaken tunnel stability under nearby blasting operations. In order to study the blast-induced fracture behavior of radial cracks emanating from a tunnel spandrel, a tunnel model containing a spandrel crack (TMCSC) with different inclination angles was proposed in this paper. Crack propagation gauges (CPGs) and strain gauges were used in the experiments to measure crack initiation moment and propagation time. Finite difference models were established by using AUTODYN code to simulate crack propagation behavior and propagation path. ABAQUS code was used to calculate dynamic stress intensity factors (SIFs). The results show that (1) crack inclination angles affect crack initiation angles and crack propagation lengths significantly; (2) critical SIFs of both mode I and mode II decrease gradually with the increase of the crack propagation speed; (3) the dynamic energy release rates vary during crack propagation; and (4) there are “crack arrest points” on the crack propagation paths in which the crack propagation speed is very small.
1. Introduction
Blasting method is often used in rock engineering, such as in mining and tunneling. There are many cracks emanating from tunnel edge which could be either induced by the tunnel blasting excavation or naturally existing. These cracks under nearby blasting operations may propagate and coalesce, damaging tunnel strength and weakening tunnel stability, which could cause some catastrophes, such as rockburst and coal-gas outburst. So, it is necessary to carry out the corresponding numerical and experimental studies.
Currently, many scholars have studied the dynamic propagation behavior of the cracks under blasting and have made significant achievements. Yang et al. [1] investigated the dynamic behavior of jointed rock mass under blasting at high-stress conditions. Yue et al. [2] studied crack propagation in PMMA material with double holes under the directional controlled blasting. Chen et al. [3, 4] investigated the propagation characteristics of vibration waves induced in surrounding rock by tunneling blasting. By using the blasting technique, Verma et al. [5] studied the blasting damage of a large-scale rock mass quality with a fault tunnel, and the results were verified by the ultrasonic testing of core samples obtained from a tunnel site experiment. By the model with precracks on the dome, Masi et al. [6] simulated the explosion process, and the simulation results were similar to cracks produced in the process of damage evolution of no crack dome. Ozcelik [7] used reverse analysis method to study the cause of the expansion of cracks in buildings, which was the blasting construction of limestone quarry. With the aid of extended finite element, Yan et al. [8] studied the cracking and failure characteristics of the segmented lining structure of underwater shield tunnel under the impact of the high-speed derailment train. The lining structure of impact section leads to continuous and perforated section v cracks, and a continuous strip or polygonal crack formed around the impact zone of the joint and on continuous surface of the outer surface near the joint. Keys and Clubley [9] studied the failure mode and debris distribution of the brick slab under the explosive load and pointed out that the explosion overpressure pulse was the key parameter of the fracture failure mode, the initial breakage, and the debris distribution.
Using dynamic load generated by explosives on the supporting system, Shirzadegan et al. [10] carried out the fracture study in the LKAB Kiirunavaara mine in Sweden and pointed out that the level of induced damage was limited to the fracture zone behind the supporting system and the crack propagation in the shotcrete. Slavko and Veljko [11] used the excavation process of hard rock with two joints to study the formation of the rock wedge and pointed out that the rock wedge could not be formed under the finite persistent shock wave produced by the blasting load. Stolz and Ruiz-Ripoll [12] studied the behavior of the buried tunnel section under the explosive load and pointed out that the actual loading force would cause large area cracking of the tunnel system, and the soil settlement could reach 1 cm. Li et al. [13] researched the essential reason of two empty holes on crack fracture rule under blasting and pointed out that the empty holes brought a hindrance influence on the outgoing cracks, and the arrest depended on the spacing between two empty holes. The smaller the distance between the two holes was, the better the crack arrest was. Liu et al. [14] studied the dynamic fracture toughness and other fracture parameters of type I crack under the explosive load and pointed out that there was an inflection point on the propagation path and the obvious crack arrest at the inflection point. For rock dynamic fracture toughness of mode I crack under blasting loads, Zhu et al. [15] put forward a new measuring method. At the same time, in order to calculate the displacements near the crack tip, the 1/4 node element from ANSYS code is used.
Although some experts and scholars have studied the propagation behavior of cracks under explosive loading and have made some achievements, they have focused more on mode I crack, and less on mode I-II crack. Of course, some unknown or partly unknown aspects have not been studied, such as the measuring method of critical dynamic SIFs and the fracture rule of mode I-II crack under blasting. For this paper, the aspects will be researched. In terms of the simulation study of rock dynamic fracture rule, finite difference AUTODYN code has been largely used, and moreover, its feasibility has been widely proved [16–26]. Therefore, in the simulation study of crack fracture rule, it will be used. In terms of the calculation of crack dynamic stress intensity factors (DSIFs) and combining with the measurement results of crack initiation time, ABAQUS code will be used, and the critical DSIFs will be calculated.
2. Experimental Study
To study fracture rule of spandrel cracks under blasting, a tunnel model containing a spandrel crack (TMCSC) with different inclination angles was proposed.
2.1. TMCSC Specimens
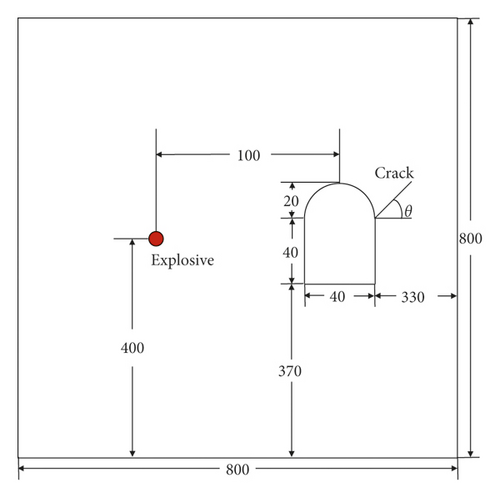
The TMCSC specimen dimension used in this study is shown in Figure 1. The radius of the borehole was 3.5 mm, and the 8# mine detonator (approximately 0.9 g of explosive charge) was placed in the borehole. The tunnel was made in accordance with the proportion of 1 : 100. The crack inclination angle θ was designed from −75° to 75°, the increment was 15°, and totally, there were eleven group specimens. The sandstone TMCSC specimens were cut by high-speed waterjet. The length of the tunnel spandrel cracks was 40 mm, and it was sharpened artificially by the 0.5 mm thickness steel saw blade. The thickness of the specimen was 10 mm.
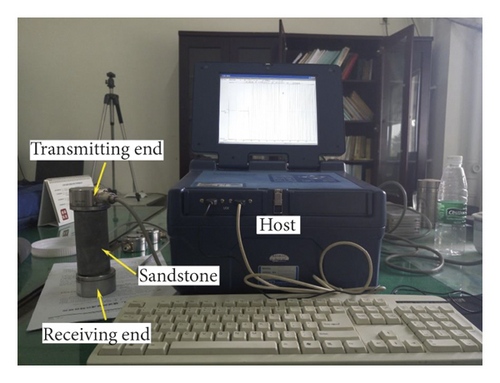
An ultrasonic speed testing system, Sonic Viewer-SX, as shown in Figure 2, which can be used to measure rock P-wave and S-wave speeds with high precision, was employed to measure the green sandstone dynamic parameters. The built-in software can calculate the parameters of dynamic Poisson’s ratio and dynamic elastic modulus. The dynamic mechanical parameters of green sandstone were obtained by the testing system, and the results are presented in Table 1.
| Density (kg/m3) | P-wave velocity Cd (km/s) | S-wave velocity Cs (km/s) | Rayleigh wave velocity CR (m/s) | Dynamic elastic modulus Ed (GPa) | Tensile strength σt (MPa) | Compressive strength σc (MPa) | Dynamic Poisson ratio νd |
|---|---|---|---|---|---|---|---|
| 2370 | 2.43 | 1.607 | 1.458 | 12.5 | 25 | 22.08 | 0.26 |
2.2. Rationality of TMCSC Specimen Dimension
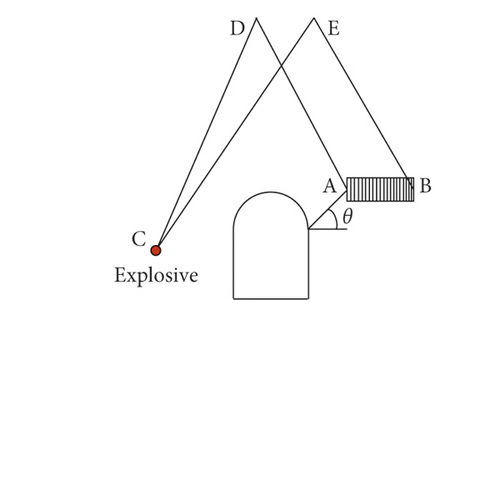
Before blasting tests, it was necessary to verify if the reflection tensile wave from the free boundary affected the crack fracture behavior in the CPG zone concerned. Because the tensile strength of rock material is lower than its compressive strength, with the arrival of the reflected tensile stress wave, it will significantly influence dynamic behavior of the crack tip. The principle was that, as the wave reached the crack tip concerned, the initiation or propagation behavior of the crack should have completed.
The shortest time of stress wave travelling along the path CDA was set as TCDA, the initiation time of crack tip A or the breaking time of the first filament of CPG was set as TA, the shortest time of stress wave travelling along the path CEB was set as TCEB, and the breaking time of the last filament of the CPG was set as TB, as shown in Figure 3. All the values of these parameters are listed in Table 2.
| Crack angle (°) | TCDA (μs) | TA (μs) | TCEB (μs) | TB (μs) |
|---|---|---|---|---|
| −75 | 321.81 | 64.6 | 326.75 | 168.2 |
| −60 | 323.87 | 68.2 | 329.22 | 169.6 |
| −45 | 327.57 | 71.8 | 332.92 | 188.6 |
| −30 | 331.69 | 74.6 | 337.04 | 177.4 |
| −15 | 335.39 | 75.8 | 341.15 | 181.4 |
| 0 | 331.69 | 77.4 | 337.45 | 187.0 |
| 15 | 327.57 | 76.2 | 333.33 | 181.0 |
| 30 | 323.05 | 75.6 | 328.81 | 175.4 |
| 45 | 319.75 | 72.4 | 325.05 | 164.6 |
| 60 | 316.05 | 70.6 | 321.40 | 168.8 |
| 75 | 313.58 | 67.4 | 318.93 | 166.8 |
- TCDA and TCEB were obtained from geometric calculation, and TA and TB were derived from monitoring data of CPG in subsequent blasting tests.
From Table 2, one can find all the time TA was much less than TCDA, that means the crack initiation behavior was much earlier than the arrive time of the reflected tensile wave from the upper boundary, and the initiation of the crack was not affected by the wave. In addition, time TCEB was much larger than the time TB; namely, the reflected tensile wave from the upper boundary had no effect on the crack propagation. Therefore, the TMCSC specimen dimension was quite large, the reflected tensile stress wave will not affect the dynamic behavior of the crack, and the data obtained from the experiments were effective and reliable.
2.3. Measuring System
In this experiment, the 8# mine detonator (approximately 0.9 g of explosive charge) was placed in the blast hole center, and the ultradynamic resistance strain gauge of type CS-1D and oscilloscope of type DS1104 were used. By a crack propagation gauge (CPG) pasted at crack tip, the initiation moment and the propagation time of the cracks were obtained. The explosion load was tested by the strain gauges near the blast hole, and the test system of the experiments is shown in Figure 4.
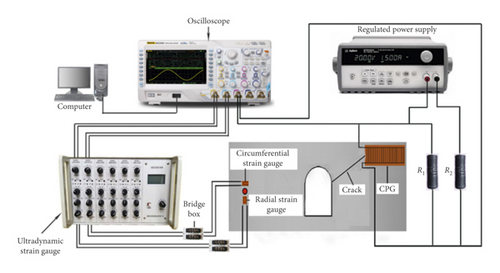
The strains and the associated stresses were obtained by the radial and tangential strain gauges pasted near the borehole. The CPG has 21 Kama copper wires, and the initial total resistance of the wires was 3.5 Ω. Resistor R1 (50 Ω) was connected in parallel with the CPG. In order to avoid large voltage, R2 (50 Ω) was connected in series with the CPG, and a 16 V constant power was supplied (accuracy of 1 mv). Before the strain gauges and CPGs were pasted, the specimen surface was polished by a sand paper.
2.4. Measurement of Blast-Induced Pressures
The thickness of the specimens was set to 15 mm, a detonator was placed in the borehole, the main charge was placed in the center of the borehole, and no filling and coupling were applied, as shown in Figure 5.
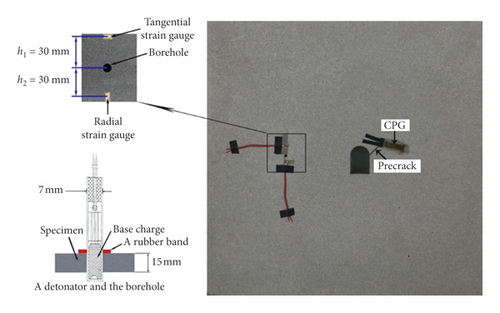
In order to confirm the location of the strain gauges pasted near the borehole, the preliminary tests were conducted, and the results showed that the radius of the crushed zone was less than 25 mm. Therefore, to calculate the pressure near the borehole and to avoid the impact of crushed zone, two strain gauges were pasted at 30 mm distance to the center of the borehole, as shown in Figure 5.
The tangential strain (εθ) and the radial strain (εr) obtained by the tangential and radial strain gauges, respectively, are shown in Figure 6.
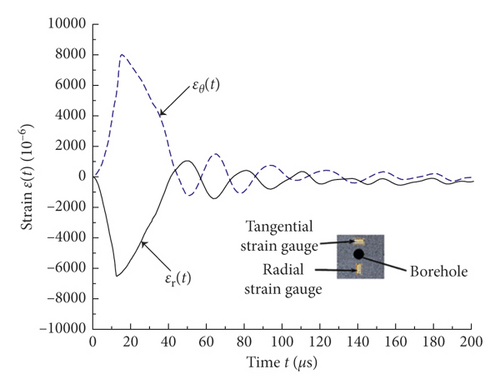
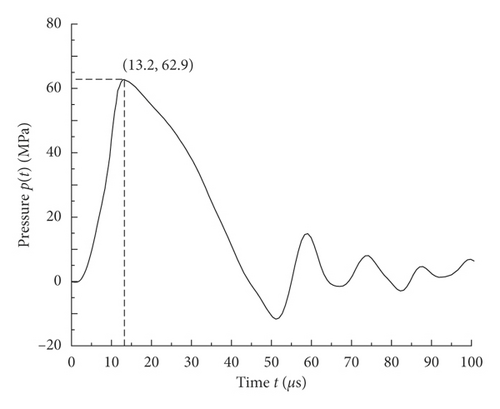
By Figure 6 and equation (1), the pressures P(t) were calculated, and the results are shown in Figure 7. For the sandstone specimen, the maximum value of blast-induced pressure was 62.9 MPa from Figure 7, which was much less than the pressure on the borehole wall [27].
2.5. Propagation Behavior of the Cracks
CPG was pasted on the propagation paths of the cracks to further monitor the dynamic fracture of the cracks, and the oscilloscope was used to display and collect the voltage data of the CPG. Eleven groups of specimens were tested. The crack inclination angles changed from −75° to 75° for different groups to analyze the dynamic fracture of the cracks under blasting.
As the crack propagated, the CPG wires were broken consecutively. The relationship of voltage signal with time was a step-shaped curve. The measurement results of sandstone specimens with crack inclination angle θ = −45° and 45° were plotted and are shown in Figures 8(a) and 8(b). The crack speed was calculated, and the results are shown in Figure 8(c). Meanwhile, the average crack propagation speeds are shown in Figure 8(d).
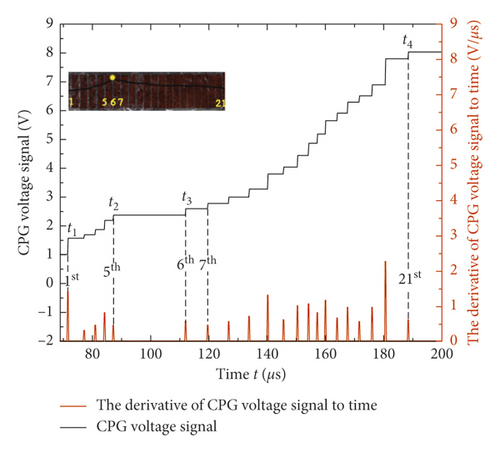
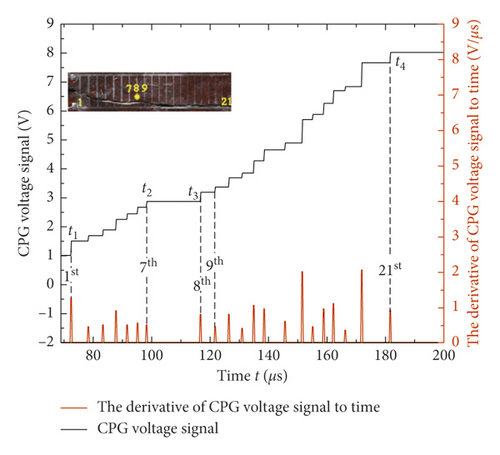
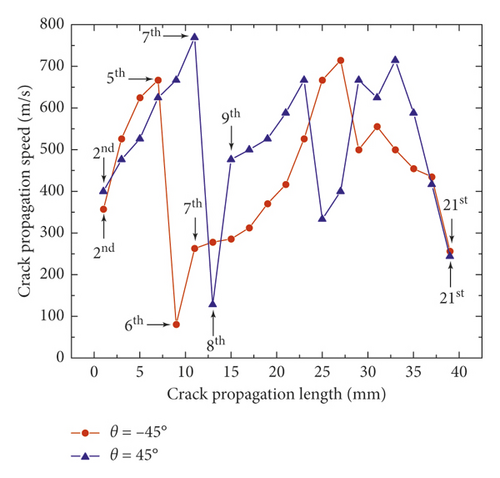
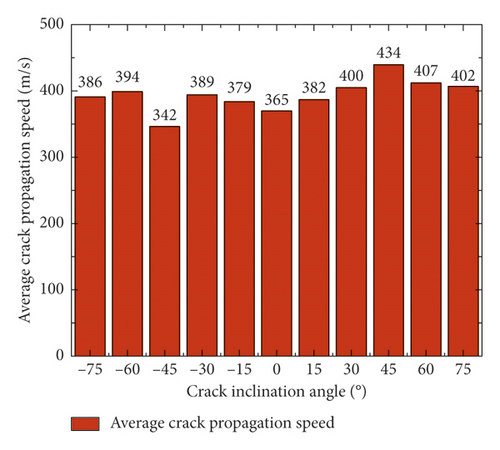
From Figures 8(a) and 8(b), one can find that, between the 5th and 7th wire and between the 7th and 9th wire, the crack speeds spent a relatively long time to propagate, and the propagation speed of crack inclination angle −45° specimen shown in Figure 8(c) was only 80.65 m/s which was much lower than the average speed 342 m/s shown in Figure 8(d), and similarly, for other specimens of crack inclination angle 45° shown in Figure 8(c), the propagation speed was 128.21 m/s which was less than the average speed 434 m/s, as shown in Figure 8(d). When θ equaled 45°, the average crack speed was the maximum, and when θ equaled −45°, the average crack speed was the minimum.
3. Numerical Simulation Analysis under Explosive Load
AUTODYN code was used in this paper to simulate crack fracture behavior under blasting which has been applied by more and more experts and scholars to solve crack dynamic fracture and proved to be feasible [16–26].
3.1. Numerical Models
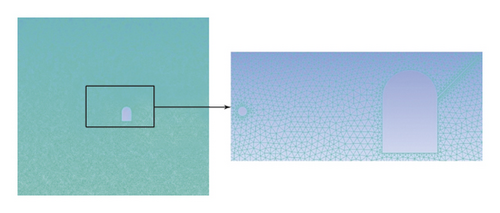
In the process of simulation, the samples are divided into as many as possible tetrahedral elements. To make the calculation more accurate, around the crack, borehole and tunnel, the meshes are condensed, as shown in Figure 9.
3.2. Numerical Simulation Results
To study fracture rules of the cracks under blasting, the pressure curve obtained in the test was used in the AUTODYN3D code simulation. The simulation parameters are derived from Table 1. From the simulation results, the crack propagation paths could be obtained and were compared with experiment results, as shown in Figure 10.


From Figure 10, for the crack propagation path, numerical simulation and experimental results were all not a straight line which may be due to the fact that dynamic energy release rate of the crack tip was not a fixed value. On the other hand, the experimental results were incompletely consistent with the numerical simulation, which may be due to the inhomogeneity of the experimental materials.
3.3. Crack Initiation Angle
Initiation angle of the crack was the angle between the crack initiation direction and the initial crack direction. To study the variation rule of the initiation angle, by PicPick software, the initiation angles of numerical simulation and test results were measured from Figure 10, as shown in Table 3.
| Crack inclination angle (°) | −75 | −60 | −45 | −30 | −15 | 0 | 15 | 30 | 45 | 60 | 75 | — | |
|---|---|---|---|---|---|---|---|---|---|---|---|---|---|
| Initiation angle (°) | Simulation value | 63.28 | 57.57 | 51.02 | 39.49 | 34.28 | 21.27 | 33.40 | 56.37 | 68.35 | 85.12 | 97.21 | — |
| Experimental value | 63.68 | 58.81 | 51.14 | 39.93 | 34.49 | 21.76 | 33.88 | 56.69 | 68.81 | 85.66 | 97.70 | — | |
To understand the rule of crack initiation angle intuitively, the data in Table 3 were plotted, as shown in Figure 11.
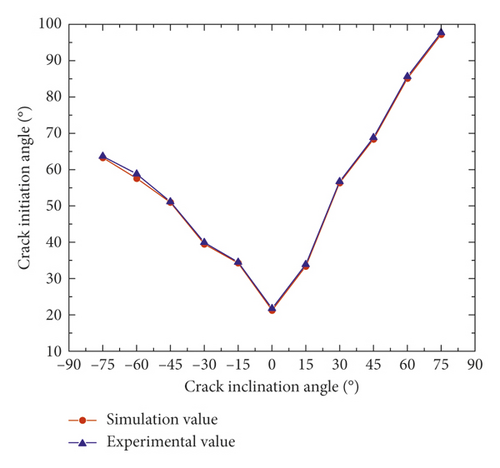
From Figure 11, the simulated and experimental values had similar change trends which all decreased first and then increased and were all minimum when θ equaled 0°, and the experimental value was slightly greater than the simulated value, which may be caused by the heterogeneity of experiment materials.
3.4. Crack Propagation Length
To study variation rule of crack propagation length, by PicPick software, numerical simulation and test results were measured from Figure 11, as shown in Table 4.
| Crack inclination angle (°) | −75 | −60 | −45 | −30 | −15 | 0 | 15 | 30 | 45 | 60 | 75 | — | |
|---|---|---|---|---|---|---|---|---|---|---|---|---|---|
| L (mm) | Simulation value | 43.54 | 52.63 | 63.75 | 77.35 | 86.78 | 92.69 | 100.77 | 111.56 | 136.44 | 108.2 | 96.82 | — |
| Experimental value | 43.15 | 52.26 | 62.46 | 75.89 | 84.46 | 90.83 | 98.68 | 109.32 | 134.85 | 106.88 | 94.24 | — | |
To understand the rule more intuitively, the data in Table 4 were plotted, as shown in Figure 12.
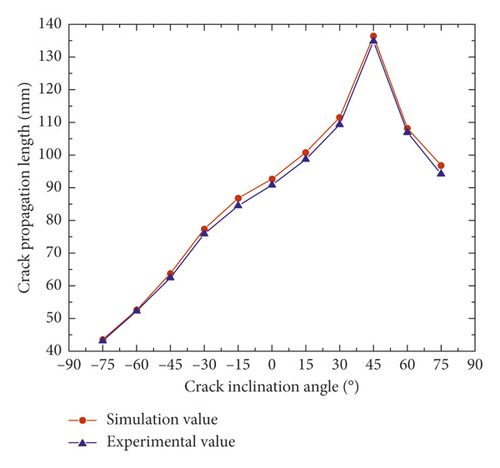
From Figure 12, the simulated and experimental values had similar change trends which all increased first and then decreased and were all maximum when θ equaled 45°, and the experimental value was slightly smaller than the simulated value, which may be caused by the heterogeneity of experiment materials.
4. Dynamic SIFs (DSIFs) in the Process of Crack Propagation
DSIFs stand for propagation status of the crack. For rock materials, the fracture rules under impact loading have been widely researched by many experts and scholars [28–31]; however, the rules under blasting have been less studied.
4.1. Calculation of Static SIFs with the Help of ABAQUS Code
AUTODYN code has not been widely recognized in computing SIFs, but ABAQUS code has been widely recognized by many experts and scholars. So, in this study, for TMCSC specimens, finite element models of ABAQUS code under blasting were established. Triangular element CPS6 meshes were set near the crack tip, and quadrilateral elements CPS8 were set in other regions, as shown in Figure 13.
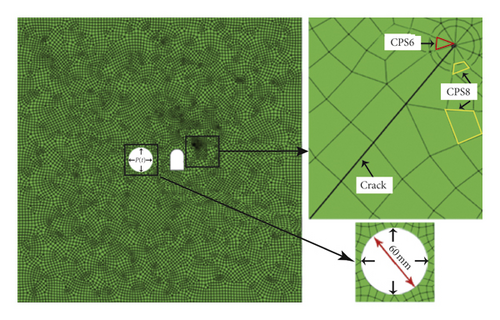
In order to avoid the influence of crushed zone, when numerical simulation was carried out, the borehole radius was set to 30 mm, and the borehole wall was exerted by the loading from Figure 7. In order to obtain accurate static SIFs under blasting, more meshes were added around the crack. Finally, SIFs and can be extracted from numerical simulation results.
4.2. Calculation of DSIFs
The crack with an inclination angle whose value equaled −45° was used to illustrate the calculation process of DSIFs.
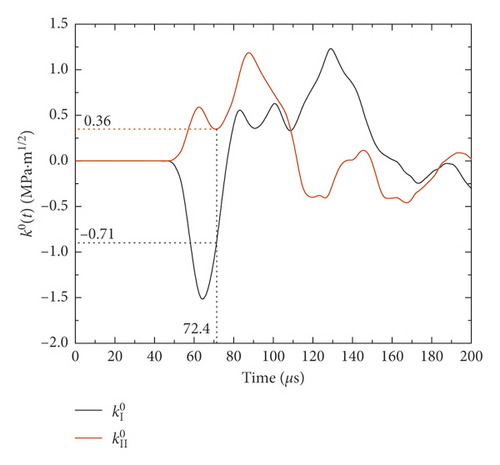
To obtain SIFs k0(t) at the crack initiation moment, the crack initiation was simulated by the ABAQUS code, and SIFs k0(t) was obtained according to crack initiation moment measured by CPG, as shown in Figure 14. When the stress wave just reached the crack tip, SIFs was negative, and then, the absolute value of SIFs increased gradually, and SIFs was positive and then increased gradually. From the experiment, crack initiation moment was 72.4 μs, and thus, and were obtained whose absolute values were, respectively, 0.71 MPa m1/2 and 0.36 MPa m1/2.
When the crack tip extended 8 mm, the fifth wire of the CPG was broken, and the SIFs K0(t) curve at the crack tip could be calculated by the ABAQUS code, and the results are shown in Figure 15 (the solid line). At this time, crack propagation speed was 121.95 m/s, k(v) could be obtained by equation (6), and DSIFs Kd(t) could be obtained by equation (5). The curve of DSIFs Kd(t) versus time is shown in Figure 15 (dashed curve).
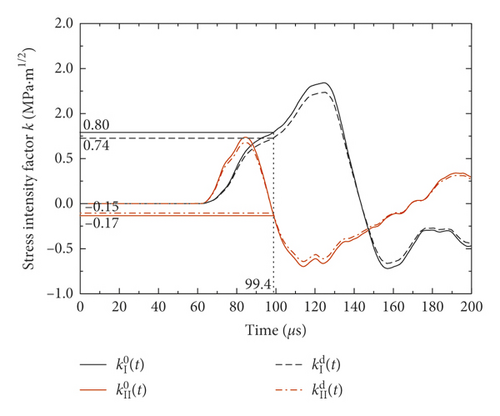
From this experiment, it could be seen that the fracture moment of the fifth wire was 99.4 μs, and absolute values of DSIFs and were obtained whose values were, respectively, 0.74 MPa·m1/2 and 0.15 MPa·m1/2.
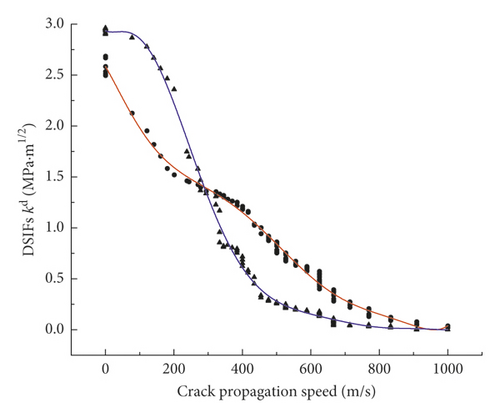
Similarly, according to the fracture moment measured by CPG, the other DSIFs and were obtained, and the polynomial fitting curves of and versus crack propagation speed were made by origin code which are shown in Figure 16. Their equation and the constants in the equation are shown in Table 5.
| SIF | Fitting equation | b0 | b1 | b2 | b3 | b4 | b5 | b6 | b7 |
|---|---|---|---|---|---|---|---|---|---|
| 1.583 | −0.005 | 1.094e−5 | 6.653e−8 | 2e−10 | 3e−13 | 2e−16 | 2e−20 | ||
| 0.5792 | 0.0028 | 2.745e−5 | 1.083e−7 | 2e−10 | 2e−13 | 6e−17 | — |
From Figure 16, DSIFs and decreased gradually, and there existed a critical propagation speed which made DSIFs convert from to . When the crack propagation speed was less than 285 m/s, was greater than , which indicated that the crack propagation was mainly caused by shear action of stress wave. When the speed was greater than 285 m/s, was less than , which indicated that the crack propagation was mainly caused by tensile action of stress wave.
4.3. Dynamic Energy Release Rate (G)
The relation between G at the crack tip and crack propagation length L can be calculated by equation (7), as shown in Figure 17 (take the model whose crack inclination angle equals 45°as an example).
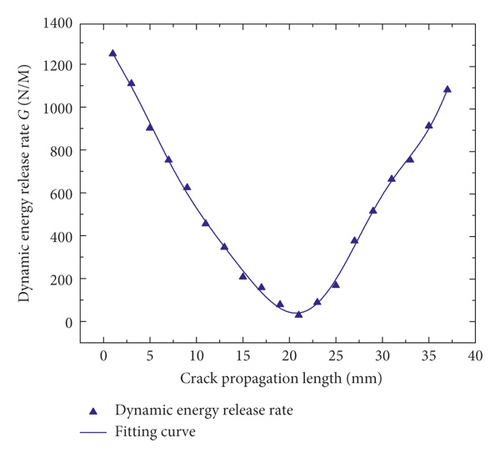
From Figure 17, it can be seen that G decreased first and then increased with the increase of L, and as L was about 21 mm for TMCSC, G was the minimum. G was not a constant, and it can be able to explain curvilinear propagation paths shown in Figure 10.
5. Conclusion
- (1)
From explosion experiments of physical models and AUTODYN numerical simulation, it could be seen that the crack propagation path was not a straight line which may be caused by the heterogeneous property of sandstone materials and the dynamic energy release rate may not be a constant. There were inflection points on the crack propagation paths which may be due to the fact that the stress wave encountered the hard grains in the rock and bypassed them, and at inflection points, there existed a minimum propagation speed which was called “crack arrest speed.” At the same time, it was also found that when θ equaled 45°, average crack propagation speed was maximum. The experimental results were incompletely consistent with the numerical simulation, which may be due to the inhomogeneity of the experimental materials.
- (2)
The simulated and experimental values of crack initiation angle had similar change trends which decreased first and then increased and were minimum when θ equaled 0°. The experimental value was slightly greater than the simulated value, which may be caused by the heterogeneity of sandstone materials in the experiment.
- (3)
When crack propagation speed increased, DSIFs and decreased gradually. Besides, there existed a critical crack propagation speed which made DSIFs convert from to . When the crack propagation speed was less than 285 m/s, was greater than , which indicated that the crack propagation in CPG monitoring range was mainly caused by shear action of stress wave. When the crack propagation speed was greater than 285 m/s, was less than , which indicated that the crack propagation was mainly caused by tensile action of stress wave.
- (4)
The dynamic energy release rate G decreased first and then increased with the increase of crack propagation length L, and as L was about 21 mm for the TMCSC specimen, G was the minimum. G was not a constant, and it can be able to explain curvilinear propagation paths.
Conflicts of Interest
The authors declare that there are no conflicts of interest regarding the publication of this paper.
Acknowledgments
This work was financially supported by the National Natural Science Foundation of China (Grant nos. 11672194 and 11702181), Sichuan Administration of Work Safety (aj20170515161307), and The Project of Science and Technology of Sichuan Province (2018JZ0036).
Open Research
Data Availability
The data used to support the findings of this study are available from the corresponding author upon request.


