Wind-Induced Vibration Response of an Inspection Vehicle for Main Cables Based on Computer Simulation
Abstract
This paper presents a simulation approach based on the finite element method (FEM) to analyze the wind-induced vibration response of an inspection vehicle for main cables. First, two finite element (FE) models of a suspension bridge and a main cable-inspection vehicle coupled system are established using MIDAS Civil software and ANSYS software, respectively. Second, the mean wind speed distribution characteristics at a bridge site are analyzed, and the wind field is simulated based on the spectral representation method (SRM). Third, a modal analysis and a wind-induced vibration response transient analysis of the suspension bridge FE model are completed. Fourth, the vibration characteristics of the inspection vehicle are analyzed by applying fluctuating wind conditions and main cable vibration displacements in the main cable-inspection vehicle coupled FE model. Finally, based on the ISO2631-1-1997 standard, a vehicle ride comfort evaluation is performed. The results of the suspension bridge FE modal analysis are in good accordance with those of the experimental modal test. The effects of the working height, number of nonworking compressing wheels, and number of nonworking driving wheels during driving are discussed. When the average wind speed is less than 13.3 m/s, the maximum total weighted root mean square acceleration (av) is 0.1646 m/s2 and the vehicle ride comfort level is classified as “not uncomfortable.” This approach provides a foundation for the design and application of inspection vehicles.
1. Introduction
As the most important component of a suspension bridge, the main cable is corroded by the long-term exposure to natural factors (e.g., wind, rain, freezing temperatures, temperature changes, and humidity changes), which can endanger the security and reduce the service life of the bridge [1–3]. Therefore, it is necessary to inspect and maintain the main cable regularly. The traditional method of inspecting the main cable is artificial climbing, which has many shortcomings, such as having blind inspection areas, difficulty in climbing at high altitudes, low efficiency, and potential safety hazards. To improve the efficiency of cable inspection, various types of crawling robots have been developed [4–6]. These light crawling robots can perform unmanned inspections of the sling and the cable, but it is difficult to inspect the main cable of a suspension bridge with cable bands and other ancillary structures or provide a suitable maintenance platform. Therefore, it is of great significance to develop an inspection vehicle suitable for large main cables.
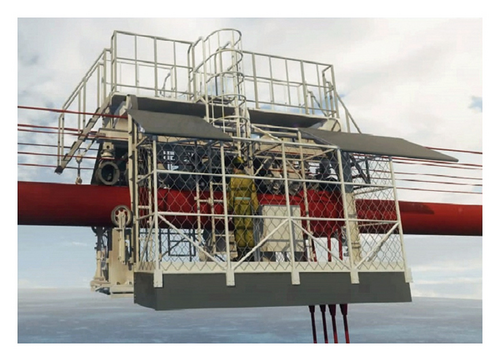
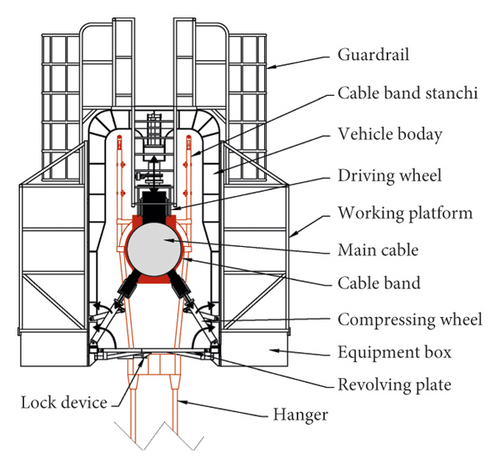
To inspect the main cable of a suspension bridge, an inspection vehicle is designed and manufactured, as shown in Figure 1. The inspection vehicle adopts the wheeled walking scheme of “10 sets of driving wheels +3 pairs of compressing wheels (driven wheels)” to surround the main cable. The vehicle body is a Π-shaped steel frame, and the other parts are aluminum alloy trusses. The whole vehicle weighs 8.5 t, including a 1 t live load. Three sets of lock devices are installed on each pair of revolving plates at the bottom of the vehicle body to increase the rigidity of the vehicle body. The inspection vehicle adopts automatic control technology to perform the alternate lifting and lowering of the driving wheels, the advancing and retracting of the compressing wheels, the rotating of flaps, and the switching of lock devices by controlling the hydraulic cylinders to straddle obstacles such as cable bands and hangers. The vehicle can identify cable bands automatically, climb cable bands actively, and crawl at a large angle (30°) when manned.
The inspection vehicle drives on the main cable, which is a typical wind-sensitive structure. Wind-induced vibration directly affects the security of equipment and the efficiency of workers [7]. Therefore, the dynamic properties of the main cable-inspection vehicle coupled system under wind loads should be studied when the inspection vehicle is designed. Researchers have conducted numerous field measurements to investigate the wind-induced vibration characteristics of suspension bridges [8–10]. Field measurement is the most direct and reliable method to obtain site wind data [11–13]. However, this approach requires a long period and is easily affected by environmental conditions. Li et al. [14], Chen et al. [15], and Li et al. [16] investigated the wind characteristics of different bridge sites through wind tunnel tests to provide a basis for bridge design. Although this method is not affected by the geographical environment, accurate models must be built, and the cost can be extremely expensive. With the development of theoretical studies and computer technology, simulation experiments have been increasingly used to study the effects of various factors on bridge components at the initial stage of the research work to reduce the number of field measurements and tunnel tests [17, 18]. Field measurements and tunnel tests are usually used for final validation. Bai et al. [19] and Helgedagsrud et al. [20] performed and validated simulation experiments by comparing different simulation results with those of wind tunnel tests. However, these studies focused on the wind-induced vibration of suspension bridges, and few studies have focused on the wind-induced vibration of mobile devices on the main cable.
The inspection vehicle was developed in the specialized field of mobile robots. In most previous studies, researchers focused on the design and vibration caused by the climbing of robots. Kim et al. [4] and Cho et al. [5] manufactured a wheel-based robot and a caterpillar-based robot for the inspection of a hanger rope, and the climbing abilities of both robots were validated in indoor experimental environments. Xu et al. [6] designed a cable-climbing robot for cable-stayed bridges, and the obstacle-climbing performance of each robot was simulated and validated in the laboratory. However, these robots are all tiny unmanned robots, and only structural safety must be considered. For a manned inspection vehicle, the vibration of the vehicle may cause discomfort or annoy the workers and influence performance [21]. These factors must be studied in the design process. The wind-induced vibration of the inspection vehicle is a complicated solid-wind-cable interaction problem, and the corresponding action mechanism has not yet been effectively studied.
The simulation of a random wind field is essential for time-domain vibration analysis of the inspection vehicle under wind loads. Based on the Monte Carlo method, the digital filtering method and the spectral representation method (SRM) [22] are two basic approaches used to simulate the random wind field. SRM, the method adopted in this paper, has been widely used in the engineering community due to its accuracy and simplicity [23, 24]. In order to improve the efficiency of SRM for the simulation of multidimensional wind fields, Tao et al. [23, 25], Huang et al. [24], and Xu et al. [26] proposed different optimization methods for solving. With the development of sensor technology, the study of wind fields has gradually been extended from stationary fields to nonstationary fields, especially for extreme wind [27, 28]. However, no empirical model is available for nonstationary winds due to the difficulties in mathematical treatments and nonergodic characteristics [28]. Therefore, stationary wind is the objective of this paper.
The purpose of this paper is to propose a method of assessing the vibration response of a main cable-inspection vehicle coupled system under fluctuating wind conditions. This paper is organized as follows: In Section 2, the process for establishing a suspension bridge finite element (FE) model and a main cable-inspection vehicle coupled FE model is introduced in detail. Taking the Qingshui River Bridge as an example, the mean wind speed distribution characteristics at the bridge site are analyzed and the wind field is simulated in Section 3. Section 4 presents the ride comfort evaluation method based on the ISO 2631-1-1997 standard [21]. A modal analysis of the suspension bridge FE model, transient analysis of both FE models, and ride comfort evaluation of the vehicle are conducted in Section 5. Finally, the conclusions and future work are discussed in Section 6.
2. Finite Element Model
The unit length mass of the inspection vehicle is much smaller than that of the suspension bridge. The inspection vehicle has little influence on the vibration amplitude and acceleration of the cable [29]. Therefore, the influence of the inspection vehicle on the vibration response of the bridge is not considered in this study. In order to simplify the study, the suspension bridge FE model and the main cable-inspection vehicle coupled FE model are established. MIDAS Civil software is used for the suspension bridge FE Model because of the accuracy and accessibility of its built-in formulas. For the main cable-inspection vehicle coupled FE model, ANSYS software is used due to the variety of its element types and the flexibility of its ANSYS Parametric Design Language (APDL). The dynamic displacement of the main cable which is recorded over time from the suspension bridge FE model is taken as the excitation source for the main cable-inspection vehicle coupled FE model to realize one-way coupling between two FE models.
2.1. Suspension Bridge FE Model
The Qingshui River Bridge, located in Guizhou Province, China, is 27 m wide with a main span of 1130 m. The structure is a single-span steel truss suspension bridge located in a mountainous area, connecting the expressway from Guizhou to Weng’an, as shown in Figure 2xb is the axial direction of the bridge, yb is the direction of the bridge width, and zb is the vertical direction.

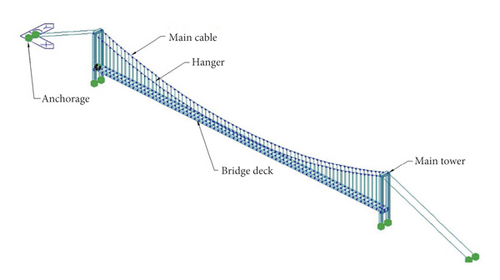
The FE model of the Qingshui River Bridge was built using MIDAS Civil software, as presented in Figure 3. Beam elements are used for the bridge deck and towers. Truss elements are used for the main cable and hangers and are tension-only elements. The structural parameters of the bridge FE model are listed in Table 1. The bottom of each tower and each anchorage are fixed. The bridge deck is connected to two main towers by elastic contacts in both the y and z directions, with ratings of 1000000 kN/m. One end of the bridge deck is constrained in the x direction. The weight of the bridge deck, two main cables, and all hangers are added to the nodes of the bridge deck and main cables in the form of a uniformly distributed mass load. Fluctuating wind loads are applied to the bridge deck and the main cables simultaneously on the elasticity center nodes in a given time sequence. The damping ratio is defined as 0.005.
| Part | A (m2) | Iy (m4) | Iz (m4) | ρ (kg/m3) | W (kN/m) | E (GPa) |
|---|---|---|---|---|---|---|
| Main tower | 56.0 | 752.6 | 762.3 | 2500 | — | 34.5 |
| Bridge deck | 4.594 | 6.78 | 223.41 | — | 256.0 | 205 |
| Main cable | 0.3526 | — | — | — | 27.679 | 192 |
| Hanger | 0.0017 | — | — | — | 0.134 | 192 |
- A, cross-sectional area; Iy, vertical section moment of inertia; Iz, transverse section moment of inertia; E, Young’s modulus; ρ, density; W, weight per unit length.
2.2. Main Cable-Inspection Vehicle Coupled FE Model
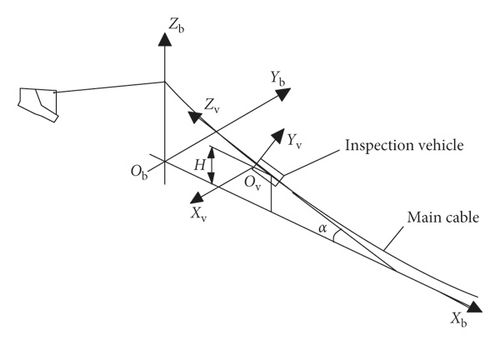
The structure of the main cable-inspection vehicle coupled system is shown in Figure 4xv is the width direction of the bridge deck, yv is the direction perpendicular to the tangential direction of the main cable centerline, and zv is the tangential direction of the main cable centerline.
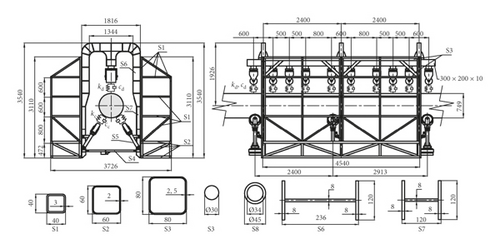
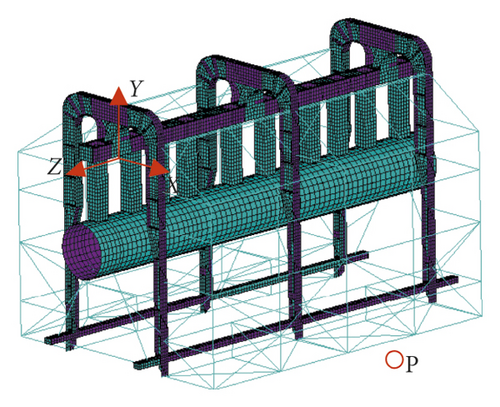
The FE model of the main cable-inspection vehicle coupled system was established in ANSYS software, as shown in Figure 5. The main cable is defined as a rigid body. SHELL 63 elements are used for the vehicle body, and BEAM 188 elements are used for working platforms, compressing wheel brackets, and the equipment box truss. The guardrail, compressing wheels, driving wheels, power system, and control system are omitted, and the weight of each part is added to the model by adjusting the material density of the local structure. The parameters of the material are shown in Table 2. Between the driving wheels and main cable or the compressing wheels and main cable are viscoelastic contacts, which are defined as spring-damping contacts. The parameters of the spring-damping contacts are shown in Table 3. Fluctuating wind loads are applied to the vehicle on the windward nodes in a given time sequence. The dynamic displacement of the main cable that is recorded over time from the suspension bridge FE model is taken as the excitation source.
| Part | E (MPa) | ν | ρ (kg/m3) |
|---|---|---|---|
| Main cable | Rigid body | — | — |
| Vehicle body | 2.05 × 10⁵ | 0.3 | 7850 |
| Driving/compression wheel | 2.05 × 10⁵ | 0.3 | 60000 |
| Working platform | 6.9 × 10⁴ | 0.33 | 4000 |
| Equipment box | 6.9 × 10⁴ | 0.33 | 85000 |
- E, Young’s modulus; ν, Poisson’s ratio; ρ, density.
| Parameters | kd (N/mm) | cd (N·s/mm) | kc (N/mm) | cc (N·s/mm) |
|---|---|---|---|---|
| Value | 285.3 | 0.2 | 1500 | 0.2 |
- kd and cd are the spring stiffness and viscous damping coefficient of the contact between the driving wheels and main cable, respectively; kc and cc are the spring stiffness and viscous damping coefficient of the contact between the compressing wheels and main cable, respectively.
For consistency in the comparison of results, the vibration of node P, located at the bottom of the middle of the working platform on the windward side (see Figure 5), is investigated in the following analysis.
2.3. Coordinate Relationship
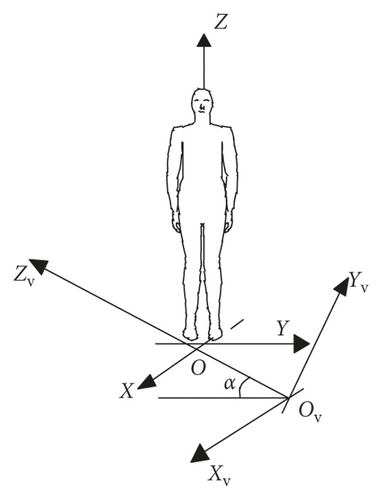
The inspection vehicle drives along the main cable during work, which results in changes in both the inclination angle (α) and working height (H) of the inspection vehicle. According to the different heights of the main cable from the bridge deck, H is set at 5 m, 35 m, 65 m, 95 m, and 113 m. The relation between H and α is shown in Table 4. According to the selected coordinate system when establishing the FE models, the coordinate relationships between the suspension bridge and inspection vehicle and the vehicle and a worker are shown in Figure 6.
| H | 5 m | 35 m | 65 m | 95 m | 113 m |
| α | 0° | 12.1° | 16.8° | 20.2° | 21.3° |
3. Wind Speed and Wind Load Simulation
3.1. Wind Speed Simulation
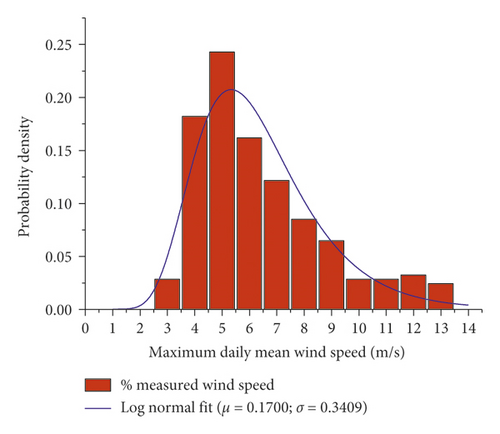
Figure 7 shows that the maximum daily mean wind speed is 13.3 m/s. Because a real-time wind speed alarm system is installed on the inspection vehicle, the influence of height on wind speed is neglected. Therefore, the design maximum working mean wind speed of the inspection vehicle is 13.3 m/s ().
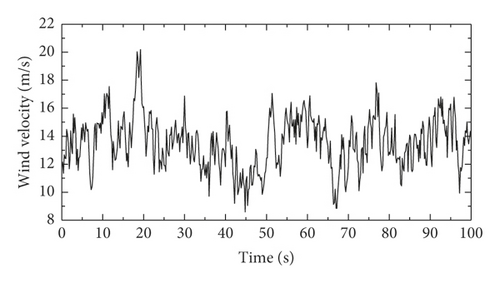
Referring to the JTG/T D60-01-2004 standard [35], the bridge site is classified as Class D, k is taken as 0.01291, and the ground roughness index is taken as 0.3. Using fast Fourier transform (FFT) and the random number generator in MATLAB, wind speed curves in the time domain can be simulated. Thirty-seven simulation points are uniformly distributed along the length of the bridge deck. This paper only considers the effect of the cross-bridge wind, and the angle between the incoming wind direction and primary flow plane is taken as 0°. The simulated fluctuating wind speed time history at the middle-span position (z = 10 m; = 13.3 m/s) for the bridge is presented in Figure 8.
3.2. Wind Load Simulation
Wind load on a bridge can be classified into three parts: static wind load, buffeting load, and self-excited load. Chen et al. found that the effect of the self-excited force is limited when the wind speed is lower than the design basic wind speed [36]. Therefore, only static wind load and buffeting load on the bridge are considered in this paper.
4. Comfort Evaluation
The relationship between av and subjective sensory comfort is shown in Table 5 [21]. After calculating av, it is convenient to quantitatively evaluate the ride comfort of the inspection vehicle.
| av (m/s2) | Comfort level |
|---|---|
| <0.315 | Not uncomfortable |
| 0.315∼0.63 | A little uncomfortable |
| 0.5∼1.0 | Fairly uncomfortable |
| 0.8∼1.6 | Uncomfortable |
| 1.25∼2.5 | Very uncomfortable |
| >2.0 | Extremely uncomfortable |
5. Results and Analysis
5.1. Suspension Bridge FE Model Verification
The block-Lanczos method was used in the modal analysis of a suspension bridge to verify the correctness of the proposed suspension bridge FE model. To measure the modal characteristics of the suspension bridge, a full-bridge aeroelastic model was constructed that was scaled to C = 1/100 of the original. According to the similarity criterion suggested in the JTG/T D60-01-2004 standard [35], the major design parameters of the model are listed in Table 6. The full-bridge aeroelastic elastic model was composed of the bridge deck, main towers, main cables, hangers, and bases. The model main beam adopted aluminum chords and plastic diagonals. The bridge deck consisted of 37 sections with a 2 mm gap between each section and a U connection between two sections. Each tower contained a steel core beam and wooden boards that provided an aerodynamic shape. Steel strand provided stiffness of cable, and an iron block was enwrapped outside the cable to control the weight. Each hanger consisted of a steel wire without shear stiffness but with high tension stiffness. Lead blocks were used to adjust the weight of the model and were installed inside the bridge deck model. Plastic boards were used to simulate the aeroelastic shape of the deck rail. The test was conducted in the Industrial Wind Tunnel (XNJD-3) of Southwest Jiaotong University, as shown in Figure 9. The dynamic response of the model was measured by the forced oscillation method [14]. Two laser displacement sensors were used to obtain the vibration signal in the test. A comparison of the results of the FE modal analysis and experiment modal test of the first 4 vibration modes is presented in Table 7. The table shows that the modes of vibration are fully consistent, and the difference in frequency values is less than 5%. Therefore, the FE model of the suspension bridge has high accuracy and can effectively reflect the dynamic characteristics of the suspension bridge.
| Parameter | Unit | Similarity ratio | Value of the real bridge | Value of the model |
|---|---|---|---|---|
| Length | ||||
| Total length of bridge deck (L) | m | C | 1130 | 11.3 |
| Width of bridge deck (B) | 27 | 0.27 | ||
| Height of bridge deck (H) | 7 | 0.07 | ||
| Height of main tower (Ht) | 230 | 2.3 | ||
| Stiffness | ||||
| Vertical stiffness of bridge deck, EIy | Nm2 | C5 | 1.39 × 10¹² | 1.39 × 10² |
| Transverse stiffness of bridge deck, EIz | 4.58 × 10¹³ | 4.58 × 10³ | ||
| Along-bridge direction stiffness of the bottom of main tower, EIy | 2.63 × 10¹³ | 2.63 × 10³ | ||
| Transverse stiffness of the bottom of main tower, EIz | 12.60 × 10¹³ | 12.60 × 10³ |

| Mode no. | Frequency | Mode of vibration | Remark | ||
|---|---|---|---|---|---|
| Experiment modal test (Hz) | FE modal analysis (Hz) | Difference (%) | |||
| 1 | 0.0844 | 0.0818 | 3.1 |  |
Symmetric lateral vibration |
| 2 | 0.1660 | 0.1608 | 3.1 |  |
Antisymmetric vertical vibration |
| 3 | 0.1777 | 0.1812 | 2.0 |  |
Symmetric vertical vibration |
| 4 | 0.2435 | 0.2542 | 4.4 |  |
Antisymmetric lateral vibration |
5.2. Wind-Induced Vibration Response of the Main Cable
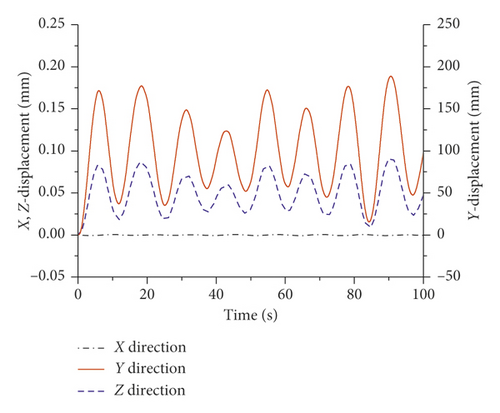
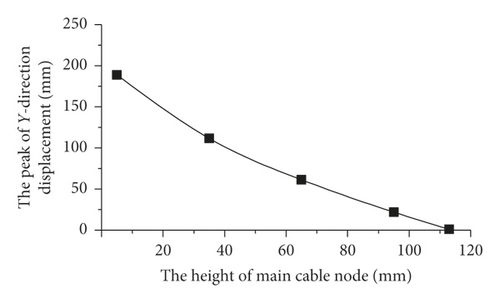
After validation, the suspension bridge FE model can be used to analyze the vibration characteristics of the main cable with fluctuating winds as the excitation source. Figure 10 shows the vibration displacement history of the node at the middle-span position, which is 5 m above the bridge deck surface in the bridge coordinate system Ob—XbYbZb. The vibration frequency of the main cable is 0.0815, which is consistent with the first-order frequency of the suspension bridge. The results are also consistent with the conclusion of Huang et al. [40]. The main vibration direction of the main cable is the Y direction (lateral direction). The peak value of the Y-direction vibration displacement is 188.7 mm, and the peak values of X-direction and Z-direction vibration displacement are less than 0.1 mm. Therefore, only the Y-direction vibration of the main cable node is considered in the study of the wind-induced vibration response in the main cable-inspection vehicle coupled FE model. As the height of the main cable node increases, the constraint on the node from the cable saddle becomes stronger and the peak value of the Y-direction vibration displacement of the node gradually decreases, as shown in Figure 11.
5.3. Wind-Induced Vibration Response of the Inspection Vehicle
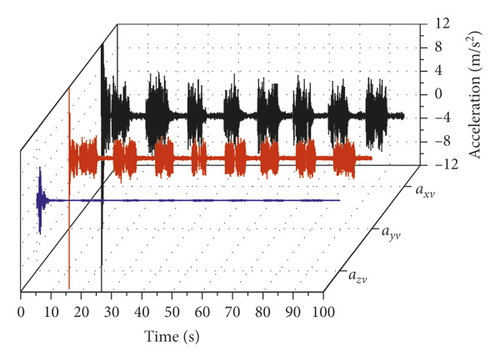
The transient analysis of the main cable-inspection vehicle coupled FE model was performed with the fluctuating wind and the displacement of the main cable node as the excitation sources. Figure 12 shows the vibration acceleration time history of the inspection vehicle node P at a height of 5 m in the moving coordinate system Ov—XvYvZv. At this time, all the driving wheels and compressing wheels of the inspection vehicle are in contact with the main cable. The vibration of the inspection vehicle has a large impact from 0 s to 10 s, which is due to the impact of gravity applied during simulation. This phenomenon will not occur during the operation of the inspection vehicle. Therefore, all subsequent acceleration statistics start from 10 s to maintain accuracy. The peak value of the X-direction vibration acceleration (axv) at node P at a height of 5 m is the largest at 7.86 m/s2, and the peak value of the Z-direction vibration acceleration (azv) is the smallest at 0.55 m/s2. The peak value of the Y-direction vibration acceleration (ayv) is 3.81 m/s2. Therefore, the main vibrations of the inspection vehicle are X-direction vibration and Y-direction vibration.
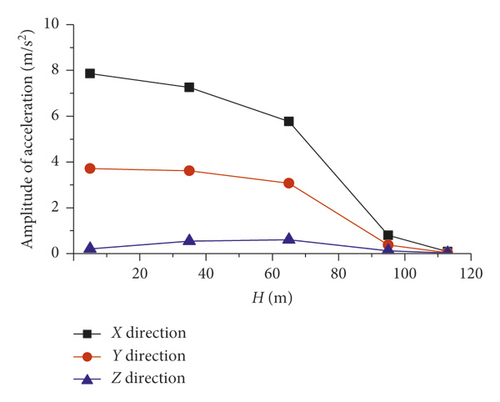
When the inspection vehicle climbs along the main cable, the working height (H) and inclination angle (α) of the inspection vehicle increase simultaneously. Due to the influence of the constraint on the nodes of the cable from the main cable saddle strength and the increase in the gravity component in the Z direction of the inspection vehicle, the peak values of the X-direction and Y-direction vibration acceleration of the inspection vehicle gradually decrease and the peak value of the Z-direction vibration acceleration initially increases and then decreases, as shown in Figure 13.
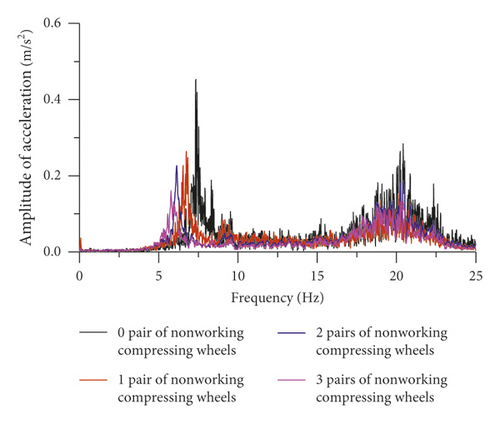
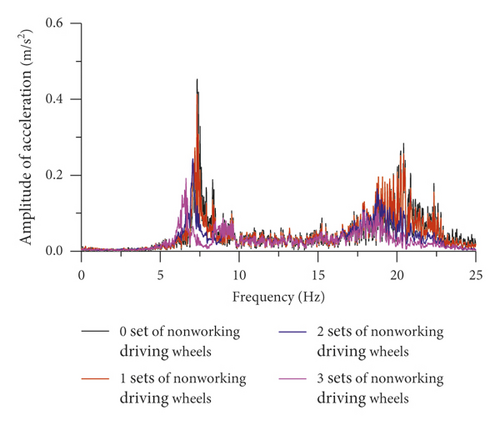
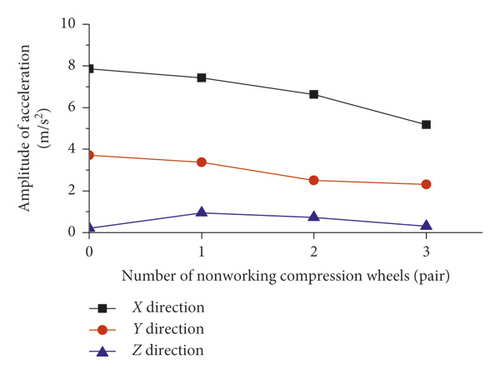
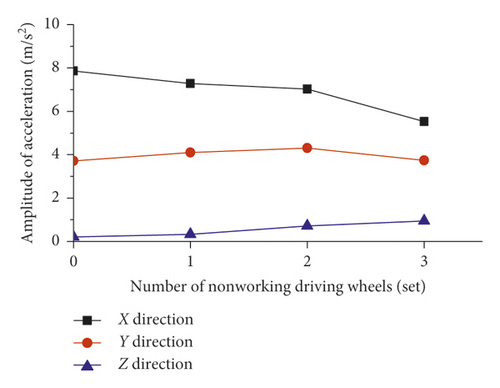
When the inspection vehicle crosses the cable band, the driving wheels need to be lifted and the compressing wheels need to be alternately opened. Lifting the driving wheels or opening the compressing wheels will change the coupling relationship between the inspection vehicle and the main cable and will reduce the contact stiffness between them, resulting in simultaneous reductions in the main frequency and the main frequency amplitude, as shown in Figure 14. As the number of nonworking compression wheels increases, the vertical and lateral contact stiffness values between the inspection vehicle and the main cable simultaneously decrease, resulting in a gradual decrease in the peak values of both the X-direction and Y-direction vibration acceleration of the inspection vehicle and an initial increase and subsequent decrease in the peak value of the Z-direction vibration acceleration, as shown in Figure 15. As the number of nonworking driving wheels increases, the vertical contact stiffness between the inspection vehicle and the main cable decreases, resulting in a gradual decrease in the peak value of the X-direction vibration acceleration of the inspection vehicle, a nonobvious change in the peak value of the Y-direction vibration acceleration, and a slow increase in the peak value of the Z-direction vibration acceleration, as shown in Figure 16.
5.4. Ride Comfort Evaluation of the Inspection Vehicle
The inspection vehicle is a type of aerial work equipment. Vibration of the vehicle can not only induce psychological panic in workers but also affect the work efficiency and health of workers [21]. Therefore, it is necessary to analyze the ride comfort of the vehicle. Through coordinate transformation, the vibration acceleration transmitted to the foot of a worker in the inspection vehicle is obtained and the vehicle ride comfort is further analyzed. Figure 17 illustrates the variation curves of the vibration total values of the weighted rms acceleration (av).
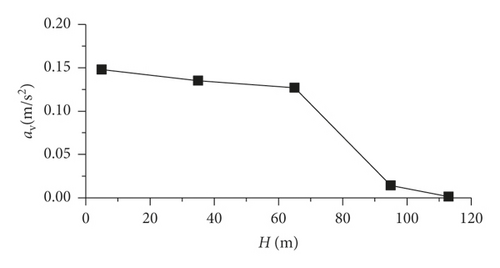
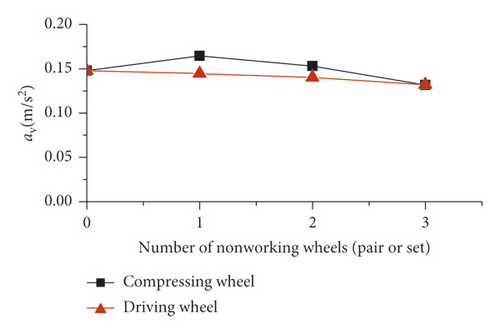
Figure 17(a) shows that as the working height of the inspection vehicle increases, the value of av decreases slowly first and then sharply and the maximum reduction ratio of av is 99.0%. The ride comfort of the inspection vehicle is improved due to the vehicle acceleration change described in Section 5.3. When the inspection vehicle works at the middle-span position (H = 5 m), the value of av reaches a maximum of 0.1478 m/s2, which is less than 0.315 m/s2, and the vehicle ride comfort level is “not uncomfortable.”
Figure 17(b) shows that when one pair of compressing wheels at the end of the vehicle is opened, the value of av reaches a maximum of 0.1646 m/s2, which is less than 0.315 m/s2. Thus, the vehicle comfort level is “not uncomfortable” because as the number of open compressing wheel pairs increases, the main frequency of vehicle vibration decreases. In this case, the frequency gradually approaches the sensitive frequency of the human body and the vehicle acceleration changes as described in Section 5.3. As the number of nonworking driving wheels increases, the value of av slowly decreases, and the vehicle ride comfort improves due to the decreases in the main frequency and amplitude of the main frequency described in Section 5.3. When all the driving wheels contact the main cable, the value of av is the largest at 0.1478 m/s2, less than 0.315 m/s2. Therefore, the vehicle ride comfort level is “not uncomfortable.”
6. Conclusions
- (1)
By comparing the results of the FE modal analysis and modal test of the first 4 vibration modes, the vibration modes are fully consistent and the difference in frequency values between them is less than 5%. The validity of the FE model of the suspension bridge is verified.
- (2)
Through the transient analysis under fluctuating wind conditions, the main vibration direction of the main cable is the lateral direction and the main vibration directions of the inspection vehicle are the X direction and Y direction. The increase in the working height will lead to a significant reduction in the vibration displacement amplitude of the main cable node and a significant reduction in the vibration response of the inspection vehicle. An increase in the number of nonworking compressing wheels or nonworking driving wheels will result in a decrease in the main frequency and slowly reduce the vibration response of the inspection vehicle.
- (3)
The vehicle ride comfort evaluation under different working conditions shows that an increase in the working height improves the vehicle ride comfort due to the reduction in the vibration response of the inspection vehicle. The increase in the number of nonworking compressing wheels affects the vibration amplitude and frequency of the vehicle, which results in an initial deterioration and subsequent improvement in vehicle ride comfort. The increase in the number of nonworking driving wheels will lead to improved vehicle ride comfort.
- (4)
The vehicle ride comfort analysis shows that when the average wind speed of the inspection vehicle is below 13.3 m/s, the maximum value of av for the vehicle is 0.1646 m/s2 and the vehicle ride comfort level is “not uncomfortable,” which meets the users’ requirements.
The simulation results presented demonstrate that the numerical analysis method proposed in this paper can be implemented to evaluate wind-induced vibration characteristics for other similar devices working on the main cable. However, comparisons and experimental tests on the influence of the long-term driving of the inspection vehicle on the main cable protective layer have yet to be achieved. These issues remain potential topics of future work.
Conflicts of Interest
The authors declare that they have no conflicts of interest.
Acknowledgments
This research was supported by the National Natural Science Foundation of China (no. 51675450) and the Guizhou Science and Technology Special Project (no. 20156001).
Open Research
Data Availability
The data used to support the findings of this study are available from the corresponding author upon request.


