Impacts of Different Physical Parameterization Configurations on Widespread Heavy Rain Forecast over the Northern Area of Vietnam in WRF-ARW Model
Abstract
This study investigates the impacts of different physical parameterization schemes in the Weather Research and Forecasting model with the ARW dynamical core (WRF-ARW model) on the forecasts of heavy rainfall over the northern part of Vietnam (Bac Bo area). Various physical model configurations generated from different typical cumulus, shortwave radiation, and boundary layer and from simple to complex cloud microphysics schemes are examined and verified for the cases of extreme heavy rainfall during 2012–2016. It is found that the most skilled forecasts come from the Kain–Fritsch (KF) scheme. However, relating to the different causes of the heavy rainfall events, the forecast cycles using the Betts–Miller–Janjic (BMJ) scheme show better skills for tropical cyclones or slowly moving surface low-pressure system situations compared to KF scheme experiments. Most of the sensitivities to KF scheme experiments are related to boundary layer schemes. Both configurations using KF or BMJ schemes show that more complex cloud microphysics schemes can also improve the heavy rain forecast with the WRF-ARW model for the Bac Bo area of Vietnam.
1. Introduction
Elongated to 15 degrees (from 8 to 23 degrees north), Vietnam weather is affected by a variety of extratropical and tropical systems such as cold surges and cold fronts, subtropical troughs and monsoon, tropical disturbances, and typhoons [1–3, 4]. An approximate number of 28–30 heavy rain events occurring over the whole Vietnam region every year were determined from local surface stations. According to Nguyen et al. [4], the rainy season in the Vietnam area usually lasts from May to October with the peak rainy months starting in the north and then moving to the south with time because of the movement of the subtropical ridge and Intertropical Convergence Zone (ITCZ). In the northern part of Vietnam, the peak rainy months can be seen during the June–September period, particularly in July and August, which is partly related to the activity of the ITCZ [5].
Apart from single weather patterns causing heavy rain for Vietnam, it is common to observe a mix of different patterns simultaneously. A good example for this is the historical rain and flood over Central Vietnam in the Hue city in 1999 due to the combination of cold surges and tropical depression-type disturbances [6]. In 2008, extreme heavy rain was witnessed in Hanoi as a result of the dramatic intensification of the easterly disturbance through the midlatitude-tropical interactions [7]. Likewise, a surface low pressure which coincided with the subtropical upper-level trough was the main factor causing historical rainfall over northeastern Vietnam in Quang Ninh Province in 2015 [8].
In the northern part of Vietnam (hereinafter referred to as Bac Bo area)—the focus area of this study—tropical cyclones or surface low-pressure patterns are one among several key factors leading to heavy rain for different regions in Vietnam. ITCZ plays the vital role in facilitating the development of low-level vortexes which are likely to develop into tropical disturbances and typhoons in the summer time, particularly in July and August. As a result, rain may fall over the Bac Bo area with excessive amount, and rain duration directly depends upon the lifetime of ITCZ and the disturbances itself. The other causing reasons are related to the effects of cold surge from the north (Siberian area) or the combinations of different patterns (a cold surge with a tropical cyclone, a cold surge with a trough, a surface low-pressure system with a trough, etc.). Table 1 provides the observed precipitation from SYNOP stations in the Bac Bo area with the annual rainfall mostly ranging from 1500 to 2000 mm and a high number of daily heavy rain occurrences (over 50 mm/24 h and 100 mm/24 h).
| Station name | Long. | Lat. | Annual rain | #50 mm | #100 mm |
|---|---|---|---|---|---|
| Muong Te | 102.83 | 22.37 | 2423 | 11 | 2 |
| Sin Ho | 103.23 | 22.37 | 2787 | 13 | 2 |
| Tam Duong | 103.48 | 22.42 | 2355 | 9 | 2 |
| Muong La | 104.03 | 21.52 | 1412 | 5 | 1 |
| Than Uyen | 103.88 | 21.95 | 1920 | 8 | 1 |
| Quynh Nhai | 103.57 | 21.85 | 1678 | 7 | 1 |
| Mu Cang Chai | 104.05 | 21.87 | 1741 | 5 | 1 |
| Tuan Giao | 103.42 | 21.58 | 1586 | 5 | 1 |
| Pha Din | 103.5 | 21.57 | 1840 | 6 | 1 |
| Van Chan | 104.52 | 21.58 | 1481 | 6 | 1 |
| Song Ma | 103.75 | 21.5 | 1118 | 2 | 0 |
| Co Noi | 104.15 | 21.13 | 1308 | 4 | 0 |
| Yen Chau | 104.3 | 21.05 | 1229 | 3 | 0 |
| Bac Yen | 104.42 | 21.23 | 1519 | 4 | 0 |
| Phu Yen | 104.63 | 21.27 | 1496 | 5 | 1 |
| Minh Dai | 105.05 | 21.17 | 1695 | 6 | 1 |
| Moc Chau | 104.68 | 20.83 | 1581 | 5 | 1 |
| Mai Chau | 105.05 | 20.65 | 1698 | 7 | 1 |
| Pho Rang | 104.47 | 22.23 | 1648 | 7 | 1 |
| Bac Ha | 104.28 | 22.53 | 1611 | 4 | 0 |
| Hoang Su Phi | 104.68 | 22.75 | 1739 | 5 | 1 |
| Bac Me | 105.37 | 22.73 | 1753 | 6 | 0 |
| Bao Lac | 105.67 | 22.95 | 1179 | 3 | 0 |
| Bac Quang | 104.87 | 22.5 | 4295 | 24 | 9 |
| Luc Yen | 104.78 | 22.1 | 1917 | 8 | 1 |
| Ham Yen | 105.03 | 22.07 | 1858 | 8 | 1 |
| Chiem Hoa | 105.27 | 22.15 | 1631 | 6 | 1 |
| Cho Ra | 105.73 | 22.45 | 1417 | 5 | 0 |
| Nguyen Binh | 105.9 | 22.65 | 1686 | 6 | 1 |
| Ngan Son | 105.98 | 22.43 | 1853 | 8 | 1 |
| Trung Khanh | 106.57 | 22.83 | 1821 | 7 | 2 |
| Dinh Hoa | 105.63 | 21.92 | 1749 | 8 | 2 |
| Bac Son | 106.32 | 21.9 | 1693 | 7 | 2 |
| Huu Lung | 106.35 | 21.5 | 1572 | 7 | 1 |
| Dinh Lap | 107.1 | 21.53 | 1865 | 7 | 2 |
| Quang Ha | 107.75 | 21.45 | 2883 | 16 | 5 |
| Phu Ho | 105.23 | 21.45 | 1480 | 6 | 1 |
| Tam Dao | 105.65 | 21.47 | 2585 | 13 | 4 |
| Hiep Hoa | 105.97 | 21.35 | 1601 | 6 | 1 |
| Bac Ninh | 106.08 | 21.18 | 1608 | 7 | 2 |
| Luc Ngan | 106.55 | 21.38 | 1406 | 6 | 1 |
| Son Dong | 106.85 | 21.33 | 1686 | 8 | 2 |
| Ba Vi | 105.42 | 21.15 | 1942 | 9 | 2 |
| Ha Dong | 105.75 | 20.97 | 1635 | 7 | 1 |
| Chi Linh | 106.38 | 21.08 | 1536 | 7 | 1 |
| Uong Bi | 106.75 | 21.03 | 1824 | 9 | 2 |
| Kim Boi | 105.53 | 20.33 | 2115 | 9 | 2 |
| Chi Ne | 105.78 | 20.48 | 1841 | 8 | 2 |
| Lac Son | 105.45 | 20.45 | 2040 | 9 | 2 |
| Cuc Phuong | 105.72 | 20.25 | 1918 | 9 | 2 |
| Yen Dinh | 105.67 | 19.98 | 1509 | 7 | 1 |
| Sam Son | 105.9 | 19.75 | 1759 | 9 | 3 |
| Do Luong | 105.3 | 18.89 | 1871 | 9 | 2 |
| Lai Chau | 103.15 | 22.07 | 2178 | 10 | 2 |
| Sa Pa | 103.82 | 22.35 | 2581 | 10 | 2 |
| Lao Cai | 103.97 | 22.5 | 1704 | 7 | 1 |
| Ha Giang | 104.97 | 22.82 | 2372 | 12 | 2 |
| Son La | 103.9 | 21.33 | 1456 | 4 | 1 |
| That Khe | 106.47 | 22.25 | 1482 | 6 | 1 |
| Cao Bang | 106.25 | 22.67 | 1439 | 6 | 1 |
| Bac Giang | 106.22 | 21.3 | 1518 | 7 | 1 |
| Hon Ngu | 105.77 | 18.8 | 2007 | 11 | 4 |
| Bac Can | 105.83 | 22.15 | 1421 | 5 | 1 |
| Dien Bien Phu | 103 | 21.37 | 1536 | 5 | 1 |
| Tuyen Quang | 105.22 | 21.82 | 1654 | 8 | 2 |
| Viet Tri | 105.42 | 21.3 | 1601 | 8 | 2 |
| Vinh Yen | 105.6 | 21.32 | 1489 | 6 | 1 |
| Yen Bai | 104.87 | 21.7 | 1768 | 8 | 1 |
| Son Tay | 105.5 | 21.13 | 1612 | 7 | 1 |
| Hoa Binh | 105.33 | 20.82 | 1828 | 8 | 2 |
| Huong Son | 105.43 | 18.52 | 2135 | 10 | 4 |
| Ha Noi | 105.8 | 21.03 | 1647 | 8 | 2 |
| Phu Ly | 105.92 | 20.55 | 1731 | 8 | 2 |
| Hung Yen | 106.05 | 20.65 | 1381 | 6 | 1 |
| Nam Dinh | 106.15 | 20.39 | 1564 | 7 | 1 |
| Ninh Binh | 105.97 | 20.23 | 1662 | 8 | 2 |
| Phu Lien | 106.63 | 20.8 | 1572 | 7 | 1 |
| Hai Duong | 106.3 | 20.93 | 1561 | 7 | 1 |
| Hon Dau | 106.8 | 20.67 | 1501 | 8 | 1 |
| Van Ly | 106.3 | 20.12 | 1620 | 9 | 2 |
| Lang Son | 106.77 | 21.83 | 2874 | 12 | 2 |
| Thai Nguyen | 105.83 | 21.6 | 1266 | 5 | 1 |
| Nho Quan | 105.73 | 20.32 | 1728 | 8 | 2 |
| Bai Chay | 107.07 | 20.97 | 1700 | 8 | 2 |
| Co To | 107.77 | 20.98 | 1933 | 10 | 3 |
| Thai Binh | 106.35 | 20.45 | 1930 | 10 | 3 |
| Cua Ong | 107.35 | 21.02 | 1591 | 8 | 1 |
| Tien Yen | 107.4 | 21.33 | 2189 | 12 | 3 |
| Mong Cai | 107.97 | 21.52 | 2168 | 10 | 3 |
| Bach Long Vi | 107.72 | 20.13 | 2670 | 15 | 5 |
| Huong Khe | 105.72 | 18.18 | 1216 | 6 | 1 |
| Thanh Hoa | 105.78 | 19.75 | 2516 | 12 | 5 |
| Hoi Xuan | 105.12 | 20.37 | 1701 | 8 | 3 |
| Tuong Duong | 104.43 | 19.28 | 1720 | 6 | 1 |
| Vinh | 105.7 | 18.67 | 1305 | 5 | 1 |
| Ha Tinh | 105.9 | 18.35 | 1896 | 10 | 4 |
| Ky Anh | 106.28 | 18.07 | 2507 | 13 | 5 |
| Bai Thuong | 105.38 | 19.9 | 1830 | 7 | 2 |
| Nhu Xuan | 105.57 | 19.63 | 1758 | 8 | 3 |
| Tinh Gia | 105.78 | 19.45 | 1777 | 9 | 3 |
| Quy Chau | 105.12 | 19.57 | 1661 | 7 | 1 |
| Quy Hop | 105.15 | 19.32 | 1579 | 7 | 2 |
| Tay Hieu | 105.4 | 19.32 | 1517 | 7 | 2 |
| Quynh Luu | 105.63 | 19.17 | 1559 | 8 | 2 |
| Con Cuong | 104.88 | 19.05 | 1647 | 7 | 2 |
In Vietnam National Center for Hydro-Meteorological Forecasting (NCHMF), several global model (NWP) products are mostly applied in operational forecast to predict the occurrence of heavy rain. These include the models from National Centers for Environmental Prediction (NCEP), European Centre for Medium-Range Weather Forecasts (ECMWF), Japan Meteorological Agency (JMA), and Germany’s National Meteorological Service (DWD). In addition, some regional NWP products including the High Resolution Regional Model (HRM) (the HRM’s information can be found at DWD’s internet link https://www.dwd.de/SharedDocs/downloads/DE/modelldokumentationen/nwv/hrm/HRM_users_guide.pdf) [9], the Consortium for Small-Scale Modeling (COSMO) [10] models from DWD, and the Weather Research and Forecasting (WRF-ARW) model [11] from the National Center for Atmospheric Research (NCAR) are also a useful reference source in the operational heavy rainfall forecast of Vietnam [12]. Despite the predictability of these models in some certain cases, they may fail to predict extreme events because of several reasons. Lorenz [13] pointed out the three main factors causing uncertainties in NWP are the initial conditions, the imperfection of the models, and the chaos of the atmosphere. While the initial condition problem for NWP can be reduced by data assimilation methods, the imperfection of models, which relates to many subgrid processes, can be alleviated by using proper physical parameterizations. For regional weather forecasting centers with limited capabilities in data assimilation and resource computation to provide the cloud resolved resolution forecast, choosing correct physical parameterization schemes still plays the most important role in downscaling the processes in regional NWP models [14].
To illustrate the dependence of heavy rainfall forecast on physical parameterizations, the typical heavy rainfall event relating to the activities of ITCZ over the South China Sea—the East Sea of Vietnam—from 27 to 30 August 2014 in the Bac Bo area was simulated by the WRF-ARW model (see mean sea level pressure analysis of the GFS model in Figure 1(a)). The 3-day accumulated rainfall was mostly from 100 mm to 150 mm, and some stations recorded more than 200 mm such as Kim Boi which recorded 229 mm (Hoa Binh Province; marked with a square in Figure 1(b)), Dinh Lap 245 mm (Lang Son Province, the northeast area; marked with a star in Figure 1(b)), and Tam Dao 341 mm (Vinh Phuc Province, center of the domain; marked with a circle in Figure 1(b)).
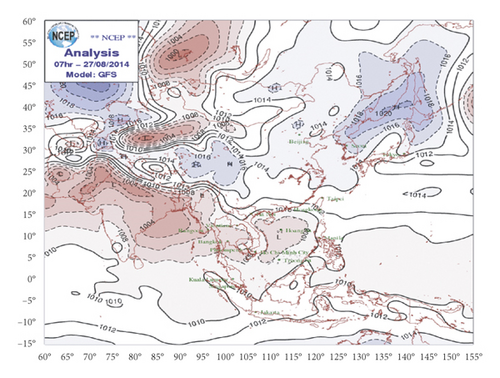
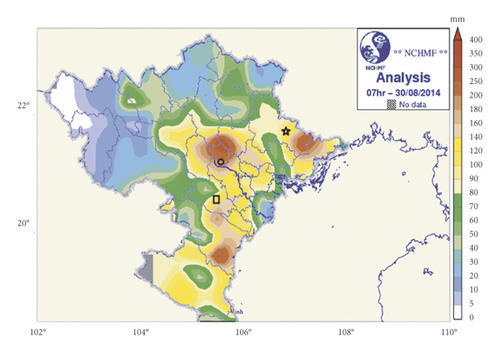
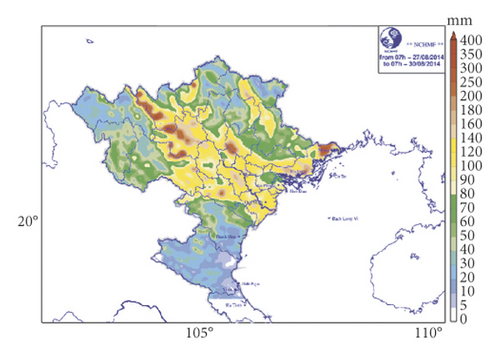
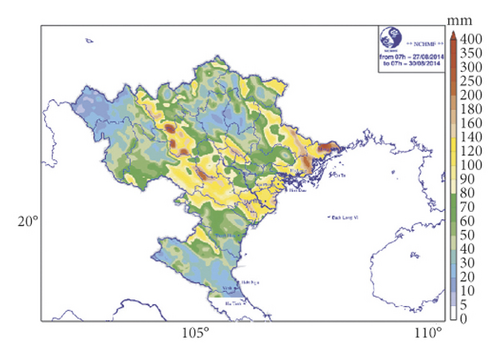
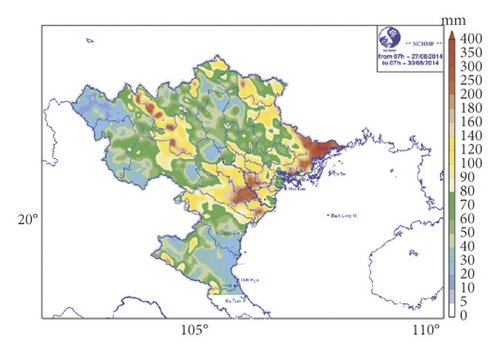
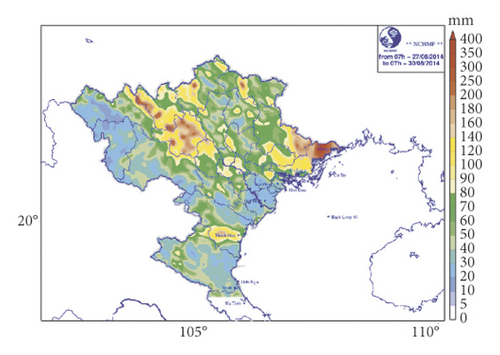
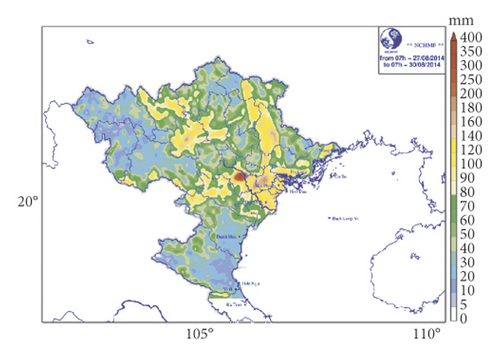
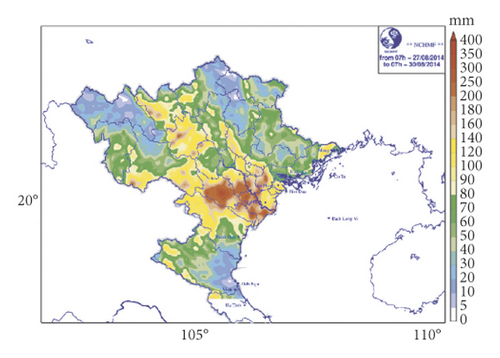
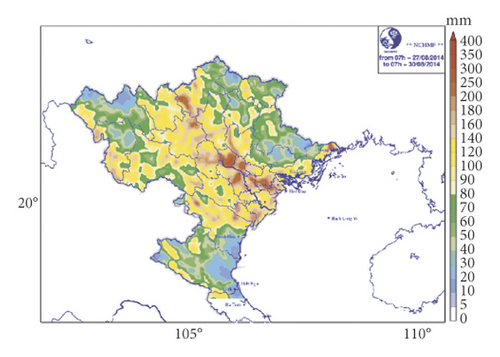
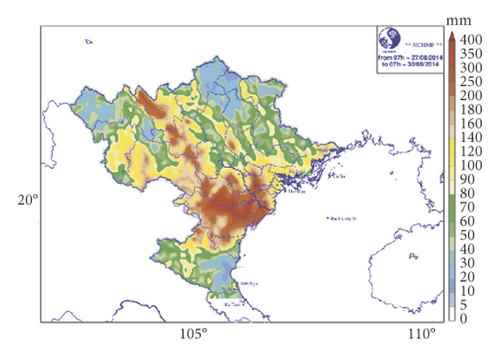
Figure 1 illustrates 72 h accumulated rainfall forecasts from the WRF-ARW model at 5 km horizontal resolution, issued at 00UTC 27/08/2014 with different physical parameterization configurations by combining the Betts–Miller–Janjic (BMJ) or Kain–Fritsch (KF) cumulus schemes, the Lin or WRF single-moment three- or five-class (WSM3/WSM5) cloud microphysics schemes, the Dudhia or Goddard shortwave radiation schemes, and the Yonsei University (YSU) or Mellor–Yamada–Janjic (MYJ) boundary layer schemes.
With the KF cumulus parameterization scheme in Figures 1(c)–1(f), the results show that extreme rainfall over the northeast area (Lang Son Province) can be predictive with the amount of rainfall over >150 mm but was forecasted overestimation for the mountainous regions over the northwest area (Hoang Lien Son mountain ranges). The extreme rainfall over the center of the domain (Vinh Phuc Province) was not simulated well using the KF scheme for this situation.
For the experiments using the BMJ scheme in Figures 1(g)–1(j), the extreme rainfall over the Lang Son Province is underestimated, but cases using Lin or WSM3 for microphysics, Dudhia for shortwave radiation scheme, and the MYJ surface boundary layer (Figure 1(g) and 1(h)) can reduce the overestimation related to Hoang Lien Son mountain ranges in KF scheme experiments. The extreme heavy rainfall over the center of the domain (in Vinh Phuc Province) can be quite well forecasted when using WSM5 with Goddard Hoang Lien Son mountain ranges and the MYJ surface boundary layer (Figure 1(i)). The same configuration in Figure 1(i) but using another surface boundary layer (YSU) scheme provided totally different results (Figure 1(j)) for the southern area of the domain (overestimation).
Many studies have been carried out for validating the effects of physical parameterization schemes in the WRF-ARW model. Zeyaeyan et. al. [15] evaluated the effect of various physic schemes in the WRF-ARW model on the simulation of summer rainfall over the northwest of Iran (NWI). The result shows that cumulus schemes are the most sensitive and microphysics schemes are the least sensitive. The comparison between 15 km and 5 km resolution simulations does not show obvious advantages in downscaling. These investigations showed the best results for both the 5 and 15 km resolutions with model configurations from the newer Tiedtke cumulus scheme, MYJ scheme, and WSM3/Kessler microphysics scheme. Tan [16] processed sensitivity tests with microphysics parameterization of the WRF-ARW model in the concept of quantitative extreme precipitation forecasting for hydrological inputs. About 19 bulk microphysics parameterization schemes were evaluated for a storm situation in California in 1997. The most important finding was that the extreme and short-interval simulated precipitation of the WRF-ARW model, which is very important for hydrological forecast input, can be improved by the choice of microphysics schemes. Nasrollahi et al. [17] showed that different features from hurricane (track, intensity, and precipitation) in the WRF-ARW model can be improved with suitable selections of microphysics and cumulus schemes. These results showed that the best simulated precipitation can be achieved by using BMJ cumulus parameterization combined with the WSM5 microphysics scheme, but the hurricane’s track was best estimated by using the Lin or Kessler microphysics option with BMJ cumulus parameterization. Other validations of parameterization of physical processes on the tropical cyclone of Pattanayak et al. [18] with WRF for the NMM dynamical core showed the important role of cumulus parameterization in track forecasts, thereby contributing to rainfall induced by landfall of tropical cyclones.
In the other aspects related to using cumulus parameterization schemes at high-resolution simulations, Gilliland et al. [19] compared simulations using different cumulus parameterization schemes in summer-time convective activities. Compared with the model simulations at below 5 km horizontal resolution, which resolve the convection, the study showed that depending on the strength of the synoptic-scale forcing, the use of a cumulus parameterization scheme can still be warrant for representing the effects of subgrid-scale convective processes (the Kain–Fritsch scheme in this study).
Thus, the application of regional models to certain regions such as Vietnam will be influenced significantly by local factors (topography and microclimate mode) as well as the effects of physical combinations. Among regional models which are applied in Vietnam, the WRF-ARW model is the most useful tool because of the capabilities of providing different configuration physical/dynamical models for implementation to various scientific communities for both research and operation. For this reason, this study will focus on the impact of some physical parameterization configurations of the WRF-ARW model combining cumulus, cloud microphysics, and shortwave radiation parameterization schemes on heavy rainfall forecast. Two typical cumulus parameterizations (adjustment and mass-flux approaches) will be investigated with the combination of simple to complex cloud microphysics schemes. The verification of dependence of the typical synoptic situations/weather patterns causing heavy rainfall for the Bac Bo area on parameterization schemes is also carried out. For the real-time adaptation forecasting verification purposes, the lateral boundary condition will be used from the Global Forecast System (GFS) of NCEP.
The remainder of this paper is organized as follows: In Section 2, experimental design and validation methods will be presented. Section 3 discusses the impacts of different physical parameterization configurations on heavy rainfall over the Bac Bo area, and conclusions are given in Section 4.
2. Experiments
2.1. Model Description
This study used the recently released version of the Weather Research and Forecasting model with the ARW dynamical core (WRF-ARW model; version 3.9.1.1) with multinested grids and two-way interactive options. The WRF model has been integrated many advances in model physics/numerical aspects and data assimilation by scientists and developers from the expansive research community, therefore becoming a very flexible and useful tool for both researchers and operational forecasters (https://www.mmm.ucar.edu/weather-research-and-forecasting-model).
For the purpose of investigating the impact of physical parameterization schemes, similarly to the study of Kieu et. al. [20, 21], a set of combination of physical parameterizations has been generated based on (a) the modified KF and BMJ cumulus parameterization schemes; (b) the Goddard and Dudhia schemes for the shortwave radiation; (d) the YSU and MYJ planetary boundary schemes; and (e) the Lin, WSM3, WSM5, and WSM6 schemes for the cloud microphysics. There are a maximum of 32 different configuration forecasts for each heavy rainfall case listed in Table 2. The other options are the Monin–Obukhov surface layer scheme and the Rapid Radiative Transfer Model scheme for longwave radiation. Note that, with the MYJ scheme, the surface layer option will be switched to Janjic’s Eta–Monin–Obukhov scheme which is based on similar theory with viscous sublayers over both solid surfaces and water points. Skamarock et al. [22] provided the detailed description of the WRF-ARW model, and various references for physical parameterizations of the WRF-ARW model can be found from various listed references [11, 23–29, 30].
| Abbreviation | Microphysics | Shortwave radiation | Boundary layer |
|---|---|---|---|
| Betts–Miller–Janjic (BMJ) cumulus parameterization | |||
| BMJ-Lin-Duh-MYJ | Lin | Duhia | MYJ |
| BMJ-Lin-Duh-YSU | Lin | Duhia | YSU |
| BMJ-Lin-God-MYJ | Lin | Goddard | MYJ |
| BMJ-Lin-God-YSU | Lin | Goddard | YSU |
| BMJ-WSM3-Duh-MYJ | WSM3 | Duhia | MYJ |
| BMJ-WSM3-Duh-YSU | WSM3 | Duhia | YSU |
| BMJ-WSM3-God-MYJ | WSM3 | Goddard | MYJ |
| BMJ-WSM3-God-YSU | WSM3 | Goddard | YSU |
| BMJ-WSM5-Duh-MYJ | WSM5 | Duhia | MYJ |
| BMJ-WSM5-Duh-YSU | WSM5 | Duhia | YSU |
| BMJ-WSM5-God-MYJ | WSM5 | Duhia | MYJ |
| BMJ-WSM5-God-YSU | WSM5 | Goddard | YSU |
| BMJ-WSM6-Duh-MYJ | WSM6 | Duhia | MYJ |
| BMJ-WSM6-Duh-YSU | WSM6 | Duhia | YSU |
| BMJ-WSM6-God-MYJ | WSM6 | Goddard | MYJ |
| BMJ-WSM6-God-YSU | WSM6 | Goddard | YSU |
| Kain–Fritsch (KF) cumulus parameterization | |||
| KF-Lin-Duh-MYJ | Lin | Duhia | MYJ |
| KF-Lin-Duh-YSU | Lin | Duhia | YSU |
| KF-Lin-God-MYJ | Lin | Goddard | MYJ |
| KF-Lin-God-YSU | Lin | Goddard | YSU |
| KF-WSM3-Duh-MYJ | WSM3 | Duhia | MYJ |
| KF-WSM3-Duh-YSU | WSM3 | Duhia | YSU |
| KF-WSM3-God-MYJ | WSM3 | Goddard | MYJ |
| KF-WSM3-God-YSU | WSM3 | Goddard | YSU |
| KF-WSM5-Duh-MYJ | WSM5 | Duhia | MYJ |
| KF-WSM5-Duh-YSU | WSM5 | Duhia | YSU |
| KF-WSM5-God-MYJ | WSM5 | Goddard | MYJ |
| KF-WSM5-God-YSU | WSM5 | Goddard | YSU |
| KF-WSM6-Duh-MYJ | WSM6 | Duhia | MYJ |
| KF-WSM6-Duh-YSU | WSM6 | Duhia | YSU |
| KF-WSM6-God-MYJ | WSM6 | Goddard | MYJ |
| KF-WSM6-God-YSU | WSM6 | Goddard | YSU |
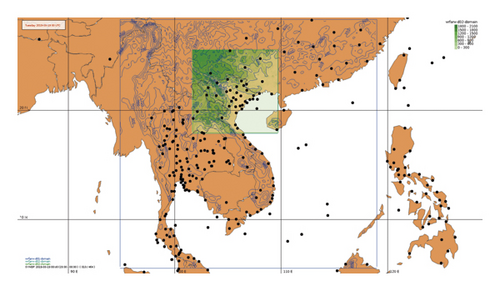
The WRF-ARW model is configured with two nested grid domains consisting of 199 × 199 grid points in the (x, y) dimensions with horizontal resolutions of 15 km (denoted as d01 domain) and 5 km (denoted as d02 domain). All domains share 41 similar vertical σ levels with the model top at 50 hPa. The higher resolution domain covers the northern part of Vietnam with a time step of 15 seconds. All validations will be carried out with forecasts from the d02 domain. Figure 2 shows the terrain used in d01 and d02 domains.
2.2. Boundary Conditions
The GFS model of NCEP used to provide boundary conditions for the WRF-ARW model in this study has a 0.5-degree horizontal resolution and be prepared every three hours from 1000 hPa to 1 hPa. The GFS data for this study were downloaded from the Research Data Archive at the National Center for Atmospheric Research via website link https://rda.ucar.edu/datasets/ds335.0. More information on GFS data can be found at https://www.nco.ncep.noaa.gov/pmb/products/gfs/.
2.3. Observation Data
The number of observation stations in Vietnam increased from 89 in 1988 to 186 in 2017, with 4 or 8 observations per day (black dots are 8 observations/day for stations in Vietnam and nearby countries in Figure 2), but only 24 stations are reported to WMO. The difference in location and topography results in the significant change from one climate to another; therefore, Vietnam has been divided into several climate zones. The highest station density is in the Red River Delta area (the southern part of northern Vietnam) with approximately 1 station per 25 km × 25 km area. The coarsest station density is in the Central Highlands area (latitude between ∼11 N and 16 N) with approximately 1 station per 55 km × 55 km area. On average, the current surface observation network density of Vietnam is about 1 station per 35 km × 35 km for flat regions and 1 station per 50 km × 50 km for mountainous complex regions. In this paper, in order to verify model forecast for the Bac Bo area, we used observation data from the northern SYNOP stations for the period from 2012 to 2016 listed in Table 1.
In this study, 72 cases of typical widespread heavy rains which occurred in the northern part of Vietnam in the period 2012–2016 were selected. For each case, the forecasting cycles are chosen so that the 72-hour forecast range can cover the maximum duration of heavy rain episodes.
With respect to causes of heavy rainfall events, there are four main categories: (i) activities of ITCZs or troughs: type I, (ii) affected by tropical cyclones or surface low-pressure system (staying at least more than 2 days over the Bac Bo area): type II, (iii) related to the cold surge from the north: type III, and (iv) the complex combinations from different patterns: type IV. The list of forecasted events is given in Table 3 with the station name, the maximum value of daily rainfall, and the type of each heavy rainfall case. The sample number of type I, type II, type III, and type IV has 37, 21, 5, and 9 forecast cycles, respectively.
| Forecast cycle (year month day hour) | Maximum 24 h accumulation observation (mm) | Station with maximum observation | Types of rain events |
|---|---|---|---|
| 2012 05 18 00 | 37 | Bac Yen | Type I |
| 2012 05 19 00 | 44 | Lac Son | Type I |
| 2012 05 20 00 | 114 | Bac Quang | Type I |
| 2012 05 21 00 | 195 | Bac Quang | Type I |
| 2012 05 22 00 | 131 | Ha Dong | Type I |
| 2012 05 23 00 | 186 | Quang Ha | Type I |
| 2012 07 20 00 | 41 | Bac Quang | Type I |
| 2012 07 21 00 | 24.6 | Lai Chau | Type II |
| 2012 07 22 00 | 116 | Vinh Yen | Type II |
| 2012 07 23 00 | 75 | Vinh | Type II |
| 2012 07 25 00 | 229 | Tuyen Quang | Type II |
| 2012 07 26 00 | 104 | Ham Yen | Type II |
| 2012 07 27 00 | 112 | Bac Quang | Type I |
| 2012 08 03 00 | 58.1 | Con Cuong | Type I |
| 2012 08 04 00 | 34.1 | Tinh Gia | Type I |
| 2012 08 05 00 | 70 | Lang Son | Type I |
| 2012 08 06 00 | 153 | Muong La | Type I |
| 2012 08 07 00 | 163 | Quang Ha | Type I |
| 2012 08 13 00 | 63.6 | Muong La | Type II |
| 2012 08 14 00 | 64.5 | Nho Quan | Type II |
| 2012 08 15 00 | 74 | Do Luong | Type II |
| 2012 08 16 00 | 76 | Tam Dao | Type II |
| 2012 08 31 00 | 49.1 | Sin Ho | Type IV |
| 2012 09 01 00 | 67 | Nhu Xuan | Type IV |
| 2012 09 02 00 | 124 | Quynh Luu | Type IV |
| 2012 09 03 00 | 84 | Moc Chau | Type IV |
| 2012 09 04 00 | 157 | Huong Khe | Type IV |
| 2012 09 16 00 | 151.4 | Muong Te | Type IV |
| 2012 09 17 00 | 104.6 | Tam Duong | Type III |
| 2013 06 19 00 | 109 | Bac Quang | Type II |
| 2013 06 20 00 | 72.2 | Huong Khe | Type II |
| 2013 06 21 00 | 59 | Nam Dinh | Type II |
| 2013 06 22 00 | 218 | Ha Tinh | Type II |
| 2014 08 25 00 | 91 | Lao Cai | Type II |
| 2014 08 26 00 | 89 | Van Ly | Type II |
| 2014 08 27 00 | 157 | Hon Ngu | Type II |
| 2015 05 18 00 | 90 | Hoi Xuan | Type III |
| 2015 05 19 00 | 58 | Sin Ho | Type III |
| 2015 05 20 00 | 106 | That Khe | Type III |
| 2015 05 21 00 | 72 | Tuyen Quang | Type III |
| 2015 06 21 00 | 124 | Luc Yen | Type II |
| 2015 06 22 00 | 72.7 | Do Luong | Type II |
| 2015 07 01 00 | 84.5 | Cao Bang | Type I |
| 2015 07 02 00 | 123.0 | Van Chan | Type I |
| 2015 07 03 00 | 74.0 | Huong Khe | Type I |
| 2015 07 21 00 | 54.5 | Hoa Binh | Type I |
| 2015 07 22 00 | 19 | Sin Ho | Type I |
| 2015 07 23 00 | 92 | Sin Ho | Type I |
| 2015 07 24 00 | 180 | Quynh Nhai | Type I |
| 2015 07 25 00 | 181 | Cua Ong | Type I |
| 2015 07 26 00 | 432 | Cua Ong | Type I |
| 2015 07 27 00 | 347 | Quang Ha | Type I |
| 2015 07 28 00 | 224 | Mong Cai | Type I |
| 2015 07 29 00 | 247 | Cua Ong | Type I |
| 2015 07 30 00 | 145 | Quang Ha | Type I |
| 2015 07 31 00 | 239 | Quang Ha | Type I |
| 2015 08 01 00 | 157 | Phu Lien | Type I |
| 2015 09 18 00 | 73 | Hai Duong | Type IV |
| 2015 09 19 00 | 78.0 | Dinh Hoa | Type IV |
| 2016 05 20 00 | 118 | Tinh Gia | Type I |
| 2016 05 21 00 | 107.0 | Ha Nam | Type I |
| 2016 05 22 00 | 92 | Sa Pa | Type I |
| 2016 05 23 00 | 190.4 | Yen Bai | Type I |
| 2016 07 24 00 | 60 | Phu Lien | Type II |
| 2016 07 25 00 | 17 | Thai Binh | Type II |
| 2016 07 26 00 | 46 | Dinh Hoa | Type II |
| 2016 07 30 00 | 18.1 | Mu Cang Chai | Type II |
| 2016 08 01 00 | 19 | Sin Ho | Type I |
| 2016 08 02 00 | 150 | Ninh Binh | Type I |
| 2016 08 10 00 | 81 | Quynh Nhai | Type I |
| 2016 08 11 00 | 117 | Thanh Hoa | Type I |
| 2016 08 12 00 | 87 | Tay Hieu | Type I |
- Type I: activities of trough or ITCZ; type II: affected by tropical cyclone or low-pressure system; type III: related to cold surge from the north; type IV: combinations of different patterns.
2.4. Validation Methods
Other meanings of these scores can be found in Wilks’ study [31]. The verification will be carried out for the 5 km domain and for 24 h accumulated rainfall at 24 h, 48 h, and 72 h forecast ranges. Other analysis charts include the histogram of precipitation occurrences at given thresholds (>25 mm/24 h, >50 mm/24 h, and >100 mm/24 h) at the observation stations.
3. Results
3.1. General Performance
The histogram charts (Figure 3) show the number of observations or forecasts that occurred at stations for given ranges—or bins. We divided rainfall into 4 main bins (0–25 mm, 25–50 mm, 50–100 mm, and >100 mm) for different rainfall classes. For all 24 h, 48 h, and 72 h forecasts, it is quite clear that most forecasts from the BMJ scheme are in the 0–25 mm range, higher than the number of observations, while the KF scheme tends to have less forecasts than observations. In contrast, at the thresholds greater than 25 mm, for the BMJ scheme, the number of forecasts is less than the number of observations, while the KF scheme tends to have more forecasts than the number of observations.
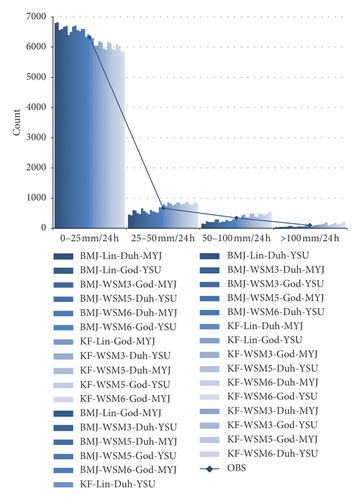
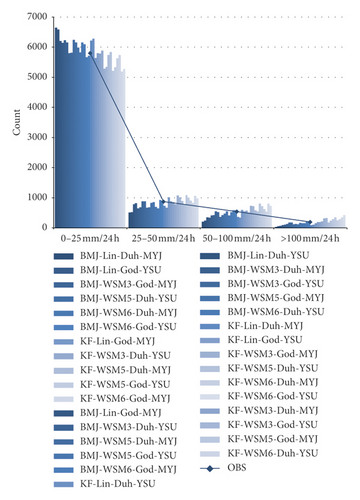
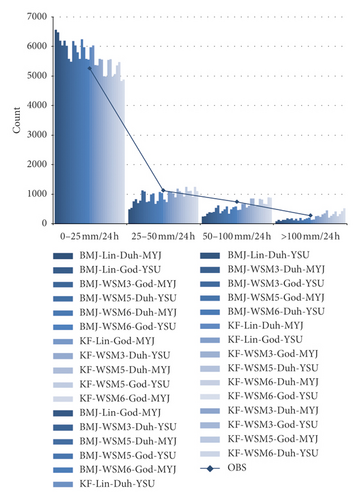
Figure 4 shows the BIAS score at different thresholds (>25 mm/24 h and >50 mm/24 h) and separated for KF and BMJ scheme combinations. Overall assessment through the BIAS score is quite similar to the results from the evaluation through histograms: simulations with the BMJ scheme tend to be lower than observations at most forecast ranges and different thresholds (BIAS < 1), while the simulations with the KF scheme tend to be higher than the observations (BIAS > 1). The BIAS tends to decrease significantly when the forecast ranges increase. When the validation thresholds are increased, the simulation with the BMJ scheme tends to decrease BIAS, whereas in combination with the KF scheme, BIAS increases with both the forecast ranges and the evaluation thresholds.
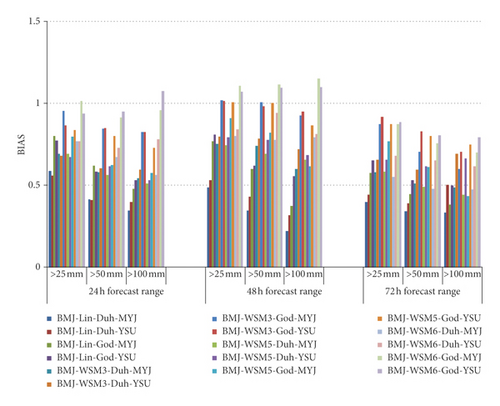
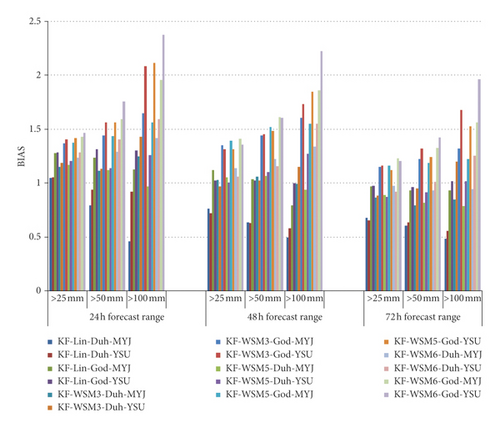
The individual assessment in each combination of BMJ and KF schemes shows that when combined with the Goddard radiation scheme, the BIAS increases from 0.1 to 0.2 compared to the Dudhia scheme. These results are similar for all validating thresholds and for 24 h, 48 h, and 72 h forecast ranges. The difference in simulations with different boundary layer schemes is unclear while evaluating with thresholds below 25 mm/24 h; however, at higher thresholds, it is apparent: the change of BIAS when combining with the KF scheme is much higher. For example, compared to the BMJ scheme, the BIAS score of KF-WSM3-God-MYJ at the >100 mm/24 h threshold at the 24-hour forecast range is 1.6458 and that of KF-WSM3-God-YSU is 2.0833, while BMJ-WSM3-God-MYJ and BMJ-WSM3-God-YSU had approximately equal BIAS scores (0.8229). Thus, the combinations of the boundary layer schemes are different (here only the two schemes YSU and MYJ) with the KF scheme being much more sensitive to its combinations with the BMJ scheme and especially at the high rainfall thresholds. Details of numerical values of BIAS can be found in Tables 4, 5, and 6.
| >25 mm/24 h | >50 mm/24 h | |||||||||||||||||
|---|---|---|---|---|---|---|---|---|---|---|---|---|---|---|---|---|---|---|
| TS | ETS | BIAS | POD | FAR | H | F | M | T | TS | ETS | BIAS | POD | FAR | H | F | M | T | |
| BMJ-Lin-Duh-MYJ | 0.207 | 0.1517 | 0.5854 | 0.2719 | 0.5355 | 301 | 347 | 806 | 6106 | 0.1049 | 0.0874 | 0.4139 | 0.1342 | 0.6757 | 60 | 125 | 387 | 6988 |
| BMJ-Lin-Duh-YSU | 0.2087 | 0.1551 | 0.5592 | 0.2692 | 0.5186 | 298 | 321 | 809 | 6132 | 0.1072 | 0.0899 | 0.4094 | 0.1365 | 0.6667 | 61 | 122 | 386 | 6991 |
| BMJ-Lin-God-MYJ | 0.2283 | 0.1613 | 0.7986 | 0.3342 | 0.5814 | 370 | 514 | 737 | 5939 | 0.1225 | 0.0996 | 0.6197 | 0.1767 | 0.7148 | 79 | 198 | 368 | 6915 |
| BMJ-Lin-God-YSU | 0.2304 | 0.1649 | 0.7706 | 0.3315 | 0.5698 | 367 | 486 | 740 | 5967 | 0.122 | 0.1 | 0.5839 | 0.1723 | 0.705 | 77 | 184 | 370 | 6929 |
| BMJ-WSM3-Duh-MYJ | 0.2051 | 0.1433 | 0.6929 | 0.2882 | 0.5841 | 319 | 448 | 788 | 6005 | 0.1066 | 0.0846 | 0.5794 | 0.1521 | 0.7375 | 68 | 191 | 379 | 6922 |
| BMJ-WSM3-Duh-YSU | 0.2201 | 0.1595 | 0.6775 | 0.3026 | 0.5533 | 335 | 415 | 772 | 6038 | 0.1153 | 0.0928 | 0.6018 | 0.1655 | 0.7249 | 74 | 195 | 373 | 6918 |
| BMJ-WSM3-God-MYJ | 0.2388 | 0.1649 | 0.9539 | 0.3767 | 0.6051 | 417 | 639 | 690 | 5814 | 0.1364 | 0.1089 | 0.8456 | 0.2215 | 0.7381 | 99 | 279 | 348 | 6834 |
| BMJ-WSM3-God-YSU | 0.2408 | 0.1709 | 0.8663 | 0.3622 | 0.5819 | 401 | 558 | 706 | 5895 | 0.1391 | 0.1116 | 0.8501 | 0.226 | 0.7342 | 101 | 279 | 346 | 6834 |
| BMJ-WSM5-Duh-MYJ | 0.2147 | 0.153 | 0.692 | 0.299 | 0.5679 | 331 | 435 | 776 | 6018 | 0.1166 | 0.0951 | 0.5638 | 0.1633 | 0.7103 | 73 | 179 | 374 | 6934 |
| BMJ-WSM5-Duh-YSU | 0.2156 | 0.1553 | 0.6703 | 0.2963 | 0.558 | 328 | 414 | 779 | 6039 | 0.1319 | 0.1092 | 0.613 | 0.1879 | 0.6934 | 84 | 190 | 363 | 6923 |
| BMJ-WSM5-God-MYJ | 0.2408 | 0.1743 | 0.7967 | 0.3487 | 0.5624 | 386 | 496 | 721 | 5957 | 0.1273 | 0.1044 | 0.6242 | 0.1834 | 0.7061 | 82 | 197 | 365 | 6916 |
| BMJ-WSM5-God-YSU | 0.2449 | 0.1766 | 0.8365 | 0.3613 | 0.568 | 400 | 526 | 707 | 5927 | 0.1386 | 0.112 | 0.8009 | 0.2192 | 0.7263 | 98 | 260 | 349 | 6853 |
| BMJ-WSM6-Duh-MYJ | 0.2079 | 0.1419 | 0.7687 | 0.3044 | 0.604 | 337 | 514 | 770 | 5939 | 0.1166 | 0.0925 | 0.6711 | 0.1745 | 0.74 | 78 | 222 | 369 | 6891 |
| BMJ-WSM6-Duh-YSU | 0.2126 | 0.1469 | 0.7669 | 0.3098 | 0.596 | 343 | 506 | 764 | 5947 | 0.1386 | 0.1135 | 0.7271 | 0.2103 | 0.7108 | 94 | 231 | 353 | 6882 |
| BMJ-WSM6-God-MYJ | 0.2552 | 0.1793 | 1.0126 | 0.4092 | 0.5959 | 453 | 668 | 654 | 5785 | 0.1554 | 0.1269 | 0.9128 | 0.2573 | 0.7181 | 115 | 293 | 332 | 6820 |
| BMJ-WSM6-God-YSU | 0.2477 | 0.1747 | 0.9386 | 0.3848 | 0.59 | 426 | 613 | 681 | 5840 | 0.1644 | 0.1355 | 0.9485 | 0.2752 | 0.7099 | 123 | 301 | 324 | 6812 |
| KF-Lin-Duh-MYJ | 0.2399 | 0.162 | 1.0497 | 0.3966 | 0.6222 | 439 | 723 | 668 | 5730 | 0.1525 | 0.1262 | 0.7919 | 0.2371 | 0.7006 | 106 | 248 | 341 | 6865 |
| KF-Lin-Duh-YSU | 0.2656 | 0.1884 | 1.0533 | 0.4309 | 0.5909 | 477 | 689 | 630 | 5764 | 0.1457 | 0.1168 | 0.9351 | 0.2461 | 0.7368 | 110 | 308 | 337 | 6805 |
| KF-Lin-God-MYJ | 0.2507 | 0.165 | 1.2755 | 0.4562 | 0.6424 | 505 | 907 | 602 | 5546 | 0.1564 | 0.1233 | 1.2327 | 0.302 | 0.755 | 135 | 416 | 312 | 6697 |
| KF-Lin-God-YSU | 0.2649 | 0.1795 | 1.2818 | 0.4779 | 0.6272 | 529 | 890 | 578 | 5563 | 0.162 | 0.128 | 1.311 | 0.3221 | 0.7543 | 144 | 442 | 303 | 6671 |
| KF-WSM3-Duh-MYJ | 0.2442 | 0.1627 | 1.1491 | 0.4219 | 0.6329 | 467 | 805 | 640 | 5648 | 0.1581 | 0.1266 | 1.1141 | 0.2886 | 0.741 | 129 | 369 | 318 | 6744 |
| KF-WSM3-Duh-YSU | 0.2664 | 0.1843 | 1.1861 | 0.4598 | 0.6123 | 509 | 804 | 598 | 5649 | 0.1667 | 0.135 | 1.1298 | 0.3043 | 0.7307 | 136 | 369 | 311 | 6744 |
| KF-WSM3-God-MYJ | 0.2743 | 0.1867 | 1.3668 | 0.5095 | 0.6272 | 564 | 949 | 543 | 5504 | 0.172 | 0.1368 | 1.4385 | 0.3579 | 0.7512 | 160 | 483 | 287 | 6630 |
| KF-WSM3-God-YSU | 0.2739 | 0.1852 | 1.4029 | 0.5167 | 0.6317 | 572 | 981 | 535 | 5472 | 0.1778 | 0.1413 | 1.5638 | 0.387 | 0.7525 | 173 | 526 | 274 | 6587 |
| KF-WSM5-Duh-MYJ | 0.2583 | 0.1766 | 1.1653 | 0.4444 | 0.6186 | 492 | 798 | 615 | 5655 | 0.1648 | 0.1333 | 1.1186 | 0.2998 | 0.732 | 134 | 366 | 313 | 6747 |
| KF-WSM5-Duh-YSU | 0.2656 | 0.1828 | 1.2042 | 0.4625 | 0.6159 | 512 | 821 | 595 | 5632 | 0.1588 | 0.1269 | 1.1387 | 0.2931 | 0.7426 | 131 | 378 | 316 | 6735 |
| KF-WSM5-God-MYJ | 0.2693 | 0.1812 | 1.3758 | 0.5041 | 0.6336 | 558 | 965 | 549 | 5488 | 0.1773 | 0.1421 | 1.4362 | 0.3669 | 0.7445 | 164 | 478 | 283 | 6635 |
| KF-WSM5-God-YSU | 0.2826 | 0.1939 | 1.4146 | 0.5321 | 0.6239 | 589 | 977 | 518 | 5476 | 0.178 | 0.1415 | 1.5615 | 0.387 | 0.7521 | 173 | 525 | 274 | 6588 |
| KF-WSM6-Duh-MYJ | 0.2598 | 0.1758 | 1.234 | 0.4607 | 0.6266 | 510 | 856 | 597 | 5597 | 0.1663 | 0.1326 | 1.2908 | 0.3266 | 0.747 | 146 | 431 | 301 | 6682 |
| KF-WSM6-Duh-YSU | 0.28 | 0.1952 | 1.2836 | 0.4995 | 0.6108 | 553 | 868 | 554 | 5585 | 0.1958 | 0.1611 | 1.4049 | 0.3937 | 0.7197 | 176 | 452 | 271 | 6661 |
| KF-WSM6-God-MYJ | 0.26 | 0.1698 | 1.43 | 0.5014 | 0.6494 | 555 | 1028 | 552 | 5425 | 0.1926 | 0.156 | 1.5906 | 0.4183 | 0.737 | 187 | 524 | 260 | 6589 |
| KF-WSM6-God-YSU | 0.2792 | 0.1888 | 1.467 | 0.5384 | 0.633 | 596 | 1028 | 511 | 5425 | 0.1844 | 0.1463 | 1.7584 | 0.4295 | 0.7557 | 192 | 594 | 255 | 6519 |
| >25 mm/24 h | >50 mm/24 h | |||||||||||||||||
|---|---|---|---|---|---|---|---|---|---|---|---|---|---|---|---|---|---|---|
| TS | ETS | BIAS | POD | FAR | H | F | M | T | TS | ETS | BIAS | POD | FAR | H | F | M | T | |
| BMJ-Lin-Duh-MYJ | 0.1791 | 0.1054 | 0.4842 | 0.2254 | 0.5344 | 365 | 419 | 1254 | 5522 | 0.0962 | 0.0703 | 0.3463 | 0.1181 | 0.6589 | 88 | 170 | 657 | 6645 |
| BMJ-Lin-Duh-YSU | 0.1853 | 0.1069 | 0.5287 | 0.239 | 0.5479 | 387 | 469 | 1232 | 5472 | 0.1105 | 0.0803 | 0.4295 | 0.1423 | 0.6687 | 106 | 214 | 639 | 6601 |
| BMJ-Lin-God-MYJ | 0.234 | 0.1345 | 0.769 | 0.3354 | 0.5639 | 543 | 702 | 1076 | 5239 | 0.1225 | 0.0846 | 0.5987 | 0.1745 | 0.7085 | 130 | 316 | 615 | 6499 |
| BMJ-Lin-God-YSU | 0.243 | 0.1408 | 0.8073 | 0.3533 | 0.5624 | 572 | 735 | 1047 | 5206 | 0.1357 | 0.0971 | 0.6174 | 0.1933 | 0.687 | 144 | 316 | 601 | 6499 |
| BMJ-WSM3-Duh-MYJ | 0.2332 | 0.1353 | 0.7505 | 0.3311 | 0.5588 | 536 | 679 | 1083 | 5262 | 0.152 | 0.109 | 0.7396 | 0.2295 | 0.6897 | 171 | 380 | 574 | 6435 |
| BMJ-WSM3-Duh-YSU | 0.2579 | 0.1573 | 0.7956 | 0.3681 | 0.5373 | 596 | 692 | 1023 | 5249 | 0.1587 | 0.1142 | 0.7839 | 0.2443 | 0.6884 | 182 | 402 | 563 | 6413 |
| BMJ-WSM3-God-MYJ | 0.2616 | 0.1452 | 1.0167 | 0.4182 | 0.5887 | 677 | 969 | 942 | 4972 | 0.1546 | 0.1034 | 1.0054 | 0.2685 | 0.733 | 200 | 549 | 545 | 6266 |
| BMJ-WSM3-God-YSU | 0.2641 | 0.148 | 1.0136 | 0.4206 | 0.585 | 681 | 960 | 938 | 4981 | 0.1539 | 0.1034 | 0.9826 | 0.2644 | 0.7309 | 197 | 535 | 548 | 6280 |
| BMJ-WSM5-Duh-MYJ | 0.2425 | 0.1455 | 0.7437 | 0.3403 | 0.5424 | 551 | 653 | 1068 | 5288 | 0.1582 | 0.1171 | 0.6899 | 0.2309 | 0.6654 | 172 | 342 | 573 | 6473 |
| BMJ-WSM5-Duh-YSU | 0.2545 | 0.154 | 0.7931 | 0.3638 | 0.5413 | 589 | 695 | 1030 | 5246 | 0.1698 | 0.1257 | 0.7758 | 0.2577 | 0.6678 | 192 | 386 | 553 | 6429 |
| BMJ-WSM5-God-MYJ | 0.2687 | 0.1601 | 0.9074 | 0.404 | 0.5548 | 654 | 815 | 965 | 5126 | 0.174 | 0.1286 | 0.8201 | 0.2698 | 0.671 | 201 | 410 | 544 | 6405 |
| BMJ-WSM5-God-YSU | 0.2677 | 0.1522 | 1.0068 | 0.4237 | 0.5791 | 686 | 944 | 933 | 4997 | 0.1674 | 0.1166 | 1.0027 | 0.2872 | 0.7135 | 214 | 533 | 531 | 6282 |
| BMJ-WSM6-Duh-MYJ | 0.2282 | 0.1261 | 0.7986 | 0.3342 | 0.5816 | 541 | 752 | 1078 | 5189 | 0.1414 | 0.097 | 0.7772 | 0.2201 | 0.7168 | 164 | 415 | 581 | 6400 |
| BMJ-WSM6-Duh-YSU | 0.2471 | 0.1426 | 0.8394 | 0.3644 | 0.5659 | 590 | 769 | 1029 | 5172 | 0.169 | 0.1198 | 0.9409 | 0.2805 | 0.7019 | 209 | 492 | 536 | 6323 |
| BMJ-WSM6-God-MYJ | 0.2484 | 0.1255 | 1.1081 | 0.4194 | 0.6215 | 679 | 1115 | 940 | 4826 | 0.1471 | 0.0931 | 1.1141 | 0.2711 | 0.7566 | 202 | 628 | 543 | 6187 |
| BMJ-WSM6-God-YSU | 0.283 | 0.1642 | 1.0723 | 0.4571 | 0.5737 | 740 | 996 | 879 | 4945 | 0.1588 | 0.1053 | 1.0966 | 0.2872 | 0.7381 | 214 | 603 | 531 | 6212 |
| KF-Lin-Duh-MYJ | 0.2144 | 0.1147 | 0.7634 | 0.3113 | 0.5922 | 504 | 732 | 1115 | 5209 | 0.1299 | 0.0905 | 0.6349 | 0.1879 | 0.704 | 140 | 333 | 605 | 6482 |
| KF-Lin-Duh-YSU | 0.2312 | 0.136 | 0.7171 | 0.3224 | 0.5504 | 522 | 639 | 1097 | 5302 | 0.124 | 0.0847 | 0.6309 | 0.1799 | 0.7149 | 134 | 336 | 611 | 6479 |
| KF-Lin-God-MYJ | 0.2584 | 0.1355 | 1.1174 | 0.4348 | 0.6108 | 704 | 1105 | 915 | 4836 | 0.1304 | 0.0781 | 1.0362 | 0.2349 | 0.7733 | 175 | 597 | 570 | 6218 |
| KF-Lin-God-YSU | 0.2806 | 0.1647 | 1.0241 | 0.4435 | 0.5669 | 718 | 940 | 901 | 5001 | 0.1611 | 0.1097 | 1.0215 | 0.2805 | 0.7254 | 209 | 552 | 536 | 6263 |
| KF-WSM3-Duh-MYJ | 0.266 | 0.149 | 1.0284 | 0.4262 | 0.5856 | 690 | 975 | 929 | 4966 | 0.1735 | 0.1212 | 1.0604 | 0.3047 | 0.7127 | 227 | 563 | 518 | 6252 |
| KF-WSM3-Duh-YSU | 0.2839 | 0.1719 | 0.9691 | 0.4355 | 0.5507 | 705 | 864 | 914 | 5077 | 0.1948 | 0.1437 | 1.0255 | 0.3302 | 0.678 | 246 | 518 | 499 | 6297 |
| KF-WSM3-God-MYJ | 0.2845 | 0.1503 | 1.3484 | 0.5201 | 0.6143 | 842 | 1341 | 777 | 4600 | 0.1766 | 0.1161 | 1.4416 | 0.3664 | 0.7458 | 273 | 801 | 472 | 6014 |
| KF-WSM3-God-YSU | 0.3018 | 0.1706 | 1.3125 | 0.5361 | 0.5915 | 868 | 1257 | 751 | 4684 | 0.1877 | 0.1271 | 1.455 | 0.3879 | 0.7334 | 289 | 795 | 456 | 6020 |
| KF-WSM5-Duh-MYJ | 0.2801 | 0.1622 | 1.055 | 0.4497 | 0.5738 | 728 | 980 | 891 | 4961 | 0.1785 | 0.1262 | 1.0644 | 0.3128 | 0.7062 | 233 | 560 | 512 | 6255 |
| KF-WSM5-Duh-YSU | 0.2948 | 0.1812 | 1.0019 | 0.4558 | 0.545 | 738 | 884 | 881 | 5057 | 0.2037 | 0.1509 | 1.102 | 0.3557 | 0.6772 | 265 | 556 | 480 | 6259 |
| KF-WSM5-God-MYJ | 0.284 | 0.1477 | 1.3904 | 0.5287 | 0.6197 | 856 | 1395 | 763 | 4546 | 0.1685 | 0.1064 | 1.5221 | 0.3638 | 0.761 | 271 | 863 | 474 | 5952 |
| KF-WSM5-God-YSU | 0.2998 | 0.1683 | 1.3162 | 0.5343 | 0.5941 | 865 | 1266 | 754 | 4675 | 0.1996 | 0.1388 | 1.4846 | 0.4134 | 0.7215 | 308 | 798 | 437 | 6017 |
| KF-WSM6-Duh-MYJ | 0.2799 | 0.1571 | 1.1353 | 0.467 | 0.5887 | 756 | 1082 | 863 | 4859 | 0.1973 | 0.1415 | 1.2242 | 0.3664 | 0.7007 | 273 | 639 | 472 | 6176 |
| KF-WSM6-Duh-YSU | 0.3002 | 0.1833 | 1.0574 | 0.475 | 0.5508 | 769 | 943 | 850 | 4998 | 0.211 | 0.157 | 1.157 | 0.3758 | 0.6752 | 280 | 582 | 465 | 6233 |
| KF-WSM6-God-MYJ | 0.2917 | 0.155 | 1.4095 | 0.5442 | 0.6139 | 881 | 1401 | 738 | 4540 | 0.1788 | 0.1154 | 1.6107 | 0.396 | 0.7542 | 295 | 905 | 450 | 5910 |
| KF-WSM6-God-YSU | 0.3113 | 0.1785 | 1.357 | 0.5596 | 0.5876 | 906 | 1291 | 713 | 4650 | 0.2101 | 0.1475 | 1.6054 | 0.4523 | 0.7182 | 337 | 859 | 408 | 5956 |
| >25 mm/24 h | >50 mm/24 h | |||||||||||||||||
|---|---|---|---|---|---|---|---|---|---|---|---|---|---|---|---|---|---|---|
| TS | ETS | BIAS | POD | FAR | H | F | M | T | TS | ETS | BIAS | POD | FAR | H | F | M | T | |
| BMJ-Lin-Duh-MYJ | 0.154 | 0.0672 | 0.3964 | 0.1863 | 0.53 | 400 | 451 | 1747 | 4962 | 0.0797 | 0.0443 | 0.3412 | 0.099 | 0.7098 | 101 | 247 | 919 | 6293 |
| BMJ-Lin-Duh-YSU | 0.1539 | 0.0595 | 0.442 | 0.1924 | 0.5648 | 413 | 536 | 1734 | 4877 | 0.0766 | 0.0373 | 0.3912 | 0.099 | 0.7469 | 101 | 298 | 919 | 6242 |
| BMJ-Lin-God-MYJ | 0.1755 | 0.0611 | 0.5752 | 0.2352 | 0.5911 | 505 | 730 | 1642 | 4683 | 0.0719 | 0.0285 | 0.4471 | 0.0971 | 0.7829 | 99 | 357 | 921 | 6183 |
| BMJ-Lin-God-YSU | 0.1893 | 0.0645 | 0.653 | 0.2632 | 0.597 | 565 | 837 | 1582 | 4576 | 0.0832 | 0.0342 | 0.5314 | 0.1176 | 0.7786 | 120 | 422 | 900 | 6118 |
| BMJ-WSM3-Duh-MYJ | 0.1802 | 0.0656 | 0.5771 | 0.2408 | 0.5827 | 517 | 722 | 1630 | 4691 | 0.0867 | 0.0391 | 0.5108 | 0.1206 | 0.7639 | 123 | 398 | 897 | 6142 |
| BMJ-WSM3-Duh-YSU | 0.1988 | 0.0737 | 0.6572 | 0.2748 | 0.5819 | 590 | 821 | 1557 | 4592 | 0.0935 | 0.0407 | 0.5941 | 0.1363 | 0.7706 | 139 | 467 | 881 | 6073 |
| BMJ-WSM3-God-MYJ | 0.2273 | 0.0777 | 0.871 | 0.3465 | 0.6021 | 744 | 1126 | 1403 | 4287 | 0.0992 | 0.0404 | 0.7049 | 0.1539 | 0.7816 | 157 | 562 | 863 | 5978 |
| BMJ-WSM3-God-YSU | 0.2239 | 0.0691 | 0.9171 | 0.3507 | 0.6176 | 753 | 1216 | 1394 | 4197 | 0.1022 | 0.0373 | 0.8294 | 0.1696 | 0.7955 | 173 | 673 | 847 | 5867 |
| BMJ-WSM5-Duh-MYJ | 0.1788 | 0.0634 | 0.5817 | 0.2399 | 0.5877 | 515 | 734 | 1632 | 4679 | 0.0944 | 0.0482 | 0.4892 | 0.1284 | 0.7375 | 131 | 368 | 889 | 6172 |
| BMJ-WSM5-Duh-YSU | 0.2041 | 0.0796 | 0.6544 | 0.2804 | 0.5715 | 602 | 803 | 1545 | 4610 | 0.0966 | 0.0427 | 0.6137 | 0.1422 | 0.7684 | 145 | 481 | 875 | 6059 |
| BMJ-WSM5-God-MYJ | 0.2169 | 0.0787 | 0.7667 | 0.3149 | 0.5893 | 676 | 970 | 1471 | 4443 | 0.0908 | 0.037 | 0.6127 | 0.1343 | 0.7808 | 137 | 488 | 883 | 6052 |
| BMJ-WSM5-God-YSU | 0.2278 | 0.0779 | 0.8728 | 0.3475 | 0.6019 | 746 | 1128 | 1401 | 4285 | 0.0947 | 0.031 | 0.802 | 0.1559 | 0.8056 | 159 | 659 | 861 | 5881 |
| BMJ-WSM6-Duh-MYJ | 0.1712 | 0.0601 | 0.5515 | 0.2268 | 0.5887 | 487 | 697 | 1660 | 4716 | 0.0834 | 0.0379 | 0.4775 | 0.1137 | 0.7618 | 116 | 371 | 904 | 6169 |
| BMJ-WSM6-Duh-YSU | 0.1971 | 0.069 | 0.68 | 0.2767 | 0.5932 | 594 | 866 | 1553 | 4547 | 0.0992 | 0.0432 | 0.652 | 0.149 | 0.7714 | 152 | 513 | 868 | 6027 |
| BMJ-WSM6-God-MYJ | 0.2191 | 0.069 | 0.8714 | 0.3363 | 0.6141 | 722 | 1149 | 1425 | 4264 | 0.1 | 0.0385 | 0.7578 | 0.1598 | 0.7891 | 163 | 610 | 857 | 5930 |
| BMJ-WSM6-God-YSU | 0.215 | 0.0632 | 0.885 | 0.3335 | 0.6232 | 716 | 1184 | 1431 | 4229 | 0.0824 | 0.0185 | 0.8039 | 0.1373 | 0.8293 | 140 | 680 | 880 | 5860 |
| KF-Lin-Duh-MYJ | 0.2144 | 0.0871 | 0.6782 | 0.2962 | 0.5632 | 636 | 820 | 1511 | 4593 | 0.1162 | 0.0632 | 0.601 | 0.1667 | 0.7227 | 170 | 443 | 850 | 6097 |
| KF-Lin-Duh-YSU | 0.2063 | 0.0825 | 0.6502 | 0.2823 | 0.5659 | 606 | 790 | 1541 | 4623 | 0.1069 | 0.052 | 0.6343 | 0.1578 | 0.7512 | 161 | 486 | 859 | 6054 |
| KF-Lin-God-MYJ | 0.2399 | 0.0805 | 0.9693 | 0.381 | 0.6069 | 818 | 1263 | 1329 | 4150 | 0.1392 | 0.0702 | 0.9333 | 0.2363 | 0.7468 | 241 | 711 | 779 | 5829 |
| KF-Lin-God-YSU | 0.2427 | 0.0831 | 0.9725 | 0.3852 | 0.6039 | 827 | 1261 | 1320 | 4152 | 0.1309 | 0.0605 | 0.9647 | 0.2275 | 0.7642 | 232 | 752 | 788 | 5788 |
| KF-WSM3-Duh-MYJ | 0.2377 | 0.0889 | 0.8677 | 0.3586 | 0.5867 | 770 | 1093 | 1377 | 4320 | 0.1242 | 0.0613 | 0.7922 | 0.198 | 0.75 | 202 | 606 | 818 | 5934 |
| KF-WSM3-Duh-YSU | 0.2618 | 0.1129 | 0.8812 | 0.3903 | 0.5571 | 838 | 1054 | 1309 | 4359 | 0.1675 | 0.0983 | 0.948 | 0.2794 | 0.7053 | 285 | 682 | 735 | 5858 |
| KF-WSM3-God-MYJ | 0.2596 | 0.0844 | 1.1495 | 0.4429 | 0.6147 | 951 | 1517 | 1196 | 3896 | 0.1334 | 0.0538 | 1.2235 | 0.2618 | 0.7861 | 267 | 981 | 753 | 5559 |
| KF-WSM3-God-YSU | 0.2817 | 0.1073 | 1.1593 | 0.4746 | 0.5906 | 1019 | 1470 | 1128 | 3943 | 0.1631 | 0.081 | 1.3216 | 0.3255 | 0.7537 | 332 | 1016 | 688 | 5524 |
| KF-WSM5-Duh-MYJ | 0.2508 | 0.1005 | 0.8882 | 0.3787 | 0.5737 | 813 | 1094 | 1334 | 4319 | 0.1333 | 0.0694 | 0.8167 | 0.2137 | 0.7383 | 218 | 615 | 802 | 5925 |
| KF-WSM5-Duh-YSU | 0.2671 | 0.1193 | 0.8738 | 0.395 | 0.548 | 848 | 1028 | 1299 | 4385 | 0.158 | 0.0902 | 0.9118 | 0.2608 | 0.714 | 266 | 664 | 754 | 5876 |
| KF-WSM5-God-MYJ | 0.2723 | 0.0967 | 1.1635 | 0.463 | 0.6021 | 994 | 1504 | 1153 | 3909 | 0.1354 | 0.0571 | 1.1863 | 0.2608 | 0.7802 | 266 | 944 | 754 | 5596 |
| KF-WSM5-God-YSU | 0.2652 | 0.0932 | 1.1178 | 0.4439 | 0.6029 | 953 | 1447 | 1194 | 3966 | 0.1507 | 0.0709 | 1.2382 | 0.2931 | 0.7633 | 299 | 964 | 721 | 5576 |
| KF-WSM6-Duh-MYJ | 0.2545 | 0.0952 | 0.9767 | 0.401 | 0.5894 | 861 | 1236 | 1286 | 4177 | 0.1237 | 0.0546 | 0.9324 | 0.2127 | 0.7718 | 217 | 734 | 803 | 5806 |
| KF-WSM6-Duh-YSU | 0.2615 | 0.1084 | 0.9208 | 0.3982 | 0.5675 | 855 | 1122 | 1292 | 4291 | 0.156 | 0.0841 | 1.0127 | 0.2716 | 0.7318 | 277 | 756 | 743 | 5784 |
| KF-WSM6-God-MYJ | 0.2693 | 0.0883 | 1.2259 | 0.4723 | 0.6147 | 1014 | 1618 | 1133 | 3795 | 0.1398 | 0.0571 | 1.3265 | 0.2853 | 0.7849 | 291 | 1062 | 729 | 5478 |
| KF-WSM6-God-YSU | 0.2853 | 0.1072 | 1.2054 | 0.4895 | 0.5939 | 1051 | 1537 | 1096 | 3876 | 0.1513 | 0.0661 | 1.4245 | 0.3186 | 0.7763 | 325 | 1128 | 695 | 5412 |
3.2. Skill Score Validation
The charts for the skill scores at the two thresholds in Figures 5 and 6 show that the TS value at the 24 h forecast range is about 0.2 to 0.27 for >25 mm/24 h and 0.1 to 0.2 for >50 mm/24 h. At 48 h, the TS is around ∼0.18 to 0.3 and ∼0.1 to 0.19 corresponding to two thresholds >25 mm/24 h and >50 mm/24 h. At 72 h, the TS is around 0.15 to 0.25 and ∼0.08 to 0.15 corresponding to two thresholds >25 mm/24 h and >50 mm/24 h.
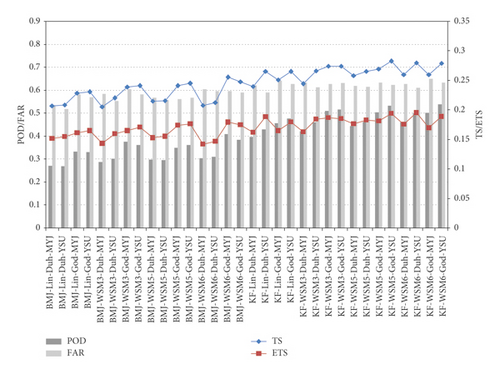
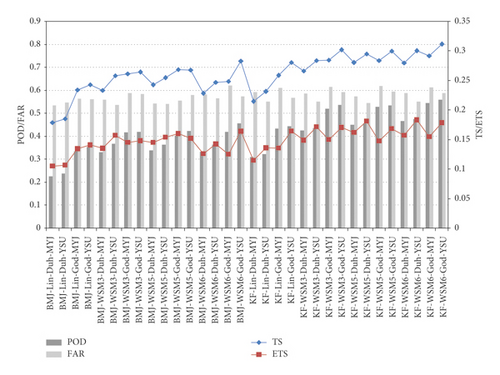

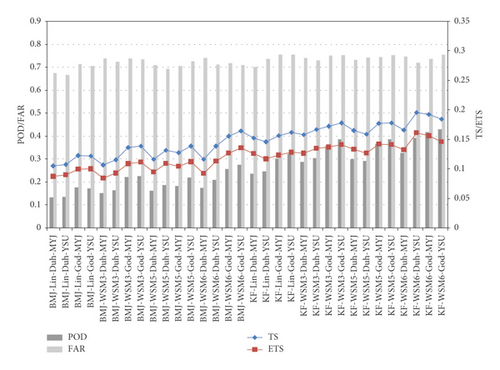
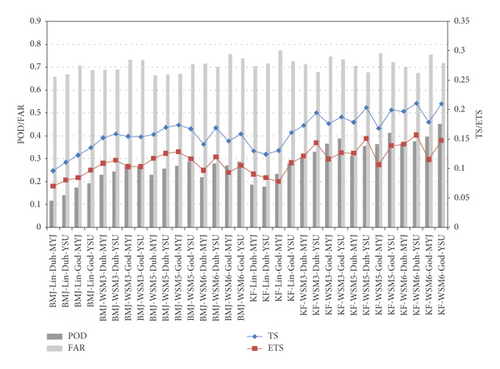
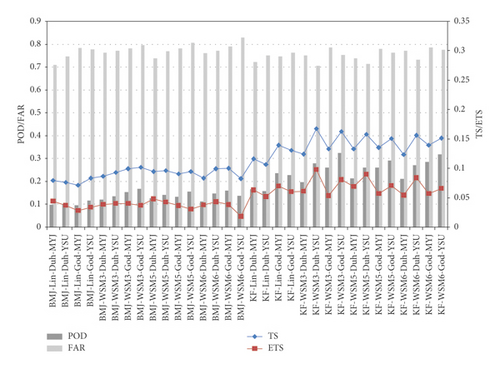
The probability of detection decreases and the false alarm rate clearly increases with forecast ranges and the validating thresholds. In addition, when the threshold increases, the difference between the TS and the ETS decreases which means that the amount of Hitsrandom is too small or the cause of very small hit rate (Hitsrandom rate decreases by 90% when changing the threshold from >25 mm/24 h to >50 mm/24 h).
Specific comparisons between the combinations of the BMJ or KF scheme show that the KF scheme model’s skills in heavy rain forecast in the northern region of Vietnam are better than BMJ scheme model’s skills. The average TS with the KF scheme can be about 15–25% larger than that using the BMJ scheme. If the difference of skills in a regional model is insignificant when changing the physical parameterization schemes, the lateral boundary conditions (from global forecasts) will greatly affect the quality of the dynamical downscaling forecasts after 24 h integration. However, here the skill difference when combining the two different cumulus schemes in the longer forecast range (such as 72 h) shows the importance of convection simulation capability contributing to the forecasting quality of the model. Detailed evaluation of the combination with the radiation physical schemes of KF or BMJ does not show any difference compared to changing the boundary layer schemes when looking at the skill scores TS or ETS.
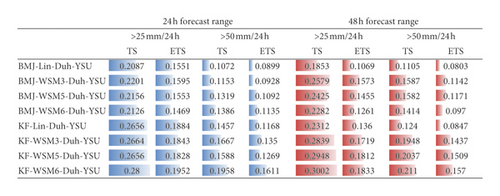
The combinations with YSU boundary layer schemes have better skills compared to those with MYJ schemes. In addition, when changing the complexity of the cloud microphysics schemes, the more complex the microphysical processing simulation, the better the TS and ETS (at 24, 48, and 72 h forecast ranges and two validating thresholds; see Figure 7 for comparison of the change in TSs and ETSs with the cloud microphysics scheme).
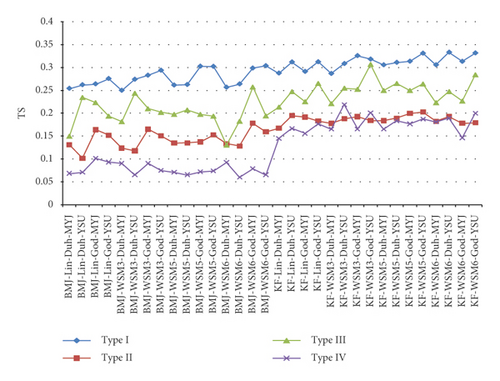
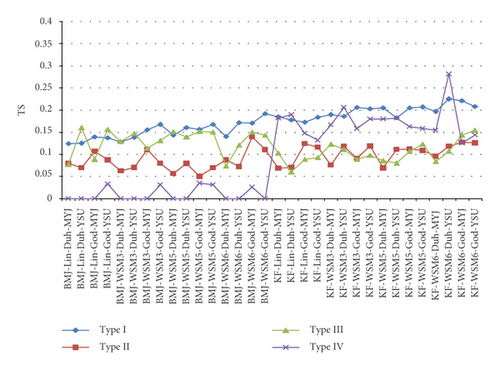
For the skill comparisons of different event types (I, II, III, and IV), Figure 8 shows the TSs at thresholds over 25 mm/24 h and over 50 mm/24 h for 24 h and 48 h forecast ranges. For type I, which is associated with the activity of ITCZ and low-pressure trough over the Bac Bo area, the KF scheme proved its forecast skills in almost forecast ranges and thresholds mentioned in this research. However, with the rain caused by tropical cyclone in type II, the difference between KF and BMJ schemes within 24 h was smaller than that in type I. In 48 h and 72 h, the BMJ scheme showed more skilled forecast with the skill score for threshold 25 mm ranging from 0.25 to 0.35 of the BMJ scheme, compared with 0.2 to 0.3 of the KF scheme, and the skill score for threshold 50 mm ranging from 0.2 to 0.3 of the BMJ scheme, compared with 0.2 to 0.25 of the KF scheme. In type II, both KF and BMJ schemes combined with the simple cloud microphysics Lin scheme showed lowest skill score. For type III, which is associated with the activity of cold surge and its role in squeezing the low-pressure trough from the north towards Bac Bo, the KF scheme was only skillful in threshold 25 mm in 24 h. Particularly in type IV, which contains heavy rain events caused by a complex combination of situations resulting in a trough in Bac Bo, the KF scheme still showed skilled forecast compared to very low forecast (no skill with threshold over 50 mm/24 h and 25 mm/24 h) of BMJ scheme experiments. More details of TSs for different types are listed in Tables 7 and 8.
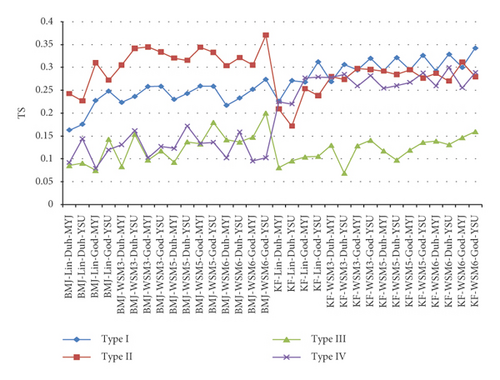
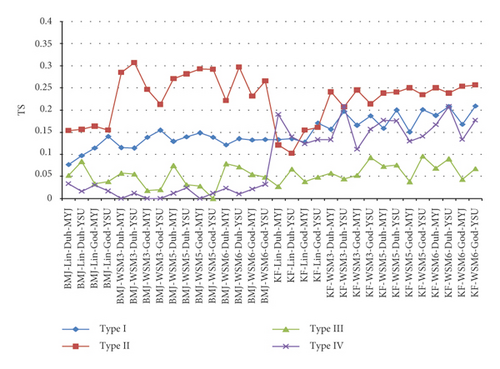
| >25 mm/24 h | >50 mm/24 h | |||||||
|---|---|---|---|---|---|---|---|---|
| Type I | Type II | Type III | Type IV | Type I | Type II | Type III | Type IV | |
| BMJ-Lin-Duh-MYJ | 0.2546 | 0.1309 | 0.15 | 0.0682 | 0.124 | 0.0791 | 0.0769 | 0 |
| BMJ-Lin-Duh-YSU | 0.2625 | 0.1019 | 0.2346 | 0.0706 | 0.1244 | 0.0692 | 0.16 | 0 |
| BMJ-Lin-God-MYJ | 0.2644 | 0.1638 | 0.2235 | 0.1011 | 0.139 | 0.1064 | 0.0882 | 0 |
| BMJ-Lin-God-YSU | 0.2761 | 0.1519 | 0.1939 | 0.093 | 0.1369 | 0.087 | 0.1562 | 0.0333 |
| BMJ-WSM3-Duh-MYJ | 0.2503 | 0.1237 | 0.1818 | 0.09 | 0.1279 | 0.0621 | 0.129 | 0 |
| BMJ-WSM3-Duh-YSU | 0.2745 | 0.1179 | 0.2439 | 0.0652 | 0.1379 | 0.0699 | 0.1471 | 0 |
| BMJ-WSM3-God-MYJ | 0.2834 | 0.1651 | 0.21 | 0.09 | 0.1556 | 0.1104 | 0.1136 | 0 |
| BMJ-WSM3-God-YSU | 0.2943 | 0.1505 | 0.202 | 0.0745 | 0.167 | 0.0798 | 0.1304 | 0.0312 |
| BMJ-WSM5-Duh-MYJ | 0.2618 | 0.1349 | 0.1977 | 0.0707 | 0.1429 | 0.0563 | 0.1515 | 0 |
| BMJ-WSM5-Duh-YSU | 0.263 | 0.1351 | 0.2073 | 0.0652 | 0.1603 | 0.0789 | 0.1389 | 0 |
| BMJ-WSM5-God-MYJ | 0.3032 | 0.1376 | 0.1978 | 0.0714 | 0.1565 | 0.0496 | 0.1515 | 0.0345 |
| BMJ-WSM5-God-YSU | 0.3028 | 0.1525 | 0.1939 | 0.0737 | 0.1677 | 0.0696 | 0.15 | 0.0312 |
| BMJ-WSM6-Duh-MYJ | 0.2571 | 0.133 | 0.1304 | 0.0926 | 0.1403 | 0.0872 | 0.0732 | 0 |
| BMJ-WSM6-Duh-YSU | 0.2643 | 0.1281 | 0.1828 | 0.06 | 0.1714 | 0.0719 | 0.1212 | 0 |
| BMJ-WSM6-God-MYJ | 0.2991 | 0.1781 | 0.2574 | 0.0784 | 0.1706 | 0.1391 | 0.15 | 0.0256 |
| BMJ-WSM6-God-YSU | 0.3043 | 0.1595 | 0.1944 | 0.0652 | 0.1916 | 0.1104 | 0.1429 | 0 |
| KF-Lin-Duh-MYJ | 0.2881 | 0.1673 | 0.2136 | 0.1449 | 0.1844 | 0.0683 | 0.1026 | 0.1818 |
| KF-Lin-Duh-YSU | 0.3125 | 0.1951 | 0.2474 | 0.1667 | 0.1778 | 0.0698 | 0.06 | 0.1892 |
| KF-Lin-God-MYJ | 0.2917 | 0.1914 | 0.2255 | 0.1558 | 0.1725 | 0.1237 | 0.0889 | 0.1471 |
| KF-Lin-God-YSU | 0.3129 | 0.183 | 0.2653 | 0.1769 | 0.1839 | 0.1162 | 0.093 | 0.1316 |
| KF-WSM3-Duh-MYJ | 0.2872 | 0.1776 | 0.2212 | 0.1655 | 0.1893 | 0.0753 | 0.1224 | 0.1667 |
| KF-WSM3-Duh-YSU | 0.309 | 0.1881 | 0.2551 | 0.219 | 0.1858 | 0.1176 | 0.1111 | 0.2059 |
| KF-WSM3-God-MYJ | 0.3264 | 0.1924 | 0.2526 | 0.1656 | 0.2057 | 0.0909 | 0.0889 | 0.1579 |
| KF-WSM3-God-YSU | 0.3188 | 0.1841 | 0.3069 | 0.2014 | 0.2027 | 0.1185 | 0.098 | 0.1795 |
| KF-WSM5-Duh-MYJ | 0.3062 | 0.1836 | 0.25 | 0.1655 | 0.2048 | 0.0688 | 0.0851 | 0.1795 |
| KF-WSM5-Duh-YSU | 0.3116 | 0.1892 | 0.2653 | 0.1838 | 0.1823 | 0.1111 | 0.08 | 0.1818 |
| KF-WSM5-God-MYJ | 0.3141 | 0.1996 | 0.25 | 0.1772 | 0.2047 | 0.1122 | 0.1064 | 0.1622 |
| KF-WSM5-God-YSU | 0.3317 | 0.2025 | 0.2642 | 0.1875 | 0.2063 | 0.1085 | 0.1228 | 0.1579 |
| KF-WSM6-Duh-MYJ | 0.3063 | 0.1823 | 0.2233 | 0.1812 | 0.1963 | 0.0952 | 0.0833 | 0.1538 |
| KF-WSM6-Duh-YSU | 0.3339 | 0.1927 | 0.2476 | 0.1898 | 0.2244 | 0.1179 | 0.1071 | 0.2812 |
| KF-WSM6-God-MYJ | 0.3138 | 0.1781 | 0.2268 | 0.1465 | 0.2207 | 0.1268 | 0.1429 | 0.125 |
| KF-WSM6-God-YSU | 0.3323 | 0.1793 | 0.2843 | 0.2 | 0.2078 | 0.1255 | 0.1538 | 0.1429 |
| >25 mm/24 h | >50 mm/24 h | |||||||
|---|---|---|---|---|---|---|---|---|
| Type I | Type II | Type III | Type IV | Type I | Type II | Type III | Type IV | |
| BMJ-Lin-Duh-MYJ | 0.1629 | 0.2426 | 0.0854 | 0.0922 | 0.0768 | 0.1533 | 0.0526 | 0.0333 |
| BMJ-Lin-Duh-YSU | 0.1755 | 0.2271 | 0.0909 | 0.1438 | 0.0971 | 0.1559 | 0.0833 | 0.0164 |
| BMJ-Lin-God-MYJ | 0.2276 | 0.3104 | 0.075 | 0.0798 | 0.1139 | 0.1631 | 0.0333 | 0.0303 |
| BMJ-Lin-God-YSU | 0.2482 | 0.2723 | 0.1429 | 0.12 | 0.1405 | 0.1543 | 0.0385 | 0.0167 |
| BMJ-WSM3-Duh-MYJ | 0.2235 | 0.3055 | 0.0833 | 0.1311 | 0.1147 | 0.2848 | 0.0571 | 0 |
| BMJ-WSM3-Duh-YSU | 0.2365 | 0.3419 | 0.1538 | 0.1617 | 0.1136 | 0.3072 | 0.0556 | 0.0116 |
| BMJ-WSM3-God-MYJ | 0.2583 | 0.3448 | 0.0979 | 0.1029 | 0.1386 | 0.2466 | 0.0182 | 0 |
| BMJ-WSM3-God-YSU | 0.2587 | 0.3338 | 0.1176 | 0.1272 | 0.1541 | 0.2125 | 0.02 | 0 |
| BMJ-WSM5-Duh-MYJ | 0.2301 | 0.3206 | 0.0928 | 0.1228 | 0.1287 | 0.2706 | 0.0741 | 0.0115 |
| BMJ-WSM5-Duh-YSU | 0.243 | 0.3157 | 0.1373 | 0.172 | 0.1397 | 0.2813 | 0.0312 | 0.0241 |
| BMJ-WSM5-God-MYJ | 0.2594 | 0.344 | 0.1327 | 0.1337 | 0.1479 | 0.2928 | 0.0286 | 0 |
| BMJ-WSM5-God-YSU | 0.2588 | 0.3329 | 0.1797 | 0.1364 | 0.1383 | 0.2918 | 0 | 0.0115 |
| BMJ-WSM6-Duh-MYJ | 0.217 | 0.304 | 0.1418 | 0.1027 | 0.1214 | 0.2212 | 0.0784 | 0.0235 |
| BMJ-WSM6-Duh-YSU | 0.2331 | 0.3216 | 0.1368 | 0.1587 | 0.1348 | 0.2968 | 0.0714 | 0.0103 |
| BMJ-WSM6-God-MYJ | 0.2522 | 0.3055 | 0.1474 | 0.0955 | 0.132 | 0.2314 | 0.0541 | 0.0215 |
| BMJ-WSM6-God-YSU | 0.2739 | 0.3707 | 0.2 | 0.1026 | 0.1333 | 0.2658 | 0.0484 | 0.0319 |
| KF-Lin-Duh-MYJ | 0.2259 | 0.2093 | 0.0811 | 0.225 | 0.1331 | 0.1208 | 0.027 | 0.1899 |
| KF-Lin-Duh-YSU | 0.2714 | 0.172 | 0.0957 | 0.2199 | 0.1347 | 0.1017 | 0.0667 | 0.1395 |
| KF-Lin-God-MYJ | 0.268 | 0.2537 | 0.1043 | 0.2771 | 0.1267 | 0.1545 | 0.0385 | 0.1237 |
| KF-Lin-God-YSU | 0.3125 | 0.2384 | 0.1058 | 0.2788 | 0.1704 | 0.1608 | 0.0488 | 0.1327 |
| KF-WSM3-Duh-MYJ | 0.2689 | 0.2805 | 0.1298 | 0.2783 | 0.156 | 0.241 | 0.0577 | 0.1327 |
| KF-WSM3-Duh-YSU | 0.3066 | 0.2739 | 0.069 | 0.285 | 0.1971 | 0.2068 | 0.0444 | 0.2088 |
| KF-WSM3-God-MYJ | 0.2945 | 0.2976 | 0.1286 | 0.2595 | 0.1651 | 0.2451 | 0.0526 | 0.1111 |
| KF-WSM3-God-YSU | 0.3202 | 0.2956 | 0.1407 | 0.2822 | 0.1872 | 0.2136 | 0.0923 | 0.1569 |
| KF-WSM5-Duh-MYJ | 0.2924 | 0.2921 | 0.1176 | 0.2546 | 0.1586 | 0.238 | 0.0727 | 0.1765 |
| KF-WSM5-Duh-YSU | 0.3217 | 0.2847 | 0.0976 | 0.26 | 0.1995 | 0.2403 | 0.0755 | 0.1753 |
| KF-WSM5-God-MYJ | 0.2946 | 0.2953 | 0.1192 | 0.2672 | 0.1499 | 0.25 | 0.038 | 0.1293 |
| KF-WSM5-God-YSU | 0.3265 | 0.2768 | 0.1361 | 0.2881 | 0.201 | 0.2344 | 0.0959 | 0.1404 |
| KF-WSM6-Duh-MYJ | 0.2922 | 0.2874 | 0.1389 | 0.2597 | 0.1874 | 0.25 | 0.0685 | 0.1667 |
| KF-WSM6-Duh-YSU | 0.3291 | 0.2706 | 0.1311 | 0.2995 | 0.208 | 0.2378 | 0.0893 | 0.2083 |
| KF-WSM6-God-MYJ | 0.3002 | 0.3115 | 0.1465 | 0.2556 | 0.1675 | 0.2537 | 0.0435 | 0.1333 |
| KF-WSM6-God-YSU | 0.3426 | 0.2798 | 0.1595 | 0.2888 | 0.2091 | 0.2565 | 0.0674 | 0.177 |
4. Conclusions
For the purpose of investigating the effects of physical schemes in the WRF-ARW model on the operational heavy rainfall forecast for the Bac Bo area, 32 different model configurations have been established by switching two typical cumulus parameterization schemes (BMJ and KF), the cloud microphysics schemes from simple (Lin) to complex (WSM with 3/5/6-layer closure assumptions), and boundary layer (YSU and MYJ) and shortwave radiation (Dudhia and Goddard) schemes. The 72 experiments of widespread heavy rainfall occurring in the Bac Bo area used boundaries from the GFS model and had the highest horizontal resolution of 5 km × 5 km.
The model verification with local observation data illustrated the limited capabilities in heavy rainfall forecast for the northern part of Vietnam. On average, for the threshold over 25 mm/24 h, the TSs are from 0.2 to 0.25, 0.2 to 0.3, and 0.2 to 0.25 for 24 h, 48 h, and 72 h forecast ranges, respectively. For the threshold over 50 mm/24 h, TSs are 0.1–0.2 for 24 h and 48 h forecast ranges and about 0.1–0.15 for the 72 h forecast range. At above the 100 mm/24 h threshold, a very low skill value (below 0.1) is validated for most forecast ranges.
The change of the microcloud physics from simple to complex closure assumptions shows that complex schemes give very positive results for both the BMJ and KF schemes. The model configurations with the KF scheme showed higher skills compared to BMJ scheme configurations, and these higher skill scores (TS and POD) mainly come from a higher hit rate (H) and a lower missed rate (M) but also a higher false alarm rate (F). More preliminary assessment for the KF scheme configurations showed the most sensitivity of boundary layer schemes compared to microphysics or shortwave radiation schemes and some initial comments that boundary layer interaction during the application of the KF scheme is an important factor to find the appropriate parameters for heavy rainfall forecast over the Bac Bo area in the WRF-ARW model.
In terms of sample size of each category, the first two types are comparable because of the similar sample size. The other two types, however, are limited in sample size and need to be further analyzed in the subsequent research. A detailed assessment related to the origin of the mechanisms causing heavy rain illustrates that the KF scheme showed more skilled forecast with the BMJ scheme during trough- or ITCZ-related heavy rain events, whereas it was less skilled in the events caused by tropical cyclones. With the events caused by the cold surge and a combination of different patterns, the skill of the BMJ scheme was quite low. More verification with the last two types needs to be further investigated in the subsequent research because of the limited sample size studied.
Conflicts of Interest
The authors declare that they have no conflicts of interest.
Acknowledgments
This paper describes the results of the National KC.08.06/16-20 Project “Developing an operational heavy rainfall forecast system for the northern part of Vietnam” funded by the Vietnamese Ministry of Science and Technology and the Project VT-CN.04/17-20 funded by the National Program on Space Science and Technology, Vietnam Academy of Science and Technology. L. R. Hole was sponsored by the Norwegian Agency for Development Cooperation and the Norwegian Ministry of Foreign Affairs. The authors would like to thank Ms. Huyen Khanh Luu for her data preparations.
Open Research
Data Availability
The data used to support the findings of this study are available from the corresponding author upon request.


