Solidification Microstructure Evolution of Undercooled Cu-15 wt.% Fe Alloy Melt
Abstract
The solidification microstructure evolution of undercooled Cu-15 wt.% Fe alloy melt was studied in this study by the combined method of glass fluxing and overheating. The liquidus and peritectic reaction temperatures of Cu-15 wt.% Fe were experimentally obtained, and the obtained results were consistent with the previous studies. Based on the experimental results and related theories, the solidification process and microstructure evolution of undercooled Cu-15 wt.% Fe alloy melt were illustrated. The conclusions provide the basis to the further study on the liquid-phase separation and application of copper-iron alloy.
1. Introduction
It is well known that Cu-Fe alloy has high strength, good plasticity, giant magnetoresistance (GMR), and excellent electrical and thermal conductivity. In addition, Fe is characterized by the low price and abundant resources. Therefore, Cu-Fe alloy is widely applied in aviation, automobile, communication, and electronic manufacturing [1]. However, the solidification process of Cu-Fe alloy is different from that of conventional metals due to the great positive enthalpy between liquid Cu and Fe. When the melt cools rapidly, the liquid-phase separation occurs, thus leading to solidification below the liquid metastable miscibility gap. The liquid-phase separation of Cu-Fe alloy has been experimentally investigated at home and abroad, and the existence of liquid metastable miscibility gap has been proved [2, 3]. The occurrence of liquid-phase separation greatly weakens the microstructure-related properties of Cu-Fe alloy and limits its application. Therefore, it is imperative to explore the solidification process of Cu-Fe alloy melt in the undercooled state.
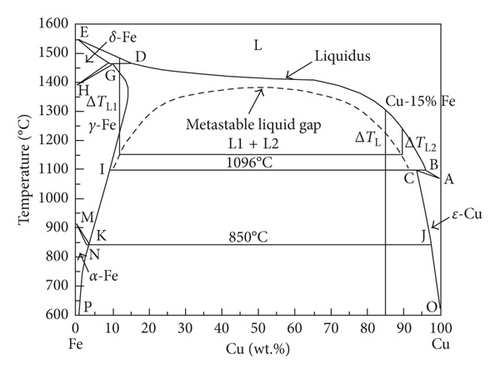
Although the process and mechanisms of peritectic transformation have been extensively studied in recent decades [4–11], the solidification process of this alloy involving metastable liquid-phase separation, nucleation, and growth is not understood completely. In addition, due to the complexity of the microstructure kinetic evolution during solidification in the metastable miscibility gap, the microstructure evolution of these alloys has not been investigated quantitatively. The study aims to investigate the microstructure evolution and phase separation of Cu-15 wt.% Fe alloy melt by combining cyclic superheating with glass melting. Its position in the phase diagram [2] is shown in Figure 1.
2. Experiment
Cu and Fe plates were firstly machined to remove impurities from the surface, and then the machined plates were soaked in anhydrous alcohol, followed by quickly cleaning and drying to prevent surface oxidation. In order to ensure that the cooling conditions of the sample are about the same, the weight of the sample is about 15 g, but the weight of the sample must be the same under the same composition. The raw thin metal pieces were uniformly placed at the bottom of the crucible according to a predetermined distribution ratio, and then a certain quantity of B2O3 glass was covered on the top surface. In order to avoid the further oxidation of the metal, after all the fine metal pieces are melted and the superheating of the melt reached 150 K, the heat preservation was carried out for 3 to 5 min, and then the sample was slowly cooled in the furnace. After complete solidification, the sample was heated again to the maximum temperature. These procedures were repeated several times until the alloy achieved the desired undercooling state. Then the sample was taken out.
The samples were embedded, polished, and corroded, and then the microstructure was analyzed by the 4XA HITACHI microscope and HITACHI S-3000N scanning electron microscope. The etchant was FeCl3 + HCl + H2O solution. The microstructure, phase structure, phase transition process, and composition of the samples were analyzed by the optical microscope, scanning electron microscope (SEM), and X-ray diffractometer (XRD), respectively. The phase structures of some samples were analyzed on the Rigaka D/max-RB X-ray diffractometer produced by Japanese Science Company. The scanning angle ranged from 20° to 100°.
3. Results and Discussion
3.1. Solidification Process
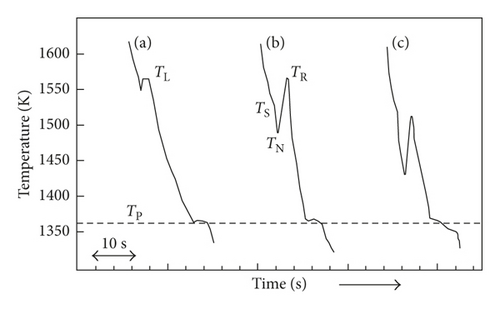
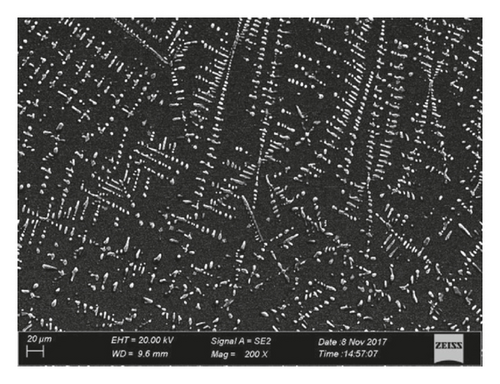
Figure 2 illustrates the measured cooling profiles of three Cu-15 wt.% Fe samples at different undercooling states. On the curve (a), there was a recalescence corresponding to the growth of primary γ-Fe dendrites (at about 1543 K) and then led to thermal arrest, which determined the liquidus temperature, TL ≈ 1578 K. The measured TL was consistent with the value in the equilibrium phase diagram [2], thus confirming the present temperature calibration. Moreover, it is also confirmed in Figure 3, since γ-Fe dendrites are clearly visible. For all the curves in Figure 2, after further cooling, the peritectic reaction can be observed at TP (at about 1369 K). At the higher undercooling, additional anomalies appear before the major recalescence, as marked by TS in Figure 2(b). This unusual phenomenon neither emerged at low undercooling, nor arose from the flux agent due to the low-transition temperature (lower than 800 K) of the glass. Accordingly, it can be deduced that the anomalous behavior on the curve (b) can be attributed to a precursor reaction [12], namely, a phase separation in the sufficiently undercooled melts. The angular point on the cooling curve before the recalescence onset is hereafter referred to as TS, the temperature at which the separation process into two liquid phases L1 (Fe-rich) and L2 (Cu-rich) begins. As the undercooling increases, liquid-phase separation and recalescence are more obvious, as shown in Figure 2(c).
3.2. Microstructural Selection
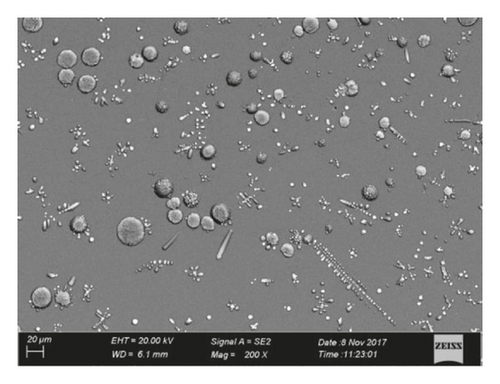
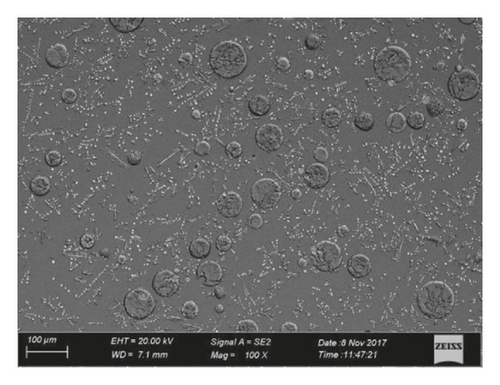
Figure 4(a) shows the liquid-phase separation microstructure of Cu-15 wt.% Fe at the undercooling of 75 K. The lever rule and the metastable miscibility gap of Cu-Fe phase diagrams (Figure 1) indicate that the Cu-15 wt.% Fe melt at the undercooling of 75 K is separated into a Fe-rich melt (L1) and a Cu-rich melt (L2). Obviously, the spheres (Figure 4(a)) are the L1 (Fe-rich) minority phase [13]. Furthermore, there are a few of γ-Fe dendrites formed due to segregation of the L2 (Cu-rich) phase [14].
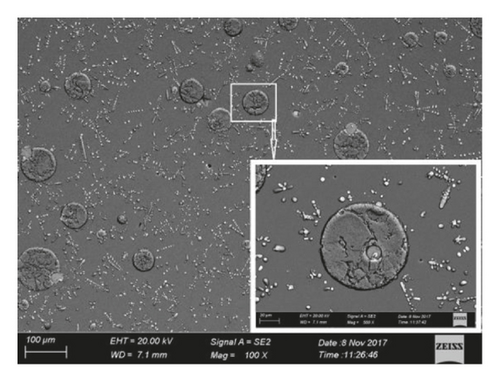
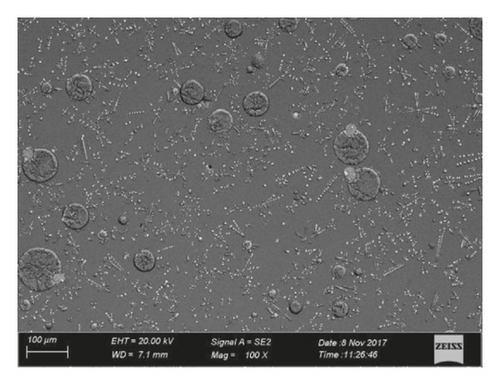
During the further cooling process, the solute of one phase in another phase tends to be supersaturated. It should be noted that the solute is a relative concept. Cu in the L1 (Fe-rich) phase is a solute, and Fe in the L2 (Cu-rich) phase is a solute. In general, the composition of each liquid is expected to follow the miscibility phase boundary if adequate time is allowed for the complete transfer of atoms between the two phases [16]. At the same time, within a metastable miscibility gap of salient nonequilibrium features, the viscosity rises and diffusion coefficient declines with the increase in undercooling [12]. In these circumstances, complete diffusion was absent, and secondary separation (even multiphase separation) in liquid might occur. An example is shown in Figure 4(b).
3.3. Microstructural Evolution
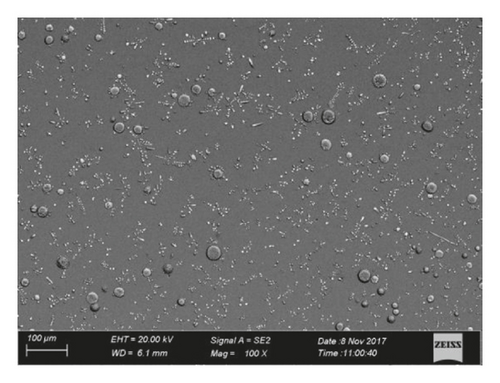
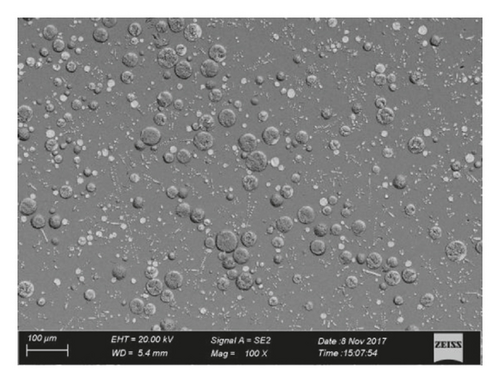
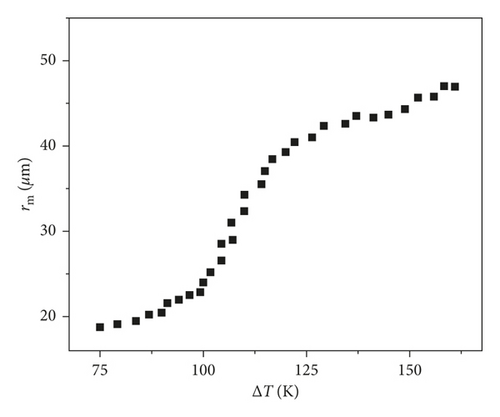
The microstructures at different undercooling states were observed at the same magnification (Figure 5). The droplet size increases with the increase in the undercooling because the higher the undercooling is, the larger the interval ∆t from TS to TN is, that is, the longer coarsening time. By assuming that the largest droplet radius, rm, can be used to quantify the extent of droplets coarsening [12], a relationship between rm and ΔT is shown in Figure 6. Corresponding to two-characteristic undercooling states, that is, ΔTc1 = 103 K and ΔTc2 = 142 K, the increase of rm with ΔT can be divided into three regimes: small rm accompanying with a slow increasing rate (i.e., drm/dΔT) for ΔT < ΔTc1, and medium rm with a steep drm/dΔT for ΔTc1 < ΔT < ΔTc2. This result is consistent with the previous analysis result of undercooled Cu-Co melt [12]. However, in the later stage of liquid-phase separation, there is a slight deviation between the results in this study and previous results [2, 12] because the maximum undercooling achieved in the study is not large enough.
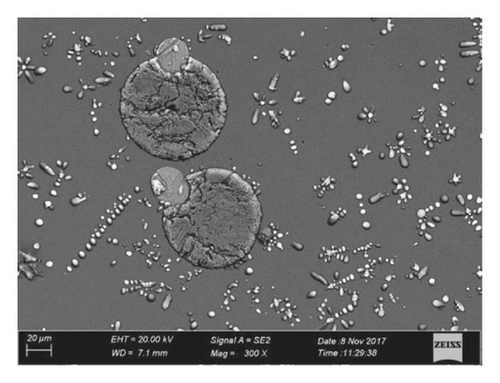
As the undercooling continues to increase, the size of droplets increases significantly and the effect of Stokes movement gradually becomes prominent. According to (4) and (5) when the droplet size is larger, VS is much larger than VM, and Ostwald ripening and Brownian motions are significantly weakened. Therefore, Stokes movement plays a dominant role in the midliquid-phase separation. Furthermore, a higher undercooling tends to facilitate Stokes movement [23]. Migration and coagulation of droplets are intensified significantly due to the gradually enhanced Stokes movement, thus resulting in the rapid increase in the droplet size. In turn, the progressively larger droplet sizes further promote Stokes movement, as shown in Figure 7. The two coagulating spheres are not in the same color because of differences in the composition between two spheres in Figure 7(b). As mentioned above, the larger sphere with the darker color is the Fe-rich sphere, and the smaller sphere with the lighter color is the Cu-rich sphere. It is assumed that the main coagulation mechanism of the two spheres is the Ostwald ripening, but the smaller sphere with the low content of Fe coagulates with the larger sphere with the high content of Fe. The above mechanism is contrary to the Ostwald ripening mechanism due to the concentration gradient. The result confirms the above conclusion that the Stokes movement is the main mechanism. Consequently, the droplet size presents the linear growth with the increase in the undercooling in the medium stage of the liquid-phase separation. The result is consistent with that shown in Figure 6.

4. Conclusions
Solidification microstructure evolution of undercooled Cu-15 wt.% Fe alloy melt has been described and analyzed in detail based on experimental and theoretical studies. It was found that the droplet size of undercooled Cu-15 wt.% Fe alloy melt gradually increased with the increase in the undercooling. The increasing speed showed a slow-fast-slow tendency. This tendency had been analyzed and explained theoretically. The measures for dealing with the liquid-phase separation microstructure will be explored in the future study.
Conflicts of Interest
The authors declare that they have no conflicts of interest.
Acknowledgments
This work was cofinanced by the National Natural Science Foundation of China (Grant nos. 51675361 and 51561001).
Open Research
Data Availability
The data used to support the findings of this study are available from the corresponding author upon request.


