A Network Pharmacology-Based Approach to Investigate the Novel TCM Formula against Huntington’s Disease and Validated by Support Vector Machine Model
Abstract
Several pathways are crucial in Huntington’s disease (HD). Based on the concept of multitargets, network pharmacology-based analysis was employed to find out related proteins in disease network. The network target method aims to find out related mechanism of efficacy substances in rational design way. Traditional Chinese medicine prescriptions would be used for research and development against HD. Virtual screening was performed to obtain drug molecules with high binding capacity from traditional Chinese medicine (TCM) database@Taiwan. Quantitative structure-activity relationship (QSAR) models were conducted by MLR, SVM, CoMFA, and CoMSIA, constructed to predict the bioactivities of candidates. The compounds with high-dock score were further analyzed compared with control. Traditional Chinese medicine reported in the literature could be the training set provided for constructing novel formula by SVM model. We tried to find a novel formula that can bind well with these targets at the same time, which indicates our design could be highly related to the HD. Additionally, the candidates would validate by a long-term molecular dynamics (MD) simulation, 5 microseconds. Thus, we suggested the herbs Brucea javanica, Holarrhena antidysenterica, Dichroa febrifuga, Erythrophleum guineense, etc. which contained active compounds might be a novel medicine formula toward Huntington’s disease.
1. Introduction
Huntington disease (HD) is a kind of involuntary movement, mental disorders, and progressive dementia as the main clinical features of dominant hereditary neurological degeneration disease. The pathology is identified as the protein named Huntingtin [1], which is produced by the site 63 of fourth chromosome. Pathological changes are characterized by the loss of nerve cells in the striatum and cerebral cortex. The novel research points out that the link between peripheral biology and neurodegeneration are shown in other chronic neurodegenerative diseases, suggesting that the modulation of peripheral targets may provide novel ways of therapeutic development [2]. The information here also indicated a multitargets way against the disease.
Neurodegenerative diseases were studied together frequently [3] because of the common features such as misfolding [4]. Studies had constructed a single cell model that greatly promotes the development of neurodegenerative diseases [5]. Many genes are involved in HD [6]. Correspondingly, the treatment of HD is related to multiple ideas, such as antiapoptotic effect [7], antioxidant [8, 9], improving memory by enhancing hippocampal synaptic plasticity [10], and immunotherapies [11].
A novel method of merging traditional Chinese medicine (TCM) with network pharmacology-based could be a reliable way to overcome disease. In the past decades, the single-target drugs sometimes did not achieve favorable therapeutic effects. It would prefer to use the network pharmacology-based approach to develop a treatment in a multitargeted, multidrug manner [12]. Recently, there is a concept about treating the whole body in HD [2]; brain cells are under attack, causing a stress response in cells far from the brain [13].
Most diseases are associated with multiple target proteins, and it is difficult to achieve proper therapeutic results with a single target. Similar to evidence-based medicine, protein-protein interaction (PPI) network is in line with both western medicine and traditional Chinese medicine. The theory of traditional Chinese medicine holds that the body is an organic whole, and its components are inseparable in structure. This association includes the PPI in modern medicine, which is interdependent in physiological conditions and influences each other in pathology [14].
TCM is the quintessence of China. After thousands years of accumulation, there are enough clinical examples to confirm its rationality [15]. Therefore, the return to traditional Chinese medicine is imperative. Developing a novel type of traditional Chinese medicine prescription could guide the treatment of diseases. Combined with the modern biotechnology computer simulation technology, it could filter out the leading small molecules from the TCM database within antidisease activity. As traditional Chinese medicine has the advantages of relative low toxicity [16], we propose to return to traditional Chinese medicine to screen out the appropriate formula to treat some diseases and even critical diseases. TCM had precedents for the treatment of diseases [17], even some of which modern medicine cannot solve.
The energy metabolism of medium-sized thorny neurons in the striatum of HD patients is affected by the abnormal energy metabolism that rapidly dissipates neurons and is susceptible to excite-toxicity and ultimately damage the cortical neurons, so abnormal energy metabolism may also be related to the pathogenesis of HD [18]. Knockdown of the mitochondrial chaperone mtHSP70 causes a unique fat-mediated stress response that corrects the cellular protein folding. Drugs that activate this mitochondrial-to-cytosolic stress response could play a protective role [13, 19]. In another word, mtHSP70 inhibitors could reduce protein misfolding, which is a key pathogenesis in lots of neurological diseases.
Another idea to cure HD is to protect neurons. The neuronal stress-protective transcription factor HSF1 will be abnormal degradation [20], which replaces the damage to protection factors. Therefore, we should protect the heat shock transcription factor 1 (HSF1) through a way of cutting the hurt of HSF1. Casein kinase II subunit alpha’ (CK2 alpha’, CSNK2A2, CK2A2) inhibitors play a pivoted role to protect HSF1 [20].
The biological significance of YAP binding to TEAD has been more and more clear, but the three-dimensional structure of both and the molecular mechanism of their action remain unclear. In recent year, this pathway is regarded as a potential target toward HD [21]. Huntington’s disease (HD) gene product Huntingtin (Htt) selectively induces new forms of necrotic cell death, in which the endoplasmic reticulum (ER) expands and the cell body asymmetric balloon is ultimately cracked. The special necrotic cell death is mediated by functional deficits in TEAD/YAP-dependent transcription instead of RIP1/3 pathway-dependent necroptosis [22]. The special necroptosis way depends on the way of transferring the YAP from TEAD to p73 through YAP phosphorylation [23]. It could be a therapeutic target against HD. The experimental protocol was aimed at developing a novel anti-HD TCM formula (Figure 1).
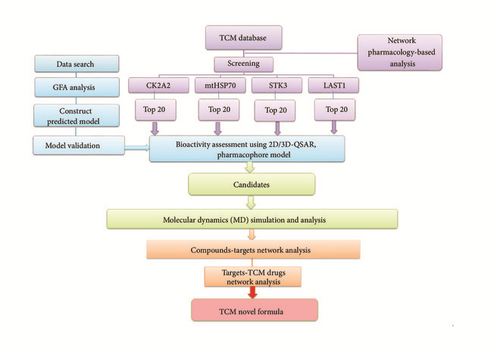
2. Materials and Methods
2.1. Network Pharmacology-Based Analysis
Based on the preliminary work, Kyoto Encyclopedia of Genes and Genomes (KEGG) database was utilized to generate the related proteins to construct a protein-protein interaction network. The hub protein should be identified in the pathway network. It was clear that the inhibition of Mitochondrial 70 kDa heat shock protein (mtHSP70, HAPA9, mortalin) and CK2A2 benefitted from HD resistance. Based on the multitarget idea, the related targets would be identified after network pharmacology-based analysis about YAP1 pathway. The YAP level would decrease in HD brain model [22], which indicates the downshift of YAP could be one of pathogenic factors. And the signal pathway could provide information of up-/down-adjust which can guide us to find the vital protein in the pathway network. Another 2 protein targets, Serine/threonine-protein kinase 3 (STK3) and Serine/threonine-protein kinase LATS1, were studied further.
2.2. 3D Structure Modeling for LATS1 Protein
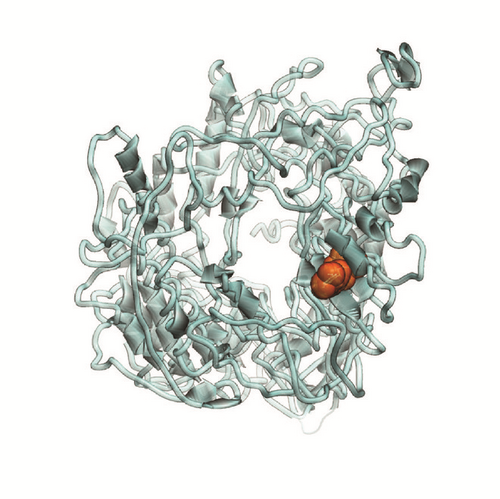
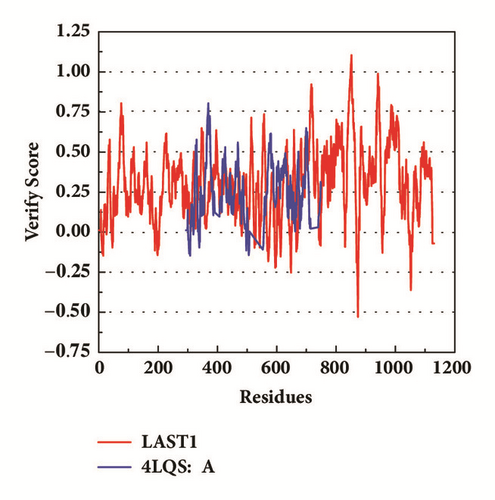
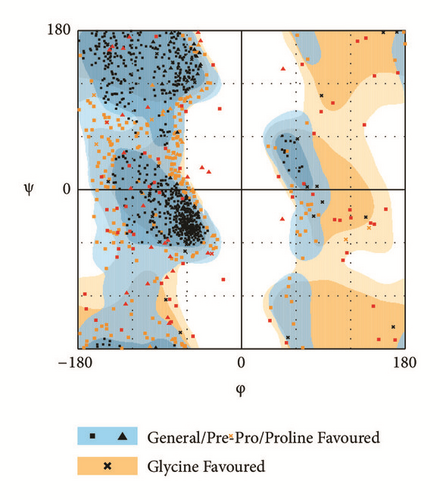
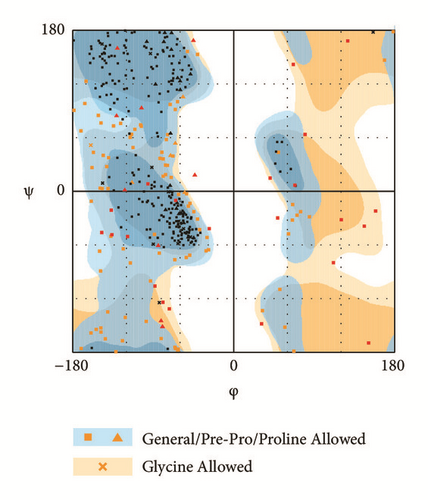
The protein LATS1 has no enough structure information for structure-based drug design. The origin structure of LATS1 in PDB (5BRK:B) was further modeled to obtain a complete structure [24]. The binding site is set as a natural structure, which indicates that it was credible. The structure was verified in Ramachandran plot [25] and Verify profile-3D.
2.3. Docking Study of Target Proteins
The sequence of human CK2alpha’ protein (residues 1-350) was acquired from the Uniprot Knowledgebase (P19784). The 3D crystal structure of human CK2alpha’ protein, 5M56 (residues 1-350) was obtained from Protein Database Bank (PDB) website [26]. 5M56 was the latest CK2alpha’ prototype structural which has the complete 3D structure used for ligand-protein docking. All compounds from TCM Database@Taiwan, the world largest TCM database [27], were applied to dock with 5M56 by using Accelrys Discovery Studio (DS) software. LigandFit program in DS was performed to conduct molecular docking procedure. The ATP binding area was set as a binding sites referring to the ATP-competitive inhibitors, and one of the known inhibitor was set as a control in our study [28]. HARvard Molecular Mechanics (CHARMm) force field was performed to minimize energy. Affinity would be considered in Dock score, where the ligands with high score in docking would be the candidates to interact with target. Multiple poses would be calculated, 11 scoring patterns would be considered, and the consensus score would be set as a comprehensive consideration.
The same way was descripted above; another two targets screened small molecules in the TCM database as well. The information of HSPA9 (mtHSP70) protein was gained from UniprotKB (P38646). 3D structure of HSPA9 was acquired in PDB (4KBO, 52-431). The binding pocket referred to the nucleotide-binding domain (NBD), which is an active binding region [29]. MST2 (STK3) protein in the PDB (4LGD, 4-491) was selected for studying similarly. A peptide could inhibit the homodimerization of MST2, which could further prevent the activity of MST2 by transautophosphorylation [30]. And the binding site could be referred from it. The LATS1 was docking employing our modeling structure mentioned above.
The screen result of four targets would be analyzed in a network to discover which compounds have effects on multiple targets.
2.4. Quantitative Structure–Activity Relationship (QSAR) Models and Predictive Work
The bioactivity was predicted through QSAR model [31]. The Genetic Function Approximation (GFA) algorithm [32], a method of searching for the optimal solution by simulating the natural evolutionary process, was utilized to look for the proper molecular descriptors and then used Calculate Molecular Property protocol to acquire relative properties in DS software. 2D-QSAR models were conducted through multiple linear regression (MLR) with Matlab and support vector machine (SVM) with libSVM. The way to evaluate these models was the value of square correlation coefficient (R2) which is calculated in the regression. Several molecules with known activity were used for external verification as well. The predictive models were chosen from the models which have high value of square correlation coefficient. And then the predictive models were performed to forecast each candidate drugs after docking.
The docking scores of candidates with CK2A2 were provided, as well as the docking score with other related proteins, mtHSP70, STK3, and LATS1. And the predicted activities or scores through several known compounds or traditional Chinese medicines about HD could also take a reference to the final drugs’ selection. Some proteins (CK2A2 and STK3) also provided a control for comparing.
Thirty-one known ligands [33] for CK2 protein with IC50 information constructed the predicted model by SVM and MLR algorithm. Thirty-five ligands [34] for meHSP70 protein with IC50 information conducted the predicted model as well. The STK3 and LATS1 protein constructed the predicted models through the reported TCM formula, and the active ingredients would be gathered in our TCM database. The aim was to build prediction module through SVM and MLR algorithm to predict better medicines from the clinical medicines models.
2.5. 3D-QSAR Analysis
3D-QSAR was constructed by known ligands [33] for CK2 protein with Sybyl-X 1.1. These active ligands were superimposed. The Comparative Molecular Field Analysis (CoMFA) [35] and Comparative molecular similarity index analysis (CoMSIA) [36] models were constructed according to their activity and structural characteristics. The models were evaluated through cross-validation (CV). Residual between the measured and predicted values was calculated and the square sum of explained (SSE); F-test, coefficient of determination (R2), and q2 for cross-validation were referred as evaluation indexes of 3D-QSAR models. CoMFA analyzes the effects of stereoscopic fields and electric fields, while CoMSIA evaluates stereoscopic fields, electric fields, hydrophobic fields, and hydrogen bonds for acceptors and donors. Various field combinations had been studied separately and the best model would be further studied.
2.6. Pharmacophore Analysis and Cross Validation
Pharmacophore models with 38 compounds [33, 37, 38] were created by hypoGen protocol, which was to analyze spatial influence factors such as hydrogen bonds acceptors, hydrophobic interactions, and π-conjugated effect. The models were verified through leave-one-out cross validation (LOOCV) [39]. Fisher’s randomization test was used to ensure that reliable hypotheses were built. To obtain a 95% confidence level, a total of 19 randomizations were required.
2.7. Molecular Dynamics Simulation (MDs)
In order to verify the results of docking screening, molecular dynamics simulations were performed on all candidate compounds screened above using gromacs5.0.4 program software with world’s top computing resources, Tianhe No. 2 supercomputer for long enough (5000 ns) simulation. The 5000 ns is basically the longest simulation in the current stage (2018). The energy minimization was produced by the steepest descent algorithm with the maximum number of 5000 steps minimization. The NVT equilibration was set in 20 ns with each step of 2fs and constrained with Lincs algorithm. The NPT equilibration was running after NVT in total of 20 ns. All bonds (even heavy atom-H bonds) were constrained with Lincs algorithm at 300K. The long time molecular dynasty was set in 5000 ns (for LATS1 protein nearly 3500 ns because of the computing resources). With the analysis of root-mean-square deviation (RMSD), root mean square fluctuation (RMSF), mean square displacement (MSD), secondary structure of protein, solvent accessible surface area (SASA), radius of Gyration (gyrate), the residue contact map (mdmat), Hydrogen bond distance (H-bond), energy analysis, and torsion angle, even the cluster research, the candidates will be validated to acquire a reasonable conclusion. After all, please be aware of short time MD simulation. Several candidates were “flying away” from protein during 5000 ns, even though they interacted well with targets at the first period.
3. Results
3.1. Protein-Protein Interactions Network Analysis
From the interaction information about the known targets, some high-related targets could be further confirmed in the research. The decreased expression level of YAP in human HD brains neurons was known [22]. Up-adjust YAP level can be the treatment method.
The hub node in the pathway was important and probably got more interactions with other related proteins. The proteins in the pathway were gathered; it showed the related proteins which could adjust (Figure 2). It could be certain clearly which agonists or inhibitors could be designed from it. The key proteins could be found in the pathway. Here four proteins, CK2A2, mtHSP70, mst2 (STK3), and LATS1 were identified as the targets for the further research.
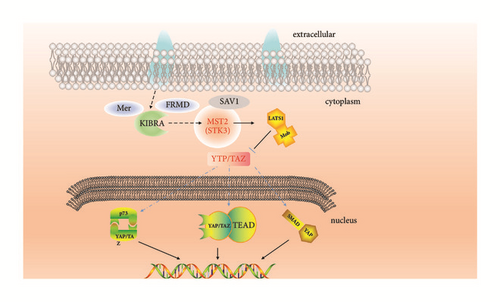
3.2. Modeling Structure Verification
The modeling structure of LATS1 was further verified by 3D-profile program and Ramachandran plot validation (Figure 3). The 3D-profile verify scores of the most of amino acids were higher than 0, especially the binding site region, which indicates the rationality of the modeling structure. The Ramachandran plot analysis showed whether each amino acid was in a reasonable angle, especially the amino acids of binding site displayed alone (Figure 3(d)).
3.3. QSAR Predicted Model
Appropriate descriptors were selected using the Genetic Function Approximation (GFA) algorithm (Table 1). And the descriptors would further be applied to create 2D QSAR model with support vector machines (SVM) and multiple linear regression (MLR) algorithm. The MLR model is built as follows.
| Model | r2 | r2 (adj) | r2 (pred) | RMS Residual Error | Friedman L.O.F. | S.O.R. F-value | S.O.R. p-value |
|---|---|---|---|---|---|---|---|
| pIC50_1 = 7.7375 − 0.37907 ∗ ES_Count_ssCH2 + 1.241 ∗ Num_Rings5 − 3.1053 ∗ CIC − 2.7227 ∗ JX − 0.045277 ∗ Jurs_PNSA_3 − 0.04508 ∗ Strain_Energy − 0.0033914 ∗ PMI_X + 0.77384 ∗ Shadow_Ylength | 0.8752 | 0.8299 | 0.7351 | 0.2877 | 0.4128 | 19.29 | 2.886e-008 |
| pIC50_2 = -2.9109 − 0.36552 ∗ ES_Count_ssCH2 + 1.3155 ∗ Num_Rings5 − 2.7949 ∗ JX + 12.751 ∗ SIC − 0.064703 ∗ Jurs_PNSA_3 + 0.0050522 ∗ Jurs_WNSA_2 − 0.047705 ∗ Strain_Energy + 0.55252 ∗ Shadow_Ylength | 0.8751 | 0.8296 | 0.7426 | 0.2879 | 0.4133 | 19.26 | 2.926e-008 |
| pIC50_3 = -3.4898 − 0.37365 ∗ ES_Count_ssCH2 + 1.3929 ∗ Num_Rings5 + 14.011 ∗ BIC − 2.4178 ∗ JX − 0.073379 ∗ Jurs_PNSA_3 + 0.006691 ∗ Jurs_WNSA_2 − 0.046048 ∗ Strain_Energy + 0.56523 ∗ Shadow_Ylength | 0.8747 | 0.8291 | 0.7400 | 0.2884 | 0.4146 | 19.19 | 3.026e-008 |
| pIC50_4 = -8.4336 − 0.37402 ∗ ES_Count_ssCH2 + 1.2103 ∗ Num_Rings5 − 2.1622 ∗ JX + 14.991 ∗ SIC − 0.044757 ∗ Jurs_PNSA_3 − 0.044286 ∗ Strain_Energy − 0.0039811 ∗ PMI_X + 0.80898 ∗ Shadow_Ylength | 0.8743 | 0.8286 | 0.7325 | 0.2888 | 0.4158 | 19.13 | 3.116e-008 |
- GFA algorithm is also constructed in other target proteins the same way.
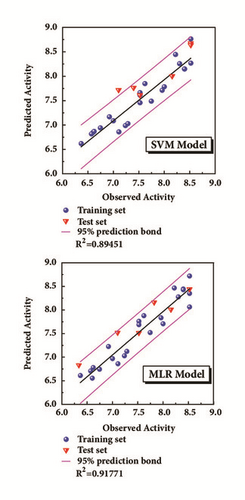
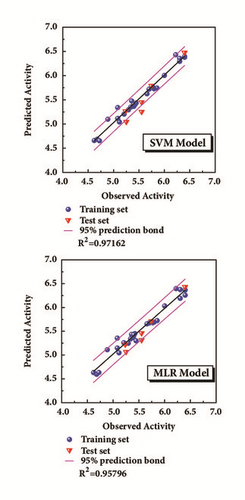
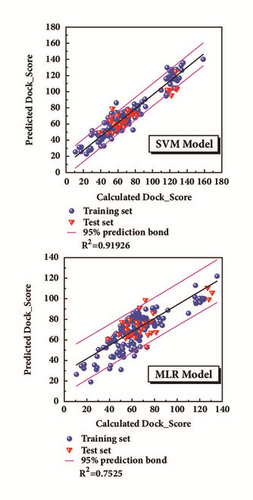
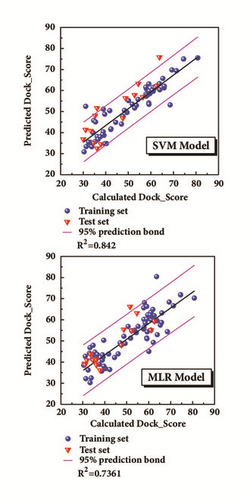
The model was regressed by the compounds from treatment drugs. Blue spheres represented the training set, and the red inverted triangle indicated the test set (Figure 4). External verification and R2 were reasonable.
3.4. 3D-QSAR Analysis
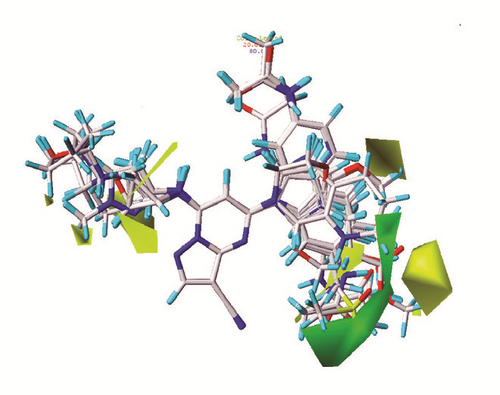
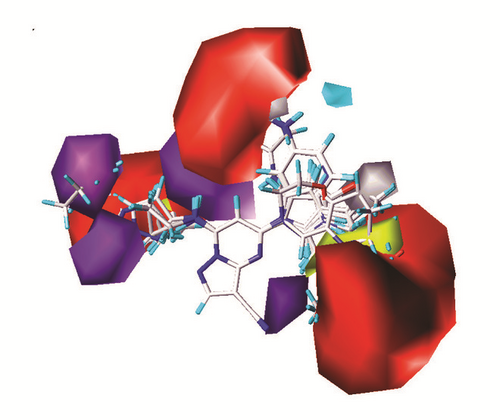
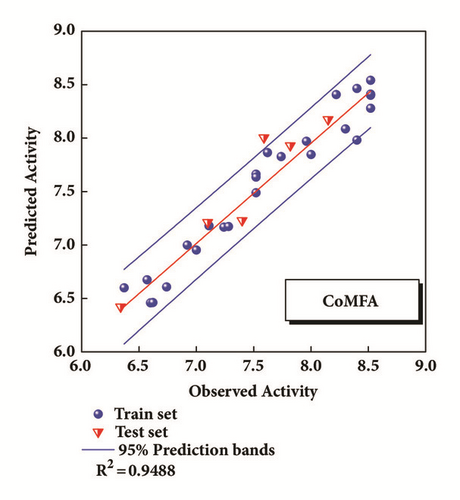
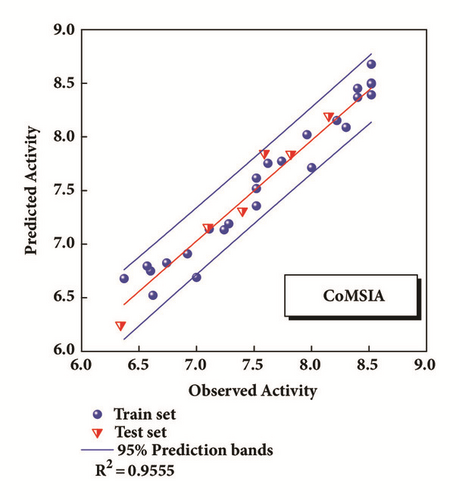
The CoMFA and CoMSIA models of 3D-QSAR were constructed (Figure 5). The value of CoMFA and CoMSIA was calculated further to obtain the predicted activity. And the residuals between observed IC50 and predicted IC50 would be one of the evaluation values of predictive ability (Table 2). Partial least squares (PLS) analysis and validation of CoMFA and CoMSIA model provided the value of correlation coefficient (R2), standard error of estimate (SEE), and F test (F ratio) for evaluating, as well as the cross validation () for assessing (Table 3). Large enough R2 and relatively small SEE could explain the rationality of the model. And greater than 0.5 were worth being considered. The information of several 3D-QSAR model CoMFA analysis reminded us where bulky substituent groups were needed (green area) and where no substituent groups were demand (yellow area) (Figure 5(a)). The CoMSIA model suggested what the hydrophobic groups (yellow area), hydrophilic groups (gray area), hydrogen bonds donors (cyan area), and hydrogen bonds acceptors (violet area) needed. Areas that were inappropriate for introducing hydrogen bond acceptors would be warned correspondingly (red area) (Figure 5(b)). External validations of the models were provided to identify its accuracy (Figures 5(c) and 5(d))
| Comp. | pIC50 | CoMFA | CoMSIA | ||||||
|---|---|---|---|---|---|---|---|---|---|
| Value | Pred∗ | Resid | D&A | S&E | Hy | Pred∗ | Resid | ||
| 1 | 7 | 80 | 6.953 | 0.047 | 1.97 | 4.11 | 2.49 | 6.691 | 0.309 |
| 2 | 6.74 | 84 | 6.609 | 0.131 | 1.97 | 4.38 | 4.01 | 6.825 | -0.085 |
| 3 | 7.24 | 98 | 7.168 | 0.072 | 1.97 | 4.67 | 3.64 | 7.135 | 0.105 |
| 4 | 6.37 | 84 | 6.6 | -0.23 | 1.97 | 4.39 | 4.50 | 6.679 | -0.309 |
| 5 | 6.34 | 102 | 6.422 | -0.082 | 1.75 | 4.73 | 2.62 | 6.247 | 0.093 |
| 6 | 7.11 | 118 | 7.18 | -0.07 | 1.75 | 5.24 | 3.78 | 7.141 | -0.031 |
| 7 | 7.28 | 124 | 7.174 | 0.106 | 1.75 | 5.43 | 4.15 | 7.19 | 0.09 |
| 8 | 6.6 | 112 | 6.46 | 0.14 | 1.75 | 5.20 | 2.77 | 6.751 | -0.151 |
| 9 | 8 | 130 | 7.847 | 0.153 | 2.86 | 5.86 | 4.02 | 7.713 | 0.287 |
| 10 | 7.59 | 130 | 8.004 | -0.414 | 2.82 | 5.75 | 3.52 | 7.847 | -0.257 |
| 11 | 8.52 | 132 | 8.28 | 0.24 | 2.81 | 5.76 | 3.83 | 8.393 | 0.127 |
| 12 | 8.4 | 140 | 8.465 | -0.065 | 2.63 | 5.92 | 3.67 | 8.369 | 0.031 |
| 13 | 6.57 | 144 | 6.675 | -0.105 | 3.02 | 6.05 | 3.82 | 6.796 | -0.226 |
| 14 | 6.62 | 150 | 6.462 | 0.158 | 3.23 | 6.16 | 3.62 | 6.524 | 0.096 |
| 15 | 7.1 | 140 | 7.212 | -0.112 | 2.86 | 6.05 | 4.16 | 7.158 | -0.058 |
| 16 | 7.62 | 134 | 7.865 | -0.245 | 2.86 | 6.03 | 4.37 | 7.754 | -0.134 |
| 17 | 8.4 | 138 | 7.982 | 0.418 | 3.45 | 5.92 | 4.55 | 8.453 | -0.053 |
| 18 | 7.52 | 150 | 7.49 | 0.03 | 3.41 | 6.16 | 4.28 | 7.519 | 0.001 |
| 19 | 7.52 | 148 | 7.664 | -0.144 | 3.67 | 6.26 | 4.99 | 7.358 | 0.162 |
| 20 | 7.4 | 164 | 7.229 | 0.171 | 2.89 | 6.56 | 4.97 | 7.31 | 0.09 |
| 21 | 7.52 | 164 | 7.636 | -0.116 | 2.89 | 6.41 | 4.36 | 7.616 | -0.096 |
| 22 | 7.74 | 170 | 7.828 | -0.088 | 2.89 | 6.72 | 4.81 | 7.774 | -0.034 |
| 23 | 7.96 | 146 | 7.971 | -0.011 | 2.54 | 6.04 | 4.01 | 8.022 | -0.062 |
| 24 | 6.92 | 130 | 6.999 | -0.079 | 2.64 | 5.60 | 3.69 | 6.911 | 0.009 |
| 25 | 8.15 | 144 | 8.174 | -0.024 | 3.32 | 5.98 | 5.26 | 8.195 | -0.045 |
| 26 | 8.22 | 146 | 8.408 | -0.188 | 2.82 | 6.00 | 3.93 | 8.154 | 0.066 |
| 27 | 8.3 | 136 | 8.087 | 0.213 | 2.82 | 5.81 | 3.84 | 8.089 | 0.211 |
| 28 | 8.52 | 158 | 8.542 | -0.022 | 3.39 | 6.25 | 4.55 | 8.503 | 0.017 |
| 29 | 8.52 | 170 | 8.401 | 0.119 | 3.40 | 6.42 | 4.53 | 8.678 | -0.158 |
| 30 | 7.82 | 170 | 7.931 | -0.111 | 3.36 | 6.51 | 4.39 | 7.841 | -0.021 |
| 31 | 8.52 | 158 | 8.412 | 0.108 | 3.67 | 6.37 | 4.29 | 8.495 | 0.025 |
- ∗pred: predicted pIC50.
- Resid: residual.
- S: steric.
- Hy: hydrophobic.
- D: hydrogen bond donor.
- A: hydrogen bond acceptor.
- E: electronic effect.
| Parameter |
|
ONC | r2 | SEE | F ratio |
|---|---|---|---|---|---|
| CoMFA∗ | 0.536 | 6 | 0.941 | 0.189 | 64.014 |
| CoMSIA | |||||
| S | 0.469 | 6 | 0.858 | 0.294 | 24.072 |
| H | 0.513 | 5 | 0.915 | 0.221 | 53.863 |
| D | 0.525 | 6 | 0.748 | 0.391 | 11.886 |
| A | 0.477 | 10 | 0.864 | 0.315 | 12.741 |
| S+H | 0.501 | 5 | 0.925 | 0.209 | 61.907 |
| S+D | 0.545 | 6 | 0.854 | 0.298 | 23.397 |
| S+A | 0.471 | 6 | 0.906 | 0.239 | 38.434 |
| H+D | 0.557 | 6 | 0.952 | 0.171 | 79.12 |
| H+A | 0.527 | 5 | 0.913 | 0.225 | 52.684 |
| D+A | 0.509 | 4 | 0.854 | 0.286 | 38.084 |
| S+H+D∗ | 0.564 | 6 | 0.955 | 0.166 | 84.237 |
| S+H+A | 0.505 | 8 | 0.967 | 0.141 | 118.495 |
| S+D+A | 0.529 | 5 | 0.882 | 0.262 | 37.55 |
| H+D+A | 0.521 | 6 | 0.957 | 0.161 | 89.404 |
| S+H+D+A | 0.534 | 6 | 0.957 | 0.162 | 89.264 |
- ∗Selected model.
- : correlation coefficient (cross-validation).
- r2: correlation coefficient (non-cross-validation).
- ONC: optimal number of components.
- SEE: standard error of estimate.
- F ratio: F-test value.
- S: steric.
- H: hydrophobic.
- D: hydrogen bond donor.
- A: hydrogen bond acceptor.
- Filed proportion (S+H+D+A): S: 10.1%; H: 36.3%; D: 21.1%; A: 32.5%.
3.5. Pharmacophore Analysis and Cross-Validation
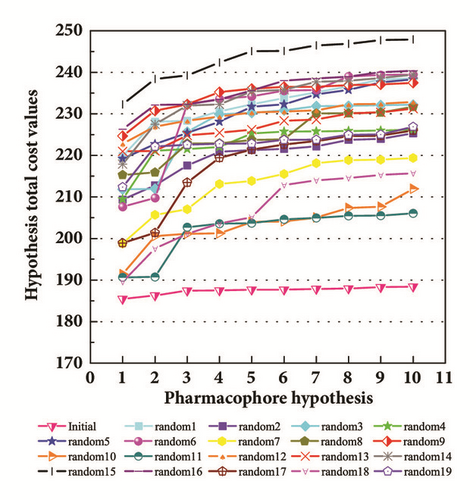
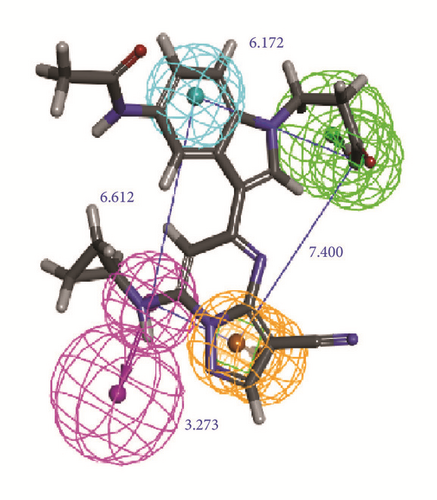
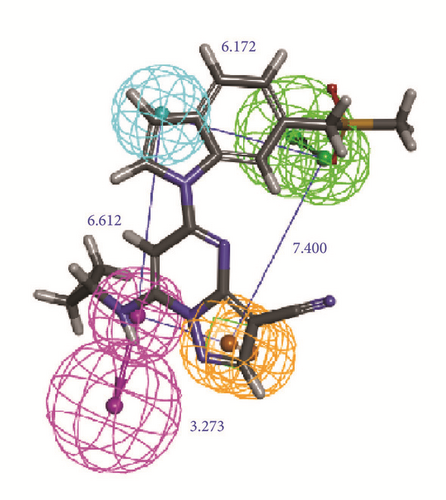
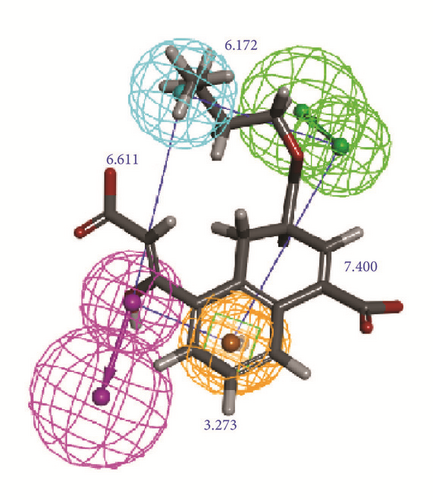
The activity predicts model would be verified with cross-validation. The leave one out cross-validation (LOOCV) was used to illustrate the reliability of the model. The information of 10 hypoGen models was shared (Table 4). Cat-Scramble suggested the accuracy of pharmacophore model. The total cost values of 19 random hypotheses were all higher than the initial spreadsheet (Figure 6). The difference between null cost and total cost was vital to assess the confidence of the model. Configuration cost value was 15.59 lower than 17 which at a reasonable interval. Pharmacophore Analysis further evaluated the candidates; compounds 1a and 1b nearly matched all spatial factors (Figure 7).
| Hypothesis | Total cost | Correlation | Error | RMS | Feature b |
|---|---|---|---|---|---|
| Hypo 1 | 185.455 | 0.7584 | 168.342 | 1.62 | HBA,HBD,HY,RING |
| Hypo 2 | 186.266 | 0.7513 | 169.514 | 1.64 | HBA,HBD |
| Hypo 3 | 187.455 | 0.7463 | 170.365 | 1.655 | HBA,HBD,HY |
| Hypo 4 | 187.478 | 0.7457 | 170.459 | 1.656 | HBA,HBD,HY,RING |
| Hypo 5 | 187.622 | 0.743 | 170.899 | 1.663 | HBA,HBD,HY |
| Hypo 6 | 187.69 | 0.7454 | 170.518 | 1.657 | HBA,HBD,HY,RING |
| Hypo 7 | 187.872 | 0.7434 | 170.854 | 1.663 | HBA,HBD |
| Hypo 8 | 187.973 | 0.7488 | 169.985 | 1.648 | HBA,HBD,HY,RING |
| Hypo 9 | 188.302 | 0.7432 | 170.898 | 1.663 | HBA,HBD,HY,RING |
| Hypo 10 | 188.414 | 0.7421 | 171.08 | 1.667 | HBA,HBD,HY,RING |
- a. Cost value: Null cost = 232.267, Fix cost = 137.8, and configure cost = 15.5857.
- b. Feature description: HBA, HBD, HY, and RING indicate hydrogen bond acceptor, hydrogen bond donor, hydrophobic, and Ring aromatic, respectively.

3.6. Dock Screening Result and Candidate Determination
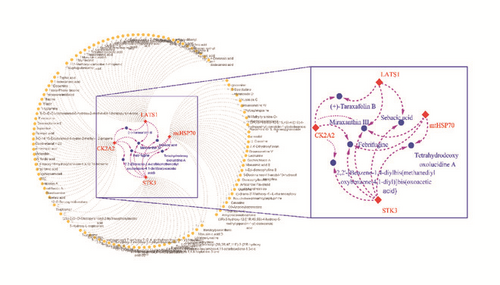
Top 50 compounds in each target were created in a network to suggest the multitarget effect (Figure 8). The screening rules the vote score based on the docking scores, SVM and MLR predicted activity, and consensus scores (calculated from 11 scores). For example, top 20 percent of each project was set as efficient and scored 1 point, otherwise 0 point. The total score was set as final evaluation (Table 5). The screening result for CK2A2 and mtHSP70 was displayed in Table 6, while the STK3 and LATS1 were shown in Table 7.
| Compound name | DOCK SCORE | SVM | MLR | Consensus Score | Total Score | |||
|---|---|---|---|---|---|---|---|---|
| pIC | Vote | pIC | Vote | CS | Vote | |||
| 50 | 50 | |||||||
| ∗Miraxanthin III | 114.346 | 7.08 | 0 | 8.45 | 1 | 4 | 1 | 2 |
| ∗flazine | 96.004 | 7.98 | 1 | 4.63 | 0 | 4 | 1 | 2 |
| ∗Typhic acid | 97.811 | 7.08 | 0 | 5.01 | 0 | 7 | 1 | 1 |
| ∗7FC(control) | 108.017 | 7.06 | 0 | 6.52 | 1 | 7 | 1 | 2 |
| 2,2′-[Benzene-1,4-diylbis | 96.297 | 7.08 | 0 | 5.94 | 0 | 7 | 1 | 1 |
| (methanediyloxybenzene-4 | ||||||||
| 1-diyl)]bis(oxoacetic acid) | ||||||||
| Tryptophan | 96.459 | 7.42 | 1 | 5.94 | 0 | 1 | 0 | 1 |
| Nodifloridin A | 109.704 | 7.06 | 0 | 4.78 | 0 | 6 | 1 | 1 |
| 3-O-14,15-Eicosylenoyl-1-cyano-2-methyl-1,2-propene | 101.287 | 7.08 | 0 | 4.36 | 0 | 5 | 1 | 1 |
| Melandrin | 102.897 | 6.21 | 0 | 6.14 | 1 | 3 | 0 | 1 |
| dopamine | 100.157 | 6.93 | 0 | 6.02 | 1 | 1 | 0 | 1 |
| Fritillebeinol | 97.4 | 7.16 | 0 | 5.96 | 1 | 1 | 0 | 1 |
| Tryptamine | 97.061 | 7.33 | 1 | 4.61 | 0 | 1 | 0 | 1 |
| Evocarpine | 99.54 | 7.63 | 1 | 4.23 | 0 | 1 | 0 | 1 |
| (2S)-2-O--D-Glucopyranosyl-2-hydro-xyphenylacetic acid | 98.628 | 7.34 | 1 | 3.80 | 0 | 1 | 0 | 1 |
| 5-Hydroxy-L-tryptophan | 99.271 | 7.49 | 1 | 3.29 | 0 | 1 | 0 | 1 |
| 8-O--D-Glucopyranosyl-6-hydroxy | 98.707 | 7.30 | 1 | 3.20 | 0 | 1 | 0 | 1 |
| -2-methyl-4H-1-benzopyran-4-one | ||||||||
| 1,4-Epoxy-16-hydroxy- | 104.582 | 6.53 | 0 | 3.82 | 0 | 3 | 0 | 0 |
| heneicos-1,3,12,14-tetraene | ||||||||
| Desmodianone E | 100.083 | 6.19 | 0 | 2.62 | 0 | 2 | 0 | 0 |
| Combretastatin D3 | 101.461 | 6.00 | 0 | 4.13 | 0 | 1 | 0 | 0 |
| GoshuyuamideII | 107.088 | 6.90 | 0 | 3.81 | 0 | 1 | 0 | 0 |
- ∗Selected compounds after screening
| Compound name | DOCK SCORE | SVM | MLR | Consensus | Total Score | |||
|---|---|---|---|---|---|---|---|---|
| pIC | Vote | pIC | Vote | CS | Vote | |||
| 50 | 50 | |||||||
| Miraxanthin | ||||||||
| III | 114.346 | 7.08 | 0 | 8.45 | 1 | 4 | 1 | 2 |
| Flazine | 96.004 | 7.98 | 1 | 4.63 | 0 | 4 | 1 | 2 |
| Typhic acid | 97.811 | 7.08 | 0 | 5.01 | 0 | 7 | 1 | 1 |
| 7FC(control) | 108.017 | 7.06 | 0 | 6.52 | 1 | 7 | 1 | 2 |
| Tetrahydrodeox | ||||||||
| -yoxolucidine A | 119.845 | 6.88 | 1 | 6.10 | 1 | 3 | 1 | 3 |
| Febrifugine | 107.889 | 6.87 | 1 | 6.93 | 1 | 3 | 1 | 3 |
| Holantosine C | 162.286 | 6.86 | 1 | 6.45 | 1 | 2 | 0 | 2 |
| Cassaine | 109.044 | 6.86 | 1 | 7.39 | 1 | 2 | 0 | 2 |
| Compound name | DOCK_SCORE | SVM predicted score | MLR predicted score | Con-sensus score |
|---|---|---|---|---|
| Nazlinin a | 158.538 | 140.18 | 108.541 | 1 |
|
133.038 | 132.538 | 83.646 | 3 |
| Febrifugine a | 127.99 | 104.625 | 95.46 | 4 |
| ANP(control) a | 109.987 | 102.144 | 85.874 | 5 |
| Miraxanthin III b | 71.273 | 69.4458 | 66.639 | 4 |
| Labiatic acid b | 60.03 | 69.8435 | 45.035 | 6 |
| 7-Methoxy-β-carboline-1-Propionic acid b | 68.524 | 53.2091 | 64.378 | 5 |
| (+)-Taraxafolin B b | 65.96 | 62.1113 | 63.304 | 3 |
- a. Top candidates of STK3 protein.
- b. Top candidates of LATS1 protein.
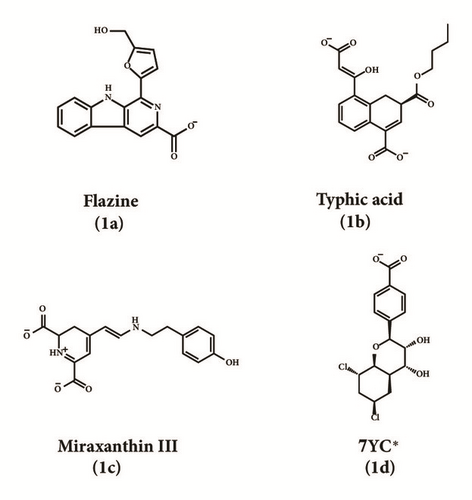
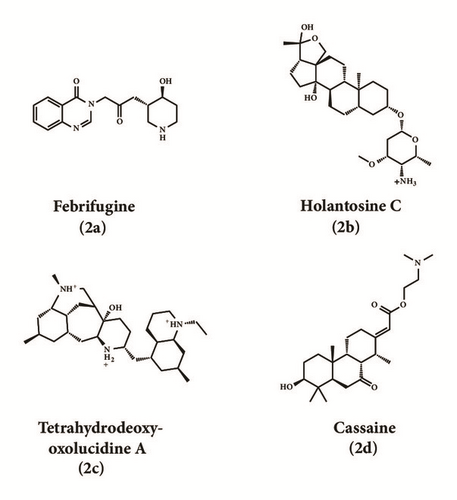
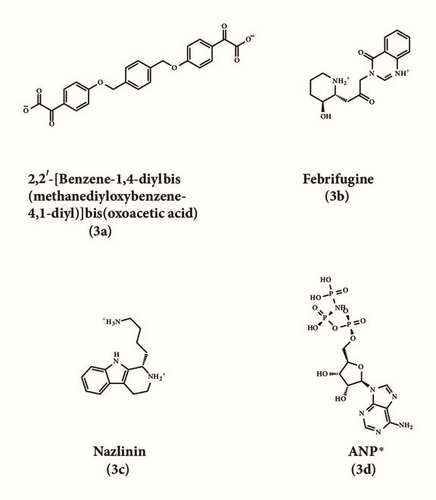
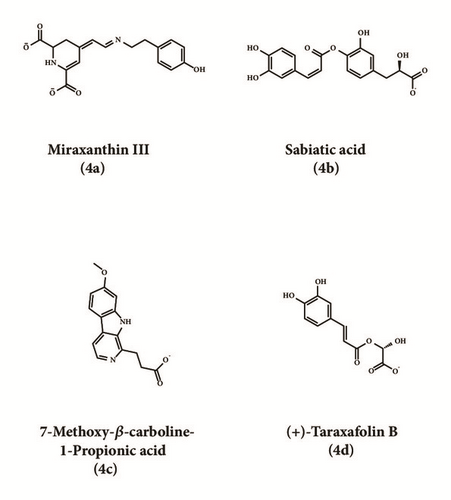
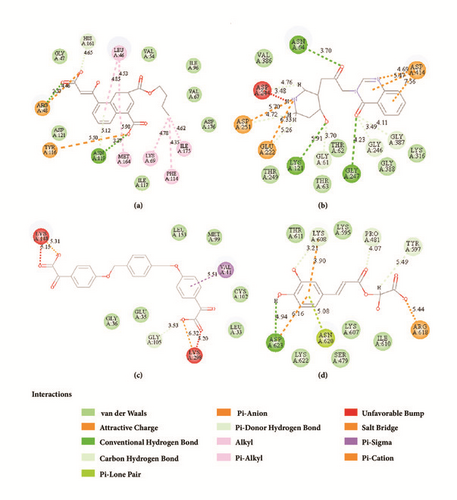
2D structure of candidate compounds was displayed in Figure 9. The hydrogen bonds, hydrophobic bonds, etc. were displayed to suggest potential poses of ligands and receptors (Table 8); especially several residues binding with all ligands would be focused on. The hydrogen bonding was a significant reference for these binding analyses of combining ability. 2D diagram for different targets was shown in the interaction bonds between key residues and ligands. Van der Waals force, hydrogen bonds, salt bridge, attractive charges, pi-interaction, etc. displayed the binding potentials (Figure 10). The bond length (Å) was considered as the index of stability. Unfavorable bumps prompted space conflict that is not recommended for introduction (red callout). Probably it was a result that the ligand 3a-STK3 was not stable during MD period.
| Protein | Candidates | Residues | |||||||||||||
|---|---|---|---|---|---|---|---|---|---|---|---|---|---|---|---|
| CK2A2 | L46 | G47 | R48 | V54 | V67 | K69 | F114 | Y116 | N119 | H161 | M164 | L175 | |||
| Flazine | Hb | H | E;H | Hb | Hb | - | - | - | Hb | - | Hb | Hb | |||
| Typhic Acid | Hb | - | E;Hb;H | - | - | Hb | Hb | - | H | H | Hb | Hb | |||
| mtHSP70 | D59 | G61 | N64 | T86 | K121 | E222 | D244 | G246 | G247 | D251 | E313 | K316 | G387 | D414 | |
| Febrifugine | - | H | H | - | H | E;H | H | H | H | E;H | - | - | H | E | |
| Holantosine C | H | - | - | - | - | E;H | - | H | H | E | - | - | - | - | |
| Cassaine | - | - | - | H | - | E;H | E;H | H | H | E | H | H | - | - | |
| STK3 | G36 | S37 | Y38 | V41 | K56 | E70 | G105 | K148 | L153 | D164 | K298 | ||||
|
- | - | - | Hb | - | - | H;E | H;E | - | E | E | ||||
| anediyloxybenzene-4,1-diyl)]- | |||||||||||||||
| bis(oxoacetic acid) | |||||||||||||||
| Control | H | H | H | Hb | H | E | - | - | Hb | E;H | - | ||||
| LATS1 | P481 | Y597 | K608 | R618 | N620 | D623 | |||||||||
| (+)-Taraxafolin B | H | H | H;E | H;E | P | H;E | |||||||||
- ∗H: H-bond, E: electrostatic interaction, and Hb: hydrophobic interaction.
3.7. MD Analysis
MD results were analyzed in the Gromacs5.0.4 program.
Trajectory files obtained after MD were made as videos (supported video set (available here)) for observing and displaying. They were convenient for our research by improving intuitive information. Total energy and RMSD changes (include proteins and ligands) were provided to analyze whether the receptor-ligand interaction in a proper state (Figure 11). During the MD period, the CK2A2-Flazine (1a), CK2A2-Typhic Acid (1b), mtHSP70-Febrifugine (2a), mtHSP70-Holantosine C (2b), mtHSP70-Cassaine (2d), STK3-3a, STK3-ANP (Control), and LATS1- (+)-Taraxafolin B (4d) were tested whether interactions well for a long time. Most of the complex possessed nonfluctuating total energy, even if the protein interacted with different ligands. Total energy of CK2A2 protein-ligand complex stand at nearly -860000~-850000 kJ/mol, while mtHSP70 was -1175000~-1170000kJ/mol, STK3 was -1550000~-1545000 kJ/mol, and LATS1 was -2600000~-2590000kJ/mol. It was noteworthy that the energy of STK3-control was lower compared to other ligands, which indicates the control complex stayed at a more stable state. Changes in RMSD suggested that the interactions changed in configuration. It was more concerned whether the RMSD is stable at the end period of MD. Ligand RMSD of STK3-control and LATS1-4d fluctuated obviously during MD; nevertheless, both of them did not infect the total energy or protein RMSD; the former probably changed posture at 3500 ns (Figure 11).
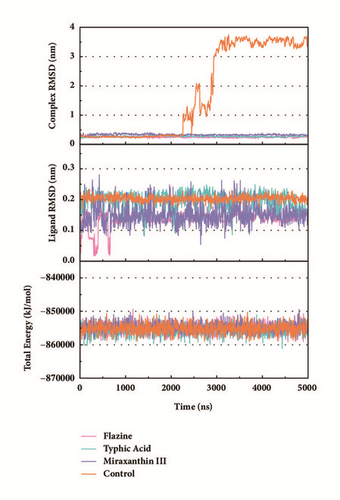
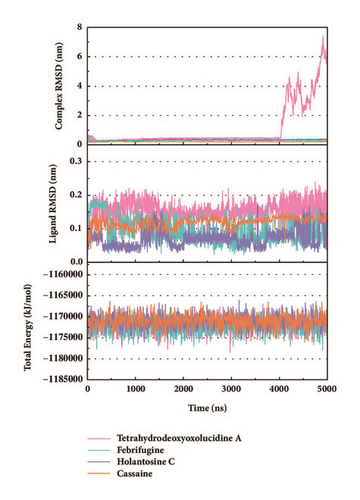
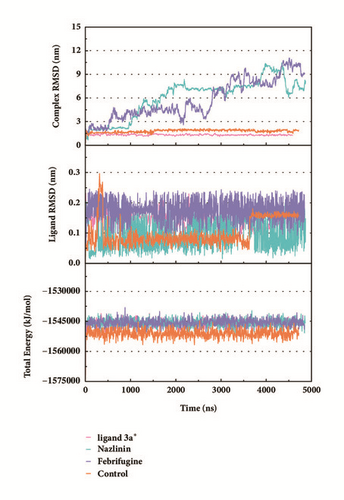
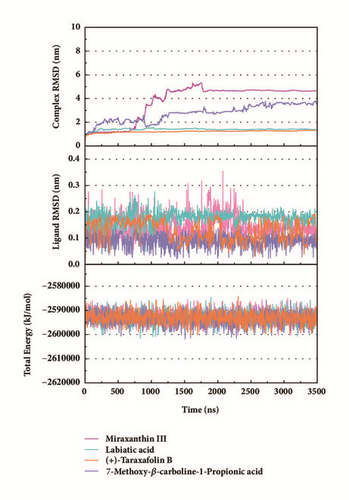
The mean square displacement (MSD), solvent accessible surface area (SASA), and Radius of Gyration (gyrate) analysis provided the information about both protein and ligand during MD (Figures 12 and 13). Gyrate shows the more bulky the molecule, the smaller the value and the closer the molecules. In general, gyrate presents a downward trend. And for the STK3 protein STK3-control and STK-3a (red line) all displayed high gyrate, which indicate that the ligand induced fit to the protein and the protein maintain a bigger open binding site (Figure 12(c)). For mtHSP70 protein (Figure 12(b)), the opposite is true; when the protein was in a bulky state, the ligands easily “fly away”; when the protein was tighter, the ligand could get better stay inside. MSD analysis told us the protein change between the original state and simulation state. It was clearly which ligand “fly away”. The value of MSD was logarithmic transformation: YMSD=2+log10 (MSD). In fact, several proteins remain changing at the end of simulation, even if we simulate very long time. SASA analysis could help us understand the hydrophobic nature and protein surface state. SASA of CK2A2 was little difference when combined with different ligands as well as LATS1 protein (Figures 12(a) and 12(d)). SASA of STK3 protein (Figure 12(c)) displayed higher hydrophilic when complex with ligand (red line and orange line); it was related to its bulky structure predictably.
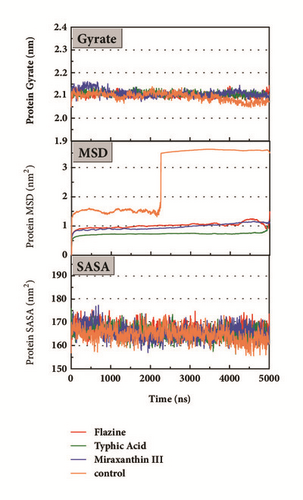
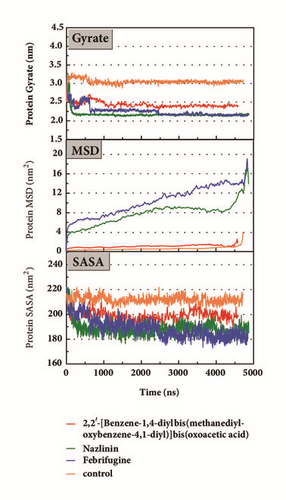
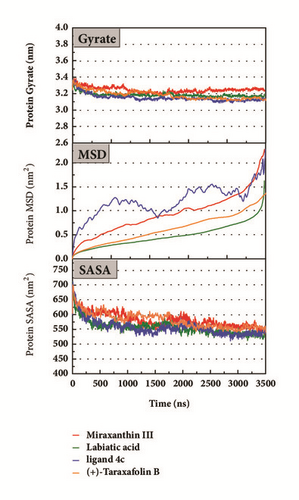
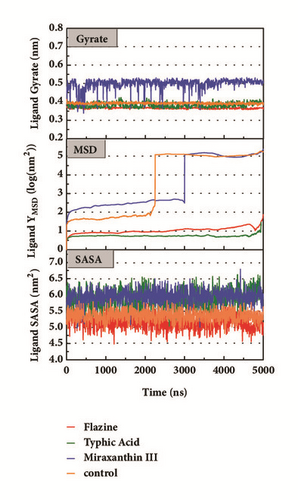
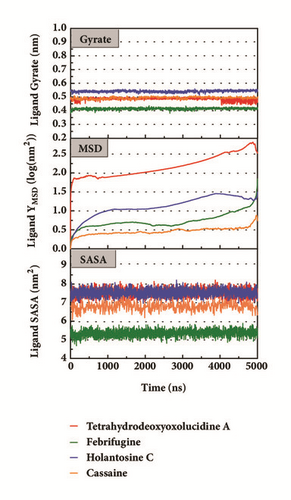
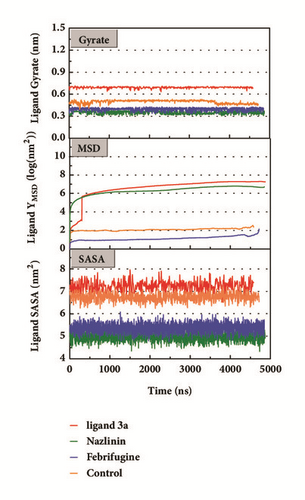
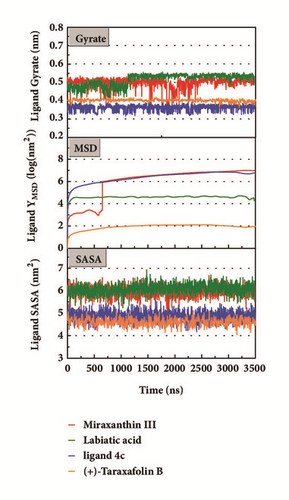
Mean square displacement (MSD), solvent accessible surface area (SASA), and Radius of Gyration (gyrate) analysis of each ligand showed in Figure 13. The ligands’ staying with protein complexes during MD would be focused. Ligand gyrate was stable in general. The ligand MSD revealed the ligand change during MD; as for STK3 protein, the ligand 3a (red line) increased at 4000 ns; it was consistent with gyrate drop, which indicates structure contraction at that time. SASA of ligands change little at MD period. One interesting condition is for STK3 protein (Figure 13(c)), where the SASA value of the ligands complex with protein (red line and orange line) was higher than other “fly away” ligands (blue line and green line); probably the bulk protein structure provides more chance for inside ligands to contact with water.
Nonbond relationship provided the binding information between the ligands and receptors; it was an important reference for drug design (Table 8). For example, it told us the Residue R48 of CK2A2 kept the H-bond, electrostatic interaction, and hydrophobic interaction. As the same, E222 of mtHSP70, D164 of STK3, and R618 of LATS1 can be significant for maintaining interaction effect.
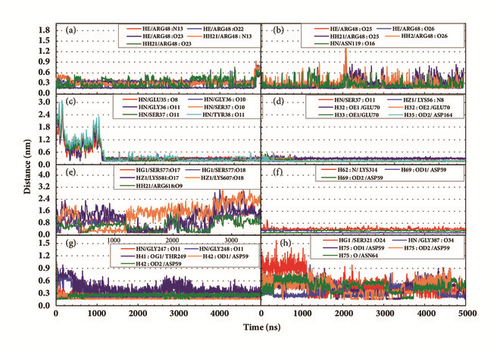
Hydrogen bond distance analysis was vital to explain the interaction between targets and proteins. The variation of main H-bond was observed to interpret the stability of receptor-ligand complexes (Figure 14). And the H-bond distance and the occupancy were showed to explain whether these H-bonds were in a proper distances (Table 9). The H-bond occupancy of STK3-control and mtHSP70-Febrifugine was kept high which can predict a good interaction for these complexes. As for LATS1 protein, unfortunately low H-bond occupancy indicated the ligand may leave even if we have not yet observed (Figure 14(e)). The H-bond information informed the significant residues. ARG48 and ASN119 of CK2A2 were great for maintaining complex interactions. ASP59, Gly247, Gly248, and Gly387 of mtHSP70 protein mainly built hydrogen bonds. As for STK3 protein, different ligands bound with different residues of protein (Figures 14(c) and 14(d)), the different interaction mode can be validated in further poses analysis. The observations for LATS1-4d were worrying, which had no stable hydrogen bond.
| H-bond | Occupancy | Maximum (nm) | Minimum (nm) | H-bond | Occupancy | Maximum (nm) | Minimum (nm) |
|---|---|---|---|---|---|---|---|
| CK2-Flazine | CK2-Typhic Acid | ||||||
| HE/ARG48:N13 | 0.647 | 0.931 | 0.222 | HE/ARG48:O25 | 0.796 | 1.254 | 0.156 |
| HE/ARG48:O22 | 0.564 | 0.894 | 0.151 | HE/ARG48:O26 | 0.838 | 1.437 | 0.150 |
| HE/ARG48:O23 | 0.731 | 0.679 | 0.151 | HH21/ARG48:O25 | 0.697 | 1.323 | 0.148 |
| HH21/ARG48: N13 | 0.783 | 0.891 | 0.190 | HH21/ARG48:O26 | 0.759 | 1.519 | 0.149 |
| HH21/ARG48:O23 | 0.606 | 0.765 | 0.156 | HN/ASN119:O16 | 0.848 | 0.883 | 0.158 |
|
STK3-Control | ||||||
| HN/GLU35:O8 | 0.627 | 2.441 | 0.177 | HN/SER37:O11 | 0.964 | 0.452 | 0.154 |
| HN/GLY36:O10 | 0.739 | 2.937 | 0.154 | HZ1/LYS56:N8 | 0.919 | 0.559 | 0.220 |
| HN/GLY36:O11 | 0.743 | 2.928 | 0.158 | H32:OE1/GLU70 | 0.993 | 0.490 | 0.150 |
| HN/SER37:O10 | 0.752 | 2.962 | 0.156 | H32:OE2/GLU70 | 0.994 | 0.403 | 0.145 |
| HN/SER37:O11 | 0.747 | 2.976 | 0.154 | H33:OE1/GLU70 | 0.992 | 0.542 | 0.139 |
| HN/TYR38:O11 | 0.621 | 3.100 | 0.159 | H35:OD2/ASP164 | 0.984 | 0.531 | 0.151 |
| LATS1-(+)-Taraxafolin B | mtHSP70-Cassaine | ||||||
| HG1/SER577:O17 | 0.181 | 2.211 | 0.155 | H62: N/LYS314 | 0.063 | 1.016 | 0.257 |
| HG1/SER577:O18 | 0.194 | 2.051 | 0.156 | H69: OD1/ASP59 | 0.596 | 0.562 | 0.144 |
| HZ1/LYS581:O17 | 0.168 | 3.049 | 0.150 | H69: OD2/ASP59 | 0.596 | 0.426 | 0.148 |
| HZ1/LYS607:O18 | 0.158 | 3.026 | 0.152 | ||||
| HH21/ARG618:O9 | 0.241 | 1.473 | 0.167 | ||||
| mtHSP70-Febrifugine | mtHSP70-Holantosine C | ||||||
| HN/GLY247: O11 | 0.852 | 0.800 | 0.156 | HG1/SER321:O24 | 0.313 | 1.569 | 0.167 |
| HN/GLY248: O11 | 0.740 | 1.009 | 0.169 | HN/GLY387:O34 | 0.617 | 0.781 | 0.185 |
| H41:OG1/THR249 | 0.448 | 0.982 | 0.160 | H75:OD1/ASP59 | 0.253 | 0.984 | 0.148 |
| H42:OD1/ASP59 | 0.997 | 0.990 | 0.143 | H75:OD2/ASP59 | 0.274 | 0.903 | 0.146 |
| H42:OD2/ASP59 | 0.997 | 0.849 | 0.147 | H75:O/ASN64 | 0.201 | 0.786 | 0.159 |
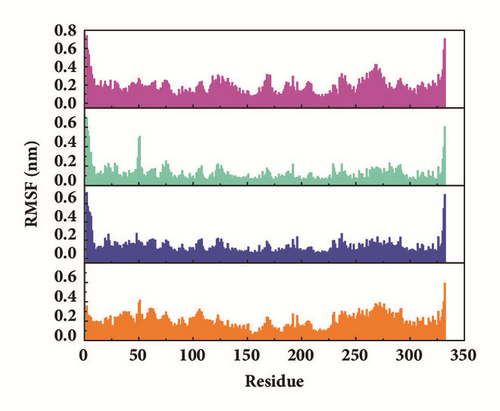
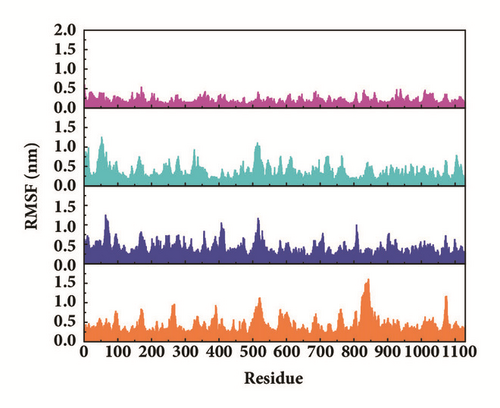
Root mean square fluctuation (RMSF) can be used to test fluctuation of each residue, which can notify the key residues change during MD. The key residues contributed nonbond interaction which would mainly be focused on. CK2A2 complexes had similar residue fluctuations (Figure 15(a)), which correspondingly showed similar average protein structure (Figure 16). Residues fluctuation of mtHSP70 complexes displayed similar trend, which have the same fluctuation peaks and valleys. The difference between these complexes was the different degrees of change (Figure 15(b)). The only one ligand “fly away” (pink line) had different types of fluctuations, which further verified the role of ligands. As for STK3 protein (Figure 15(c)), ligand 3a (pink line) and control (orange line) displayed different changes mainly due to the loop area outside, which showed in different average structure (Figure 16). The change of LATS1 complexes was more complex due to a lot of residues, but it could be clearly that the fluctuation of key residues like P481, Y597, K608, and R618 influenced the binding interaction.
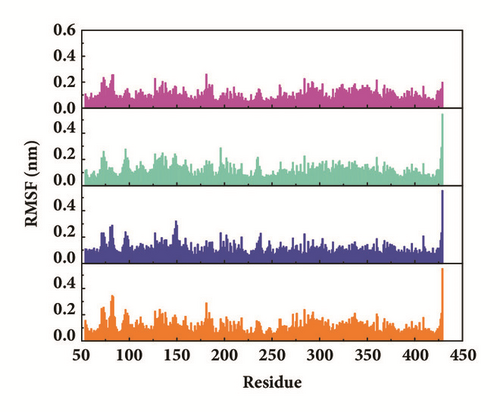
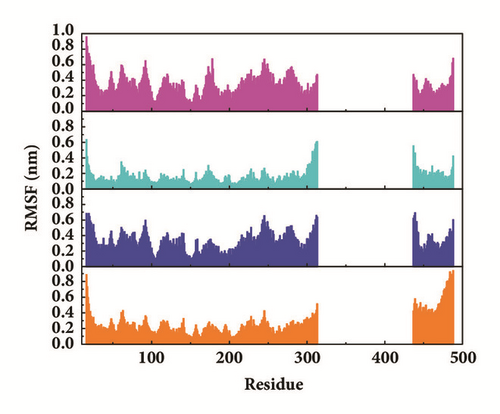
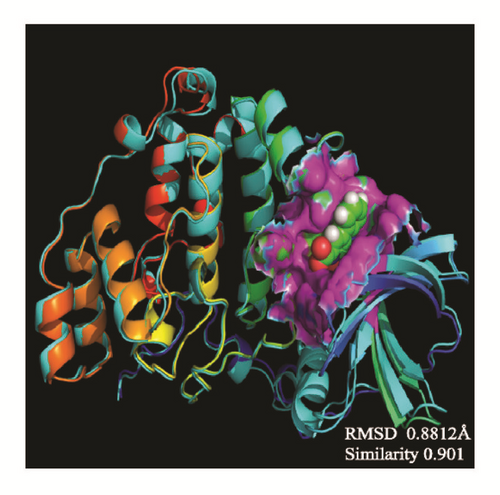
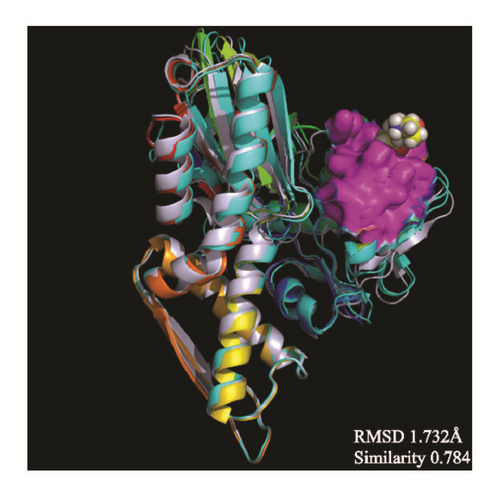

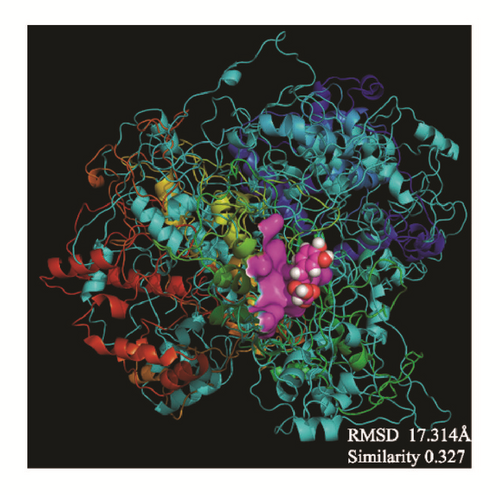
The average protein structures would be superimposed to observe whether the binding structures are alike, which can predict these structures related to their inhibition. CK2A2 and mtHSP70 were nearly superimposed on one structure, respectively. STK3 can be superimposed except the outside loop. The two LATS1 protein structures cannot merge into one because one ligand of structure “flies away”. It manifested the structure which acting with ligand was completely different from the origin protein (Figure 16).
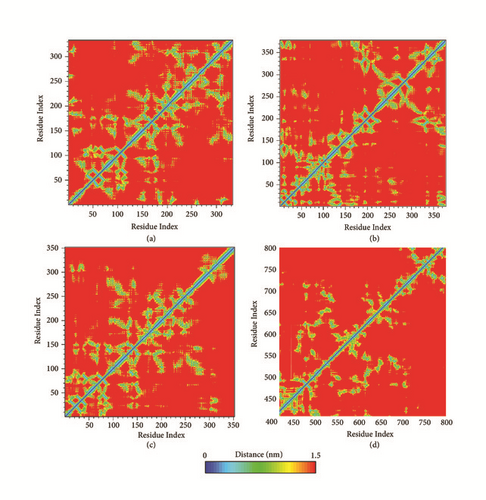
The protein residues contact map provided 3D information about the residues distance of proteins in 2D matrix. Average amino acid distance was shown in different color, which indicates the looseness of protein. The distance between key residues was focused on. It demonstrated a tight conformation for SK2A2 protein. The key amino acids R48 and N119 of CK2A2 are all close to other residue that can construct a “hotspot” cavity. Similarly, key residues D59, G247, etc. of mtHSP70 constitute an active cavity site. The amino acids S37, K56, E70, and D164 of STK3 are also in a reasonable range. Different ligands for CK2A2 or mtHSP70 protein would get similar 3D structure shown in residues distance matrix, respectively, which further validate our inference above.
Secondary structure of protein provided important information on structural stability. Maintaining A-helix and β-sheet during MD period can keep structural stability. Basically secondary structure was stable, including the key residues. A change was observed like residue 176-181 of mtHSP70-Febrifugine since 3000 ns, where A-helix changed to β-turn. It is possible that complex structure changes to a more stable configuration since this moment influenced by the ligand (Figure 17).
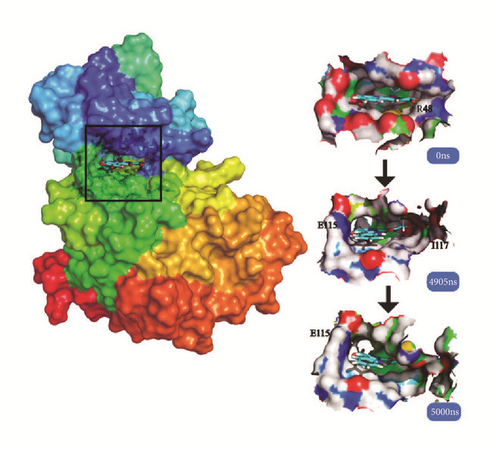
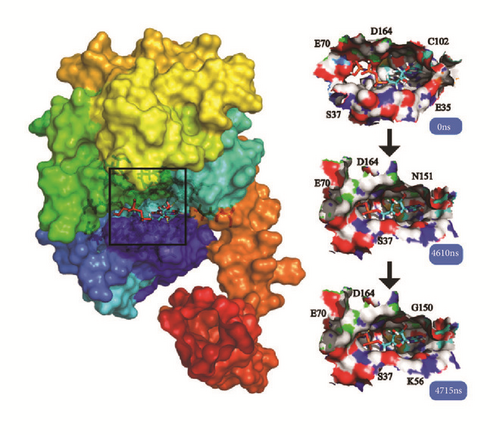
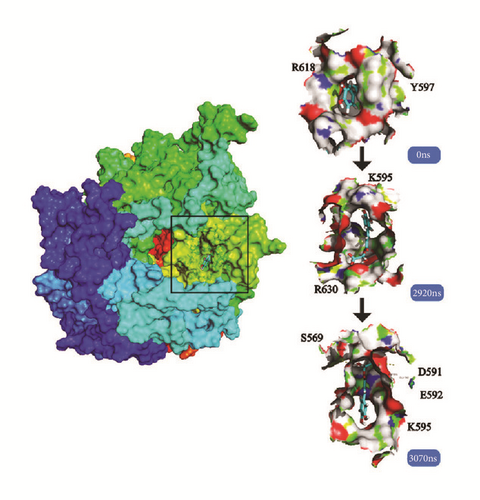
Cluster analysis was taken for each complex at the last period. The dock poses, cluster poses during the last 500 ns period, and the last poses were provided (Figure 18). Cluster poses were got from the big class of cluster map. The poses between dock and the last were changed in some complex like LATS-ligand; in the large cavity of the action site, the ligand is completely steered, showing another way of acting. The CK2A2 and mtHSP70 were relatively fixed. And the H-bond relationship was shown which could clearly know the interaction modes of key residues like Asp59, Glu222, Asp 244 in the mtHSP70, etc. For the same receptor, different ligand employed different residual contributions; however, the common force mode between different complexes could help us find the key residues like Asp48 and Asn119 in the CK2A2 protein.

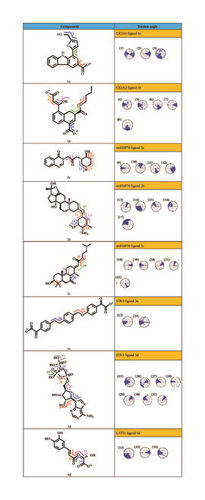
The change in the torsion angle provides important clues to the stability of hydrogen bonds. If a single key that can be rotated originally is fixed in a relatively small range of variation, it may be fixed by space or electrically fixed. Relatively speaking, finding its related hydrogen bonds also shows that the hydrogen bonds are relatively stable (Figure 19). Torsion 1 showed 180 degrees of twist, but in fact two O elements on the carboxyl were equivalent when carboxyl dissociates; hydrogen bonds which could form after 180-degree rotation were still equivalent to origin hydrogen bond; what is certain was that this was a weak hydrogen bond. Torsion 2 had a great influence on the overall conformation of the ligand molecule connecting two planes, which showed rotation of furan ring plane; its orientation can bring hydrogen bonding or hydrophobic interaction; approximately 30 degrees of change is relatively stable to conform a H-bond or hydrophobic interaction. Torsions 4-8 are all related to H-bond. The torsion angle here remained a 20-45-degree rotation; there may be hydrogen bond formation. Torsion 4 may be limited by spatial orientation as a tetra-alkyl end. Less than 20 degrees of twist in torsions 9 and 11 indicate the N can conform H-bonds; it was due to the limited effect of the ring, although it is not an aromatic ring. Torsion 10 can show the potential effect of hydroxyl. The change of torsion 12 was about 60 degrees. Mainly studying single bonds near O or N, torsions 13 and 15 are very stable with about just 10- or 20-degree rotation. Oxygenated areas around single rings were likely to form several binding forces. Torsions 18-22 rotated in a small range. The tricyclic and double bond limited made several bonds stable that may be advantageous. Most single bonds of molecular 3a rotated freely except the two single bonds 23 and 24. This may suggest that compound 3a spatially interacts with the receptor in a different way during simulation trajectory. Torsions 25-31 showed the changes of compound 3d, which further illustrated the good interaction between STK3-Control complexes. So the strategy for STK3 target was to de novo modify after screening referring to the control compound structure. O element around torsions 33-34 has the possibility of hydrogen bonding, but the hydroxy group on the phenyl ring failed to form a fixed hydrogen bond. The span of torsion 32 was nearly 90 degrees that this single would keep moving obviously.
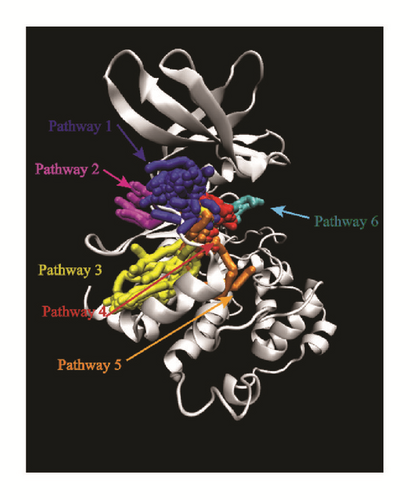
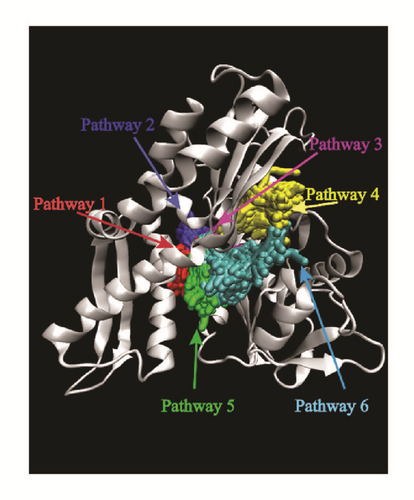
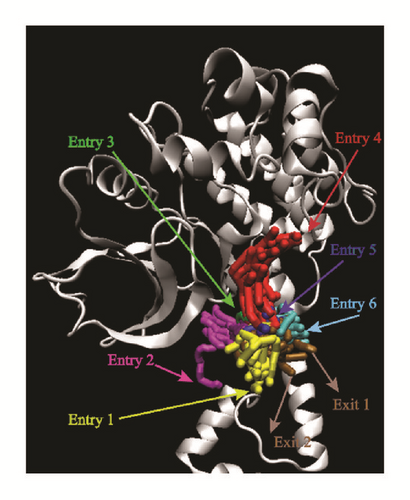
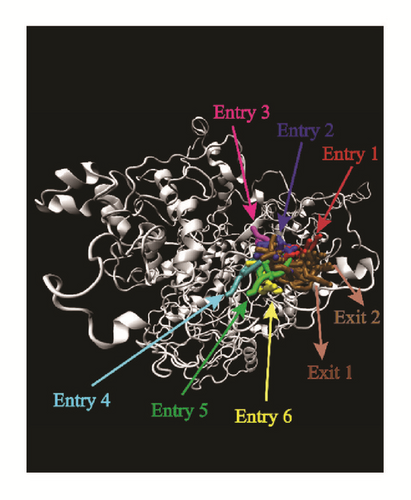
Pathway analysis could provide various pathways that the ligands could entry using Caver 3.0 [40]. The possibility of ligands entering the binding region was diverse. More entry paths mean greater possibilities for integration of ligands and proteins. Almost all the targets provide lots of access routes for ligands, which is advantageous for binding (Figure 20).
4. Discussions
Traditional Chinese medicine provides another treatment idea with no solution strategy. Compound information of TCM was provided in our TCM database (the world’s largest database of traditional Chinese medicine). Considering the docking scores comprehensively, SVM prediction activity and MLR prediction activity could explain the effect well. The verification of the simulation was provided in the experiment, such as the validation of the homology modeling and the activity prediction module.
Traditional Chinese medicine combined with network pharmacological analysis could get more effective information. It could consider multiple targets synthetically, which is quite beneficial for treatment, especially for stubborn diseases. It is impossible to employ only one target or one drug against disease nowadays. Considering the comprehensive consideration of the disease, it is exactly the same as the concept of traditional Chinese medicine. Small molecules in traditional Chinese medicine formula can be linked to multiple targets through a network, just as western medicine has been studied. Traditional Chinese medicine modernization, or integration of TCM and western medicine (WM). Network analysis can find the intercommunication between WM and TCM, bridge the current gap, and promote integrated treatment [41]. Network pharmacology-based approach integrates information into disease networks and pharmacological networks. With computational methodology, western medicine (WM) and TCM adopt networks analysis as the standard for evaluation in disease and pharmacology.
Long-term MD simulation would tell us more reliable information. In addition, the short-term MD is actually debatable; however, it was often performed at past several years. From this experiment, we want to tell the scholars who use MD to be careful about molecular dynamics simulations, especially the short-term MD. The MD simulation used in our experiment ran for 5000 ns (part of the data ran for 3000 ns due to computational resources), which is quite long for the current computing resource (2018). It could be found that some complexes that can be stably combined in tens or hundreds of nanoseconds may “fly away” in subsequent simulations. This shows that short-term MD is likely to have false positive results. Of course, our MD is not long enough but using the computational resources that can now be achieved. We want to tell the researcher there are some problems in MD, so be aware of MD.
5. Conclusions
Dock screening result is validated by QSAR model and molecular dynasty simulation; we got the more reliable candidate of small molecule compounds from TCM database.
Several molecular dynamics were connected to the targets through TCM formula candidates. The novel formula can achieve anti-HD effects through the multicomponent and multitarget strategy. Prescriptions and details of their small molecule effects were provided; they could form a drug-multitargets and multidrug synergistic effect against HD (Table 10). It was provided the novel TCM formula drugs with compounds in it, as well as the reacted target proteins. The novel TCM prescription proposes could be a developing method, not only for Huntington’s disease, but also for other chronic illnesses. The network concept deal with disease and our method of developing Chinese medicine could be a direction for development.
| Origin TCM | Compounds | Targets |
|---|---|---|
| Brucea javanica | flazine | CK2A2 |
| azelaic acid | CK2A2 | |
| bruceine F | CK2A2 | |
| azelaic acid | STK3 | |
| bruceine F | STK3 | |
| Dichroa febrifuga | Febrifugine | CK2A2 |
| Febrifugine | mtHSP70 | |
| A-Dichroine | STK3 | |
| β-Dichroine | STK3 | |
| Febrifugine | STK3 | |
| E. micranthum Harms | Cassaidine | mtHSP70 |
| Cassaine | mtHSP70 | |
| Erythrophleum guineense | Cassaidine | mtHSP70 |
| Cassaine | mtHSP70 | |
| Holarrhena antidysenterica | Holantosine A | mtHSP70 |
| Holantosine C | mtHSP70 | |
| Holantosine D | mtHSP70 | |
| Japanese Ardisia Herb |
|
CK2A2 |
|
STK3 | |
| Taraxacum formosanum | (+)-Taraxafolin B | CK2A2 |
| (+)-Taraxafolin B | LATS1 | |
| Typha angustifolia | Typhic Acid | CK2A2 |
| Typhic Acid | STK3 |
Abbreviations
-
- HD:
-
- Huntington’s disease
-
- TCM:
-
- Traditional Chinese medicine
-
- QSAR:
-
- Quantitative structure-activity relationship
-
- MLR:
-
- Multiple linear regression
-
- SVM:
-
- Support vector machine
-
- CoMFA:
-
- Comparative molecular field analysis
-
- CoMSIA:
-
- Comparative molecular similarity index analysis
-
- MD:
-
- Molecular dynamics
-
- HSF1:
-
- Heat shock transcription factor 1
-
- CK2A2:
-
- Casein kinase II subunit alpha’
-
- Htt:
-
- Huntingtin
-
- ER:
-
- Endoplasmic reticulum
-
- YAP:
-
- Yes-associated protein
-
- KEGG:
-
- Kyoto Encyclopedia of Genes and Genomes
-
- mtHSP70:
-
- Mitochondrial 70 kDa heat shock protein
-
- STK3:
-
- Serine/threonine-protein kinase 3
-
- PDB:
-
- Protein data bank
-
- DS:
-
- Discovery studio
-
- CHARMm:
-
- Chemistry at HARvard Macromolecular Mechanics
-
- GFA:
-
- Genetic Function Approximation
-
- LOOCV:
-
- Leave one out cross validation
-
- RMSD:
-
- Root-mean-square deviation
-
- RMSF:
-
- Root mean square fluctuation
-
- MSD:
-
- Mean square displacement
-
- SASA:
-
- Solvent accessible surface area
-
- gyrate:
-
- Radius of gyration.
Conflicts of Interest
The authors declare no conflicts of interest.
Authors’ Contributions
Calvin Yu-Chian Chen conceived and designed the experiments and contributed reagents/materials/analysis tools. Wenjie Dai performed the experiments. Wenjie Dai and Hsin-Yi Chen analyzed the data. Calvin Yu-Chian Chen and Wenjie Dai wrote the paper. Wenjie Dai and Hsin-Yi Chen equally contributed to the paper.
Acknowledgments
We are grateful to the Tianhe No. 2 cloud-computing facilities. We are thankful to PDB database and the tools developers we motioned above. This work was supported partially by the National Natural Science Foundation of China (NSFC) (Grant nos. 61672552 and U1611461). It was supported by Guangzhou Science and Technology Fund (Grant no. 201803010072) and China Medical University Hospital (DMR-106-151, DMR-106-071) too. We also acknowledge the start-up funding from SYSU “Hundred Talent Program”.
Open Research
Data Availability
All data generated or analysed for this study are included in this publish article. Raw data are available from the corresponding author on reasonable request.


