An Interaction of Anionic- and Cationic-Rich Mixed Surfactants in Aqueous Medium through Physicochemical Properties at Three Different Temperatures
Abstract
The mixed micellization of aqueous binary mixtures of DTAB-rich and SDS-rich surfactants, comprising sodium dodecyl sulfate (SDS) and dodecyltrimethylammonium bromide (DTAB) is studied in aqueous solution by using the physicochemical properties (PCPs) at three different temperatures (T = 293.15, 298.15, and 303.15 K) and P = 0.1 MPa. The DTAB concentration is varied from 0.0001 to 0.03 M/mol·L−1 in the ∼0.01 M/mol·L−1 SDS solution, while the concentration of SDS is varied from 0.001 to 0.015 M/mol·L−1 in the ∼0.005 M/mol·L−1 DTAB. The stable formulations have been obtained by employing the DTAB-rich and SDS-rich surfactants solutions in 3 : 1 ratio. Therefore, different phases and aggregated states formed in the ternary combinations of DTAB/SDS/H2O have been identified and described. The calculated PCPs have been utilized for determining the nature of the solute-solvent interaction (SLS0I). With increasing surfactants concentration, the polarisation of the solution also increases along with an increase in relative viscosity (ηr), viscous relaxation time (τ), and surface excess concentration (Γmax). However, the surface area of the molecule (Amin), hydrodynamic volume (Vh), and hydrodynamic radius (Rh) decrease along with an increase in surfactants concentration.
1. Introduction
The role of mixed surfactants is very crucial in our daily life. It has widespread applications in the various households and industrial processes such as usages in the chemical purification, targeted drug delivery, synthesis of advanced nanomaterials [1–4], cosmetics, wastewater treatment, food industries, detergency, and oil recovery enhancement [5–8].
With the advantages of high biodegradability, greater surface activity, high biocompatibility, and application in various separation techniques, utilization in drug formulation and related biomedical applications makes the studies of the mixed surfactant system inevitable [9]. Due to the opposite charge, the surfactant induces several remarkable properties. However, cationic and anionic mixed surfactants in an aqueous medium show numerous noble features that arise from the strong electrostatic interactions between the oppositely charged head groups [10]. It has been already reported that several types of the binary surfactant systems, cationic and anionic, show the strongest synergisms in the formation of mixed micelle and surface tension reduction of the solution [11].
The PCPs of surfactants, such as critical micellar concentration (CMC), the degree of ionization, and thermodynamics of micellization depend on the nature of the hydrophobic tail, hydrophilic head group, and the counterion species [12]. Mixed surfactants are also used in a personal cleaning product, laundry aids, shampoo, fabric softeners, and solubilizers for water-insoluble or sparingly soluble bioinspired molecules like polyphenolic compound, ionic liquid, and anticorrosive agents for steel and plastics and used as a catalyst for some industrially significant reactions, flotation collectors for mineral ores, and leveling agents for improving the dyeing processes [13–17]. Because it has an amphiphilic nature, the study of the interaction of mixed surfactants in an aqueous medium helps to decode functional and diverse information about the system and assist in harnessing their potential in technical applications [18–20].
Hence, the ternary system (DTAB/SDS/H2O) can demonstrate arrays of self-assembled microstructures, viz, micelles, vesicles, planar bilayers, and bicontinuous structures. Earlier studies have been focused mostly on two critical facts which influence the interaction activities: (a) the type of the interactions involved during the formation of the micelles (b) and the resultant structure of the formed aggregates [21]. The SDS and DTAB surfactants (Figure 1) actively interact with each other due to opposite charge species. However, above the CMC, surfactants form aggregates into the micelle [22]. Maiti et al. [23] have been investigated on oppositely charged single-tailed surfactants that could associate through electrostatic, ion-dipole, and van der Waals force attraction under specific conditions. Thus, the various aggregated microstructures (micelles, vesicles, and lamellar phases) of catanionic surfactants have attracted the attention of researchers for their multifaceted potential application in the field of drug delivery and nanoparticle synthesis. The structure of the surfactants plays an essential role in their aggregation behavior. The critical packing parameters infer the type of possible assemblies in the solution. Due to these potentials, the mixed surfactants solution has remarkable properties such as lower surface tension with higher surface activities and critical aggregation concentrations (CACs) which are essential for detergency and pharmaceutical applications [24, 25]. The cationic surfactants can form many supramolecular structures, at the specific mole ratios and concentrations; they have formed a remarkable micelles structure [26, 27] and vesicles [28, 29]. Bakshi et al. studied single and mixed micellization of surfactants by using conductivity, turbidity, and NMR measurements [30, 31]. Therefore, anionic and cationic mixed surfactants can form a numerous type of aggregated microstructures like lamellar phases, vesicles, spheres, precipitates, and rod shape structures [32, 33]. Moreover, mixing of surfactants is also used in drug formulation, lowering the Krafft temperature, and with increasing the cloud point [34], and some studies have been reported on the electrical conductance of cationic and anionic mixed surfactants [35]. Recently, many researchers have been focused on the aggregation and micelles formation process in the aqueous and mixed solvent system [36, 37]. Earlier researchers have been focused mostly on spectroscopic and thermodynamic studies of single and mixed surfactants through UV-visible, CMC, CAC, entropy, enthalpy, Gibbs free energy, micelle ionization degree, Krafft temperature, dissociation constant, and the pre-slope and post-slope values of single and mixed surfactants in an aqueous medium and mixed solvent system at different temperatures [38–45].


There is a little work on PCPs of SDS-rich and DTAB-rich mixed surfactants in an aqueous medium at T = 293.15, 298.15, and 303.15 K [46]. In this research article, we are studying the various PCPs, which include relative viscosity, viscous relaxation time, acoustic impedance, hydrodynamic volume, hydrodynamic radius, intrinsic viscosity, friccohesity shift coefficient, surface excess concentration, and area of a molecule of the SDS-rich and DTAB-rich mixed surfactants in an aqueous medium at three different temperatures (T = 293.15, 298.15, and 303.15 K) at 0.1 MPa. This type of study on the mixed surfactant system could assist in harnessing their potential in the household and industrial applications.
2. Materials and Methods
2.1. Materials
All chemicals were purchased from Sigma-Aldrich, and their details are given in Table 1. Dodecyltrimethylammonium bromide and sodium dodecyl sulfate surfactants were stored in the P2O5-filled vacuum desiccator due to their hygroscopic nature.
| Name of chemicals | Puritya (%) | Mw | Source | CAS no. |
|---|---|---|---|---|
| DTAB | ∼99 | 308.34 | Sigma-Aldrich | 1119-94-4 |
| SDS | 98 | 288.37 | Sigma-Aldrich | 151-21-3 |
- aPurity as provided by suppliers; DTAB, dodecyltrimethylammonium bromide; SDS, sodium dodecyl sulfate.
2.2. Solution Preparation
All solutions, water + SDS (aq-SDS) and water + DTAB (aq-DTAB), were prepared separately by dissolving 0.005 M/mol·L−1 and 0.01 M/mol·L−1 of DTAB and SDS surfactants separately into Milli-Q water and used as a stock solution. The 0.005 M/mol·L−1 DTAB and 0.01 M/mol·L−1 SDS solutions were used as a solvent for 0.000096 to 0.012 M/mol·L−1SDS and 0.000864 to 0.00504 M/mol·L−1 DTAB, respectively. These solutions were kept for ∼10 min sonication at 30 MHz for better homogenization. All solutions were prepared at the temperature 298.15 K and pressure 0.1 MPa using Milli-Q water at pH 7 and conductivity 0.71 μS·cm−1. For weighing, Mettler Toledo NewClassic MS was used with <±0.1·10−6 kg repeatability. To avoid evaporation and contamination, all solutions were kept in an airtight volumetric flask at the temperature of 298.15 K.
Anton Paar DSA 5000M density meter was used for measurements of their densities (ρ) and sound velocity (u) data with ±5·10−6 g·cm−3 uncertainty, and the temperature was controlled by a built-in Peltier (PT100) device with ±1.10−3 K accuracy. Repeatability of the instrument corresponds to precision in ρ and u data with 1.10−3 kg·m−3 and 0.10 m·s−1, respectively.
The instrument was calibrated with Milli-Q water at the temperature of 298.15 K, while aq-NaCl (1 M/mol·kg−1) and 10% aq-DMSO were also used to check the performance of the instrument, and the values were in agreement with the literature within the experimental uncertainties (Table S1) [47, 48]. Reported densities were an average of three repeated measurements with ±3.10−6 g·cm−3 repeatability. The ρ and u at 3 MHz frequency of uncertainties were ±5 × 10⁻³ kg m3 and ±0.5 m·s−1, respectively. All experiments were carried out at the three different temperatures (T = 293.15, 298.15, and 303.15 K) with ±0.01 K accuracy [49]. Sound velocity work based on oscillation periods of quartz U-tube with air, solvent, and solutions [50]. After each measurement, the tube was cleaned with acetone and dried by passing dried through the U-tube by using an air pump. A process of drying continued till a constant oscillation period for air was obtained and noted as an initial calibration. Viscosity, surface tension, and friccohesity data were measured by Borosil Mansingh Survismeter [51] (Cal no. 06070582/1.01/C-0395, NPL, India) through viscous flow time (VFT) and pendant drop number (PDN) methods, respectively. Lauda Alpha RA 8 thermostat was used for controlling the temperature with ±0.05 K accuracy. After attaining a thermal equilibrium, the VFT was recorded by using an electronic timer with ±0.01 s accuracy, while the PDN counted with an electronic counter. The Survismeter was washed with Milli-Q water, followed by acetone, and absolutely dried before measurements and 5, 10, 15, and 20% (w/w) aq-DMSO (AR grade, Rankem) solutions were used to check the performance of the Survismeter, and the values are in obedience to that of the literature values, given in Table S2 (supplementary material) [48, 52, 53]. The reported surface tension and viscosities are an average of three repeated measurements with ±2 × 10⁻⁶ kg·m−1·s−1 and ±0.03 mN·m−1 uncertainties, respectively.
3. Results and Discussion
3.1. Viscometric Study
Viscosity (η) values of SDS-rich and DTAB-rich mixed surfactants were measured at the three different temperatures (T = 293.15, 298.15, and 303.15 K) and at 0.1 MPa, and the same data are summarized in Table 2. Viscosity is a flowing, transporting property of the liquid mixture, and it is affected by molecular orientation and the nature of interaction ability of the solute and solvent interaction. And viscosity also gives the information about the interaction affinity of ionic species with the solvent system [54]. Table 2 shows that the aq-DTAB shows a higher η value than aq-SDS (Table S3). It indicates that the DTAB and SDS have the same hydrophobic part, except by only the head part (hydrophilic part). Due to the addition of DTAB into the aqueous system, the hydrophobic portion could be disrupted by the hydrogen bonding (HB) of the solvent system. Probably, it could also repel the solvent molecules to the surface site.
| M (mol·L−1) | 293.15 K | 298.15 K | 303.15 K |
|---|---|---|---|
| SDS-rich | |||
| 0.005000 | 1.0245 | 1.0828 | 0.6281 |
| 0.000096 | 1.4596 | 0.9800 | 2.7704 |
| 0.000240 | 1.3026 | 1.0026 | 1.1631 |
| 0.000480 | 1.7872 | 0.9961 | 1.9515 |
| 0.000672 | 1.2815 | 0.8303 | 1.3448 |
| 0.000792 | 1.0601 | 1.2297 | 1.2073 |
| 0.000960 | 1.1046 | 1.0402 | 0.7981 |
| 0.006011 | 1.0234 | 1.1561 | 0.7698 |
| 0.007200 | 1.2651 | 1.1661 | 0.8053 |
| 0.007920 | 1.3315 | 1.4613 | 0.8415 |
| 0.009000 | 1.2510 | 1.4196 | 0.7796 |
| 0.010800 | 1.3326 | 1.1678 | 1.3417 |
| 0.012000 | 1.2202 | 2.4387 | 0.8836 |
| DTAB-rich | |||
| 0.010000 | 1.0858 | 0.4814 | 1.1978 |
| 0.000864 | 2.4619 | 1.6787 | 0.7013 |
| 0.000960 | 2.8325 | 2.2650 | 0.7551 |
| 0.001536 | 2.8749 | 1.8171 | 0.7718 |
| 0.002016 | 2.8246 | 2.8142 | 0.7288 |
| 0.002496 | 3.6614 | 4.6162 | 0.7161 |
| 0.002976 | 6.8520 | 5.8893 | 0.7620 |
| 0.003264 | 2.3537 | 8.9771 | 0.7392 |
| 0.003600 | 1.1194 | 1.0365 | 0.8286 |
| 0.005040 | 3.2060 | 1.7780 | 1.0040 |
- M (mol·L−1) is SDS and DTAB molarity in solvents (±3 × 10⁻⁴ mol·L−1) and standard uncertainties u are u(m) = 0.00001 mol·L−1, u(T) = ±0.01 K, and u(p) = ±0.01 MPa.
It could induce the weak CF with decreases in the surface tension (γ) value. DTAB has three methyl (-CH3) groups in its head part which could also be developed by higher hydrophobicity; with stronger hydrophobic interaction, the γ value decreases with an increase in the η value. Generally, surfactants have a structure-breaking nature tendency of the solvent molecules which is present at the surface and strong electrostatic interaction with an increase in the η value. On increasing the concentration of surfactants, the η value increases with stronger IMF. SDS shows weaker hydrophobicity than DTAB because SDS has oxygen atoms in its head part. So, it could show weak hydrophobic interaction, and the η values decrease. Thus, the aq-DTAB shows the highest η value with stronger van der Waals interactions and inducing stronger IMI affinities with solvent molecules. So, the DTAB shows lower γ values as the aq-DTAB could induce much solvent engagement. Addition of DTAB into the aq-SDS solution could form micelles at the air-liquid interfaces (ALIs). This study could be used for the preparation of drug formulation in the aqueous medium.
The ηr values of DTAB and SDS with the solvent systems follow the order: SDS > DTAB. This order inferred that the interaction affinity of the SDS molecule is stronger as compared to DTAB. However, SDS and DTAB both have the same tail part but different head groups. SDS contains oxygen atoms in its head part while -CH3 groups in the DTAB could disrupt the HB of the solvent system, and DTAB could develop stronger ion-hydrophobic interaction (IHbI). Due to the inclusion of 0.000864 to 0.00504 M/mol·L−1 DTAB into aq-SDS solution, the ηr value is more increased. It depicted that DTAB shows stronger hydrophobic interaction and maximum solvent molecules could repel with increase in the micelles formation rate. Similarly, 0.000096 to 0.012 M/mol·L−1 SDS was added into aq-DTAB. Hence, increasing rate of the ηr value decreases than the aq-DTAB system while decrement is higher compared to the DTAB-rich solution. Therefore, SDS shows the stronger ion-hydrophilic interaction (IHI) with a solvent system. On increasing the concentration of DTAB and SDS, the ηr value increases at a certain concentration, and after that, the ηr value decreases and further significantly increases. It indicates that, on increasing the concentration of surfactants, the micellization and aggregation processes could be occurred.
In our study, the trends of SDS-rich and DTAB-rich surfactants do not follow the regular trend. It means that the surfactant has a long alkyl chain (AC) which could trapped the air bubble, and so the graph trend of SDS-rich and DTAB-rich surfactants are obtained in the zic-zac order.
The τ values are summarized in Table 3 and represented in Figures 2 and 3. The τ value is depending on the concentration, and interaction affinity of the solute with the solvent systems and temperature may be related to the structural relaxation processes occurring due to the rearrangement and reorientation of the molecules [59].
| M (mol·L−1) | 293.15 K | 298.15 K | 303.15 K |
|---|---|---|---|
| SDS-rich | |||
| 0.005000 | 6.22E − 07 | 5.74E − 07 | 2.95E − 07 |
| 0.000096 | 9.08E − 07 | 5.53E − 07 | 8.14E − 07 |
| 0.000240 | 8.10E − 07 | 5.66E − 07 | 3.42E − 07 |
| 0.000480 | 1.11E − 06 | 5.62E − 07 | 5.73E − 07 |
| 0.000672 | 7.97E − 07 | 4.76E − 07 | 3.95E − 07 |
| 0.000792 | 6.59E − 07 | 7.05E − 07 | 3.55E − 07 |
| 0.000960 | 6.87E − 07 | 5.97E − 07 | 2.35E − 07 |
| 0.006011 | 6.37E − 07 | 6.64E − 07 | 2.26E − 07 |
| 0.007200 | 7.87E − 07 | 6.70E − 07 | 2.37E − 07 |
| 0.007920 | 8.29E − 07 | 8.40E − 07 | 2.48E − 07 |
| 0.009000 | 7.78E − 07 | 8.15E − 07 | 2.29E − 07 |
| 0.010800 | 8.29E − 07 | 6.71E − 07 | 3.94E − 07 |
| 0.012000 | 7.58E − 07 | 1.40E − 06 | 2.60E − 07 |
| DTAB-rich | |||
| 0.010000 | 6.58E − 07 | 6.34E − 07 | 2.25E − 07 |
| 0.000864 | 4.54E − 07 | 3.79E − 07 | 1.62E − 06 |
| 0.000960 | 4.79E − 07 | 5.09E − 07 | 1.87E − 06 |
| 0.001536 | 4.90E − 07 | 4.09E − 07 | 1.89E − 06 |
| 0.002016 | 4.63E − 07 | 6.34E − 07 | 1.86E − 06 |
| 0.002496 | 4.55E − 07 | 1.04E − 06 | 2.41E − 06 |
| 0.002976 | 4.84E − 07 | 1.33E − 06 | 4.52E − 06 |
| 0.003264 | 4.70E − 07 | 2.02E − 06 | 1.55E − 06 |
| 0.003600 | 5.26E − 07 | 2.34E − 07 | 7.38E − 07 |
| 0.005040 | 6.38E − 07 | 4.01E − 07 | 2.11E − 06 |
- M (mol·L−1) is SDS and DTAB molarity in solvents (±3 × 10⁻⁴ mol·L−1) and standard uncertainties u are u(m) = 0.00001 mol·L−1, u(T) = ±0.01 K, and u(p) = ±0.01 MPa, and the expanded uncertainties, Uc (0.95 confidence level), is Uc(τ) = ±0.003 ps (0.95 level of confidence).
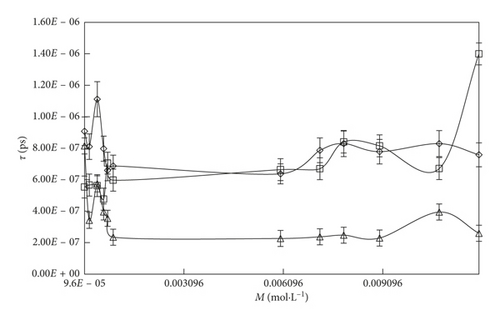
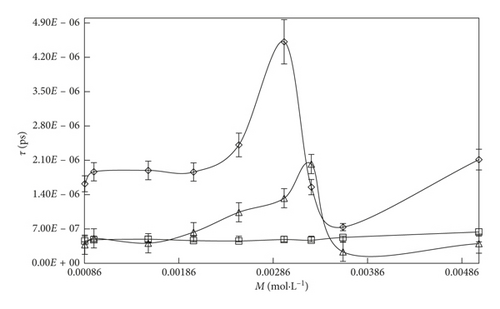
With an increase in the temperature, the τ value decreases with the increasing KE and weakening of electrostatic and binding forces. The τ value order of solvent is SDS > DTAB. This τ value order is also supported for ηr and ρ data. It infers that the SDS strongly interacts with the solvent medium by multiple intermolecular interactions (MIMI), and due to the strong interaction between solute and solvent, the solution could slowly pass through the capillary with an increase in the τ value. By increasing the concentrations of DTAB and SDS, the τ value increases with the weakening of CF and stronger electrostatic interaction, IMF, van der Waal forces. An inclusion of SDS into the aqueous system, the τ value is increased, while with DTAB, the τ value slightly decreases due to the stronger IHI domination over IHbI. On increasing 0.000096 to 0.0012 M/mol·L−1SDS, the τ value drastically increased with higher polarization, strong compactness, and the mobility of the micelles could be decreased. Similarly, with DTAB 0.000864 to 0.00504 M/mol·L−1 into aq-SDS, the τ value is less increased compared to the DTAB-rich surfactant solution. It infers that, due to the stronger IHI, the flow rate of the solution is decreased with increase in the τ value, while with DTAB-rich surfactant solution, because of stronger IHbI and with the weakening of CF, the solution quickly passes and the τ value is decreased.
3.2. Acoustic Impedance (Z)
| M (mol·L−1) | 293.15 K | 298.15 K | 303.15 K |
|---|---|---|---|
| SDS-rich | |||
| 0.005000 | 1481.77 | 1493.79 | 1498.87 |
| 0.000096 | 1481.90 | 1507.06 | 1504.04 |
| 0.000240 | 1482.03 | 1507.14 | 1504.12 |
| 0.000480 | 1482.02 | 1507.23 | 1504.21 |
| 0.000672 | 1481.93 | 1495.07 | 1504.28 |
| 0.000792 | 1481.94 | 1495.15 | 1504.31 |
| 0.000960 | 1481.89 | 1494.30 | 1503.99 |
| 0.006011 | 1481.31 | 1494.34 | 1503.56 |
| 0.007200 | 1482.11 | 1493.99 | 1502.86 |
| 0.007920 | 1480.60 | 1493.54 | 1503.57 |
| 0.009000 | 1481.86 | 1494.32 | 1503.72 |
| 0.010800 | 1481.76 | 1494.17 | 1504.16 |
| 0.012000 | 1482.45 | 1494.74 | 1504.81 |
| DTAB-rich | |||
| 0.010000 | 1483.00 | 1495.30 | 1504.82 |
| 0.000864 | 1482.79 | 1480.63 | 1502.52 |
| 0.000960 | 1482.62 | 1494.48 | 1506.18 |
| 0.001536 | 1482.50 | 1494.53 | 1504.13 |
| 0.002016 | 1482.53 | 1494.60 | 1504.22 |
| 0.002496 | 1482.13 | 1494.52 | 1504.29 |
| 0.002976 | 1482.16 | 1494.48 | 1504.26 |
| 0.003264 | 1480.20 | 1492.06 | 1503.21 |
| 0.003600 | 1482.23 | 1494.31 | 1503.82 |
| 0.005040 | 1481.90 | 1493.87 | 1503.56 |
- M (mol·L−1) is SDS and DTAB molarity in solvents (±3 × 10⁻⁴ mol·L−1) and standard uncertainties u are u(m) = 0.00001 mol·L−1, u(T) = ±0.01 K, and u(p) = ±0.01 MPa.
The Z value infers an increase in the u value at a fixed composition and temperature. However, on increasing the temperature, the Z value is increased. It indicates that the Z property is directly proportional to the u value (Table S5) because of the heat which is a kind of KE.
On increasing the temperature, the molecules could gain energy which could induce rotational, electronic, transformational, and vibrational transitions and because of these transitions, the sound waves could travel quickly and the Z value is increased. The Z value (Figures 4 and 5) of the solvent systems follows the order: SDS > DTAB. The Z value also supported the ρ, ηr, and τ data. This order reflected that aq-SDS shows the higher Z value than aq-DTAB. SDS has a higher hydrophilic nature and stronger interaction abilities with an increase in the compactness of the solution. Thus, the aq-DTAB shows the higher hydrophobic nature which could induce stronger IHbI repelling the solvent molecules to the surface site and weakening the CFs with decreases in the γ value and with stronger IMI, the compactness and internal pressure (IP) increases, so the Z value is increased. All parameters are supporting each other on the basis of these interlink (coordinative) properties.
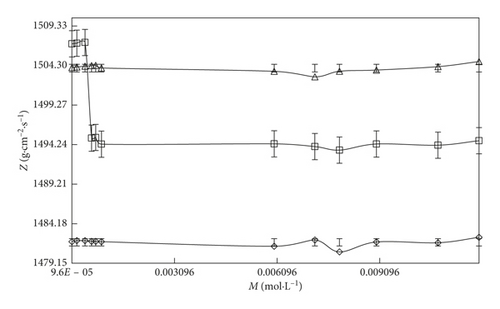
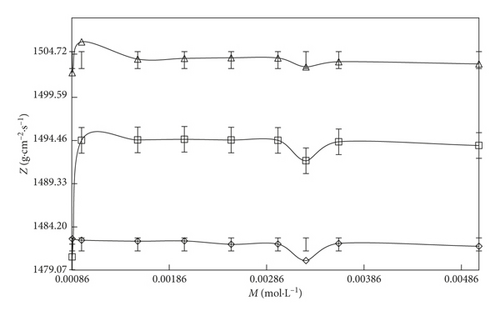
On increasing 0.000096 to 0.012 M/mol·L−1 SDS and 0.000864 to 0.00504 M/mol·L−1 DTAB concentration with aq-DTAB and aq-SDS, respectively, the Z value increases. However, in the case of DTAB-rich surfactant, the increasing rate of the Z value is higher than the SDS-rich surfactant at the three different temperatures (T = 293.15, 298.15, and 303.15 K).
Both surfactants have the same hydrophobicity spacer (tail region) except the hydrophilic spacer (head region). The higher Z value of aq-SDS infers that the aq-SDS could strongly interact by stronger IHI and ion-dipole interaction (IDI) forms small size micelles of the aq-SDS solution while with aq-DTAB, by stronger IHbI forms large size micelles with weaker compactness in the solution, and the Z value is decreased. However, with increasing SDS concentration, the Z value increases with stronger IHI dominant over IHbI and stronger electrostatic, van der Waals interaction with higher compactness occurring in the solution. For the DTAB-rich system, the Z value decreases with stronger IHbI dominant over IHI.
3.3. Surface Property
The DTAB-rich and SDS-rich systems have been applied in several technological applications because of the formation of micelles during the aggregation method under certain functioning conditions. Several physical properties of surfactants have been reported in the literature because of their ability of characterizing different physical properties that have been analysed in the literature and due to their ability of describing the aggregation processes by using electrical conductivity(κ) and surface tension (γ) values [30, 31].
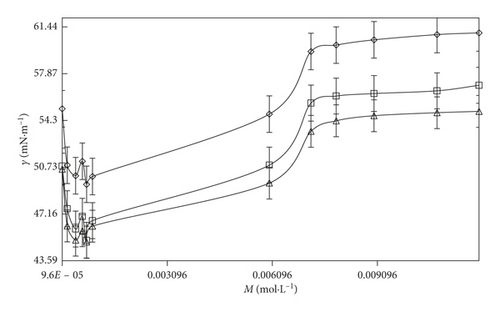
Table S6 shows that the γ value of SDS-rich and DTAB-rich decreases with increases in surfactants concentration in an aqueous system at the three different temperatures (T = 293.15, 298.15, and 303.15 K). It is evident from Table S6 that the γ value initially decreases with increasing concentration of SDS and then reaches a minimum. It indicates that micelles could form and the concentration of the break point is CMC, whereas for DTAB-rich, the surface tension reduced by adsorption of the surfactant at the interface, and a sigmoidal curve between surface tension (γ) and log (surfactant) is produced by the distinct break after which the γ value remains almost unchanged. Due to the presence of DTAB and SDS, surfactants produce a decrease in the γ value. Nevertheless, this decrease in surface tension reaches a constant γ value at a certain surfactant concentration. It depicted that the surface tension is a physical property influenced by the aggregation phenomenon due to a change in the surface concentration of the surfactant. Due to this reason, the surface tension has been used to determine the colloidal dynamics of numerous systems [60]. Thus, the aggregation process creates the concentration of SDS and DTAB remains constant due to the addition of different surfactants that are engaged in the formation of micelles. However, it could not effect on the surfactant concentration in the free liquid surface. Hence, the surface tensions remain with a constant value.
3.4. Interfacial Behavior
The packing symmetry of the solvent spread monolayer of the ion-pair amphiphiles at the air-water interface depends on the stoichiometry and the magnitude of the charged head groups and the symmetry and the dissymmetry in the precursors’ hydrophobic spear (the alkyl chain). The alkyl chains packed them in a way to maximize their van der Waals interaction, LDF, and electrostatic interaction in the bulk site. However, molecular packing at the air-water interfaces (AWI) to be more compact results in the lower molecular lift-off area [61].
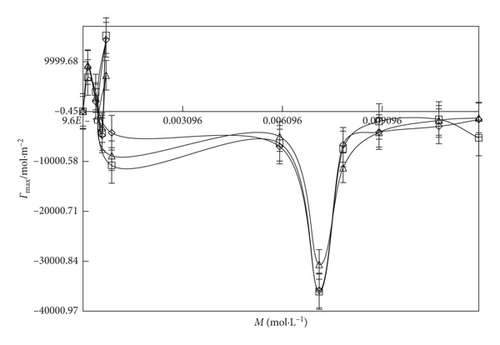
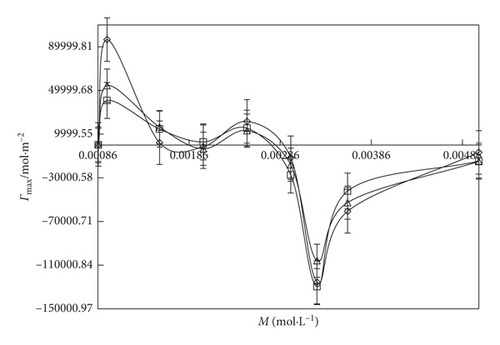
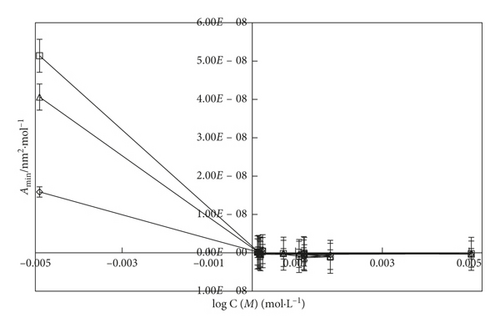
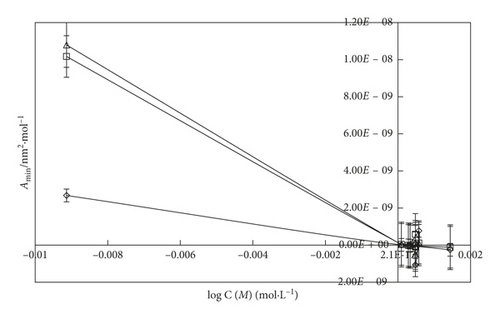
The surface excess concentration (Γmax) and the minimum surface area of the molecule (Amin) are two important parameters which determine the adsorption behavior and packing density of the micelles at the air/water interface [60, 62]. Γmax is the concentration difference between the interface and a virtual interface in the interior of the volume phase, while Amin describes the minimum area of the amphiphile molecules at the surfactant-saturated monolayer at the air/solution interface [58, 60].
| M (mol·L−1) | 293.15 K | 298.15 K | 303.15 K |
|---|---|---|---|
| SDS-rich | |||
| 0.000096 | 104.57 | 32.32 | 40.87 |
| 0.000240 | 8903.09 | 6826.05 | 9244.40 |
| 0.000480 | 1983.06 | 3906.60 | 2792.54 |
| 0.000672 | −4771.73 | −4278.36 | −3228.07 |
| 0.000792 | 14396.98 | 15220.63 | 7270.84 |
| 0.000960 | −4249.40 | 10801.67 | −8857.06 |
| 0.006011 | −7020.87 | −6358.77 | −5015.42 |
| 0.007200 | −35875.12 | 36095.19 | 30640.08 |
| 0.007920 | −6680.42 | −7485.56 | 11272.62 |
| 0.009000 | −4131.37 | −1995.31 | −4163.18 |
| 0.010800 | −2974.58 | −1587.85 | −1767.75 |
| 0.012000 | −1611.23 | −5292.82 | −1280.98 |
| DTAB-rich | |||
| 0.000864 | 96550.00 | 40830.30 | 54441.63 |
| 0.000960 | 2148.31 | 14651.86 | 16499.02 |
| 0.001536 | −1561.66 | 2858.12 | −3389.47 |
| 0.002016 | 21654.96 | 15465.11 | 13188.97 |
| 0.002496 | −11603.35 | 27424.35 | 18028.51 |
| 0.002976 | 125576.98 | 129682.4 | 105979.7 |
| 0.003264 | −60686.80 | 42126.50 | 52703.16 |
| 0.003600 | −6723.80 | 14731.67 | 15019.49 |
| 0.005040 | 96550.00 | 40830.30 | 54441.63 |
- M (mol·L−1) is SDS and DTAB molarity in solvents (±3 × 10⁻⁴ mol·L−1) and standard uncertainties u are u(m) = 0.00001 mol·L−1, u(T) = ±0.01 K, and u(p) = ±0.01 MPa.
| M (mol·L−1) | 293.15 K | 298.15 K | 303.15 K |
|---|---|---|---|
| SDS-rich | |||
| 0.000096 | 1.59E − 08 | 5.14E − 08 | 4.06E − 08 |
| 0.000240 | 1.86E − 10 | 2.43E − 10 | 1.80E − 10 |
| 0.000480 | 8.37E − 10 | 4.25E − 10 | 5.95E − 10 |
| 0.000672 | −3.48E − 10 | −3.88E − 10 | −5.14E − 10 |
| 0.000792 | 1.15E − 10 | 1.09E − 10 | 2.28E − 10 |
| 0.000960 | −3.91E − 10 | −1.54E − 10 | −1.87E − 10 |
| 0.006011 | −2.36E − 10 | −2.61E − 10 | −3.31E − 10 |
| 0.007200 | −4.63E − 11 | −4.60E − 11 | −5.42E − 11 |
| 0.007920 | −2.49E − 10 | −2.22E − 10 | −1.47E − 10 |
| 0.009000 | −4.02E − 10 | −8.32E − 10 | −3.99E − 10 |
| 0.010800 | −5.58E − 10 | −1.05E − 09 | −9.39E − 10 |
| 0.012000 | −1.03E − 09 | −3.14E − 10 | −1.30E − 09 |
| DTAB-rich | |||
| 0.000864 | 2.68E − 09 | 1.02E − 08 | 1.08E − 08 |
| 0.000960 | 1.72E − 11 | 4.07E − 11 | 3.05E − 11 |
| 0.001536 | 7.73E − 10 | 1.13E − 10 | 1.01E − 10 |
| 0.002016 | −1.06E − 09 | 5.81E − 10 | −4.90E − 10 |
| 0.002496 | 7.67E − 11 | 1.07E − 10 | 1.26E − 10 |
| 0.002976 | −1.43E − 10 | −6.05E − 11 | −9.21E − 11 |
| 0.003264 | −1.32E − 11 | −1.28E − 11 | −1.57E − 11 |
| 0.003600 | −2.74E − 11 | −3.94E − 11 | −3.15E − 11 |
| 0.005040 | −2.47E − 10 | −1.13E − 10 | −1.11E − 10 |
- M (mol·L−1) is SDS and DTAB molarity in solvents (±3 × 10⁻⁴ mol·L−1) and standard uncertainties u are u(m) = 0.00001 mol·L−1, u(T) = ±0.01 K, and u(p) = ±0.01 MPa.
An inclusion of SDS into the water, the Γmax value (Figures 6 and 7) is more increased. It indicates that the SDS has oxygen atoms in the head part which is small in size. So, the maximum number of SDS molecules could go to the surface site. Similarly, an addition of DTAB into the aqueous system, the Γmax value is decreased than the aq-SDS system. It indicates that the larger size of DTAB has three -CH3 groups in its structure which could induce a hindrance for a move to the surface site. So, the less number of DTAB molecules could move to the surface, and the Γmax value decreases. On increasing the concentration from 0.000096 to 0.012 M/mol·L−1 SDS and 0.000864 to 0.00504 M/mol·L−1 DTAB, the maximum surfactant molecules move to the surface site with surfactant molecules occupying a less area with stronger HbHbI and stronger LDF due to a more considerable difference in the chemical potential of the surface and in the bulk phase. Due to the stronger LDF occurrence with stronger BF and stronger IMF, Amin is decreased. On increasing the temperature, Amin expands due to increased KE and weakening of BF. Due to the increase in the temperature, Γmax value decreases with increasing area of molecules with the weakening of BF and IMI, and the least number of surfactant molecules could go to the surface with the increased Amin value (Figures 8 and 9).
3.5. Friccohesity Shift Coefficient (FSC)
Friccohesity predicts working or functional ability of solution where the residual molecular forces remain in a reversible mode. Fundamentally, the ability of the medium or the solvent and the constituent molecules to promote the SLS0I rather than self-binding individually is a fundamental need for sparing the molecular surface area. The disruption of the self-binding state could be attained by the weakening of the CF on increasing friccohesity attracting other molecules like drugs or others for binding. The self-binding state could have stronger homomolecular potential noted as an antidispersion activity. Hence, the potentializing homomolecular intramolecular potential to trap other molecules is an essential need to weaken CF and to develop intermolecular or the heteromolecular forces to get stuck to the solution. The shear stress and strains lead to velocity gradients and interlayer distance. The interlayer distance directly reflects the strength of the IMF when the solute molecules could align along with line subjected to the interlayer thickness. The intermolecular strength is determined with HB and also the weakening of the solvent structures and tends to form a structure with the solute. It becomes an urgent need that the status of CF and IMF is measured simultaneously which is rightly and logically determined by friccohesity data.
The solvent systems follow the order in the aqueous medium: SDS > DTAB. This order infers that the σC value increased the aq-SDS (Table 7) than aq-DTAB due to SDS which could develop weak CFs with stronger FFs and IMF; the γ value decreases with the higher ρ value. While with aq-DTAB, the σC value is decreased. The σC value of aq-DTAB is more decreased than aq-SDS solutions because both surfactants have the same tail part, except the only head part, and so the stronger IHbI and weak CFs with stronger FFs. On increasing 0.000096 to 0.012 M/mol·L−1 SDS and 0.000864 to 0.00504 M/mol·L−1 DTAB concentration, the σC value increases due to stronger IMI with the weakening of CFs.
| M (mol·L−1) | 293.15 K | 298.15 K | 303.15 K |
|---|---|---|---|
| SDS-rich | |||
| 0.005000 | 1.997570 | 0.988696 | 1.126186 |
| 0.000096 | 0.472963 | 0.992845 | 1.524808 |
| 0.000240 | 1.229149 | 1.181705 | 0.751272 |
| 0.000480 | 0.722956 | 0.870212 | 1.363012 |
| 0.000672 | 1.056841 | 1.252171 | 1.983979 |
| 0.000792 | 1.226570 | 1.526528 | 0.629227 |
| 0.000960 | 1.478152 | 1.467933 | 1.274735 |
| 0.006011 | 0.795106 | 1.402486 | 0.608560 |
| 0.007200 | 0.878679 | 1.052150 | 0.702083 |
| 0.007920 | 0.999447 | 0.772808 | 0.630889 |
| 0.009000 | 1.021779 | 0.884746 | 0.853029 |
| 0.010800 | 0.780298 | 0.823337 | 0.546062 |
| 0.012000 | 0.625146 | 0.758690 | 0.391575 |
| DTAB-rich | |||
| 0.010000 | 2.606188 | 1.205797 | 1.135148 |
| 0.000864 | 2.752721 | 1.536592 | 0.719237 |
| 0.000960 | 2.556441 | 1.138905 | 0.625152 |
| 0.001536 | 3.491674 | 1.419604 | 0.615893 |
| 0.002016 | 2.648554 | 0.916497 | 0.626744 |
| 0.002496 | 3.554227 | 0.558781 | 0.483651 |
| 0.002976 | 2.533495 | 0.437935 | 0.258442 |
| 0.003264 | 2.444864 | 0.251481 | 0.772786 |
| 0.003600 | 2.074703 | 2.167979 | 1.686891 |
| 0.005040 | 1.490789 | 1.431129 | 0.440847 |
- M (mol·L−1) is SDS and DTAB molarity in solvents (±3 × 10⁻⁴ mol·L−1) and standard uncertainties u are u(m) = 0.00001 mol·L−1, u(T) = ±0.01 K, and u(p) = ±0.01 MPa.
This parameter reveals the mechanism of SLS0I and SLSLI of surfactants [65]. Such parameters determined a critical and comparative study of γ (Figures 10 and 11) and friccohesity of the SDS-rich and DTAB-rich surfactant solution summarized in Table S7. It also infers the efficacy of interacting activity of SDS and DTAB with the solvent system, its fluidity and absorptivity. We obtained a conversion relation between γ and η, and the aq-DTAB shows higher η and lower γ compared to the aq-SDS solution due to stronger hydrophobic interaction. The η value is increased because of the interaction with dissimilar molecules. Due to the inclusion of SDS and DTAB in aq-DTAB and aq-SDS solution, the friccohesity shift coefficient decreases with stronger FFs and weak CFs. On increasing the concentration of surfactants, the σC value is decreased. On increasing the temperature, the σC value is decreased due to the weakening of FF, electrostatic interaction, IDI, and binding forces.

3.6. Hydrodynamic Volume (Vh)
Hydrodynamic values are a significant factor in determining a magnitude to the volume change of the hydrated molecules with increasing solute concentration. On increasing the temperature, the SDS-rich and DTAB-rich have negative Vh values which decrease as the size of the KE increases. The Vh values in this study (Table 8) shows negative at the temperatures T = 298.15 and 303.15 K. Thus, the sign of the Vh values reflects the nature of the SLS0I; then, we can conclude that, at different temperatures (T = 298.15 and 303.15 K), the DTAB-rich and SDS-rich mixed surfactants have structure-making effects on water, whereas temperature 293.15 K in this study shows structure-breaking effects [66].
| M (mol·L−1) | 293.15 K | 298.15 K | 303.15 K |
|---|---|---|---|
| SDS-rich | |||
| 0.005000 | 0.0098 | 0.0331 | −0.1488 |
| 0.000096 | 0.1838 | −0.0080 | 0.7081 |
| 0.000240 | 0.1210 | 0.0010 | 0.0653 |
| 0.000480 | 0.3149 | −0.0016 | 0.3806 |
| 0.000672 | 0.1126 | −0.0679 | 0.1379 |
| 0.000792 | 0.0241 | 0.0919 | 0.0829 |
| 0.000960 | 0.0418 | 0.0161 | −0.0808 |
| 0.006011 | 0.0094 | 0.0624 | −0.0921 |
| 0.007200 | 0.1060 | 0.0664 | −0.0779 |
| 0.007920 | 0.1326 | 0.1845 | −0.0634 |
| 0.009000 | 0.1004 | 0.1678 | −0.0882 |
| 0.010800 | 0.1330 | 0.0671 | 0.1367 |
| 0.012000 | 0.0881 | 0.5755 | −0.0466 |
| DTAB-rich | |||
| 0.010000 | 0.0343 | 0.0791 | −0.2075 |
| 0.000864 | 0.5848 | −0.1195 | 0.2715 |
| 0.000960 | 0.7330 | −0.0980 | 0.5060 |
| 0.001536 | 0.7499 | −0.0913 | 0.3268 |
| 0.002016 | 0.7299 | −0.1085 | 0.7257 |
| 0.002496 | 1.0646 | −0.1136 | 1.4465 |
| 0.002976 | 2.3408 | −0.0952 | 1.9557 |
| 0.003264 | 0.5415 | −0.1043 | 3.1908 |
| 0.003600 | 0.0477 | −0.0686 | 0.0146 |
| 0.005040 | 0.8824 | 0.0016 | 0.3112 |
- M (mol·L−1) is SDS and DTAB molarity in solvents (±3 × 10⁻⁴ mol·L−1) and standard uncertainties u are u(m) = 0.00001 mol·L−1, u(T) = ±0.01 K, and u(p) = ±0.01 MPa.
| M (mol·L−1) | 293.15 K | 298.15 K | 303.15 K |
|---|---|---|---|
| SDS-rich | |||
| 0.005000 | 1.00 | 3.39 | −15.23 |
| 0.000096 | 916.87 | −39.94 | 3531.75 |
| 0.000240 | 241.47 | 2.07 | 130.18 |
| 0.000480 | 314.06 | −1.57 | 379.62 |
| 0.000672 | 80.21 | −48.37 | 98.28 |
| 0.000792 | 14.54 | 55.54 | 50.12 |
| 0.000960 | 20.86 | 8.03 | −40.27 |
| 0.006011 | 0.75 | 4.97 | −7.34 |
| 0.007200 | 7.05 | 4.42 | −5.18 |
| 0.007920 | 8.02 | 11.15 | −3.83 |
| 0.009000 | 5.34 | 8.93 | −4.69 |
| 0.010800 | 5.90 | 2.98 | 6.06 |
| 0.012000 | 3.51 | 22.96 | −1.86 |
| DTAB-rich | |||
| 0.010000 | 1.64 | 3.79 | −10.62 |
| 0.000864 | 346.48 | −70.79 | 160.87 |
| 0.000960 | 390.88 | −52.25 | 269.83 |
| 0.001536 | 249.95 | −30.43 | 108.93 |
| 0.002016 | 185.34 | −27.55 | 184.28 |
| 0.002496 | 218.35 | −23.30 | 296.68 |
| 0.002976 | 402.67 | −16.38 | 336.42 |
| 0.003264 | 84.93 | −16.36 | 500.46 |
| 0.003600 | 6.79 | −9.75 | 2.07 |
| 0.005040 | 89.63 | 0.16 | 31.61 |
- M (mol·L−1) is SDS and DTAB molarity in solvents (±3 × 10⁻⁴ mol·L−1) and standard uncertainties u are u(m) = 0.00001 mol·L−1, u(T) = ±0.01 K, and u(p) = ±0.01 MPa.
The Vh values for solvent follow the order: SDS > DTAB. This order indicates that the interaction activity of SDS with H+ ions of solvent molecules is stronger than DTAB because SDS could be strongly towards H+ ions of water by the O− ion which is present at the head region in the SDS. So, the interaction affinity of SDS with H+ ions is higher, while with DTAB is the lower because DTAB has -CH3 groups in its head region, which could repel the water molecules. Thus, the Vh value of DTAB is lesser than SDS in an aqueous medium. An inclusion of SDS into aq-DTAB, the Vh value drastically increased due to a higher concentration of SDS, it has more O− ions which could show the stronger interaction affinity with the IHI domain over IHbI, and SDS could form a more hydrogen sphere compared to the DTAB, while with DTAB into aq-SDS solution, the Vh value is decreased as compared to SDS-rich surfactants. It depicted that the stronger hydrophobic interaction and DTAB could show weak interaction ability with water molecules with decreases the Vh value. On increasing the surfactants concentration, the Vh values decrease with stronger SLSLI and weaker SLS0I. On increasing the temperature, the Vh value increases due to the weakening of electrostatic interaction and binding forces.
3.7. Hydrodynamic Radius (Rh)
| M (mol·L−1) | 293.15 K | 298.15 K | 303.15 K |
|---|---|---|---|
| SDS-rich | |||
| 0.005000 | 59.38 | 60.97 | 76.27 |
| 0.000096 | 52.35 | 61.38 | 54.30 |
| 0.000240 | 54.37 | 60.92 | 72.52 |
| 0.000480 | 48.93 | 61.05 | 61.03 |
| 0.000672 | 54.67 | 64.87 | 69.09 |
| 0.000792 | 58.24 | 56.91 | 71.63 |
| 0.000960 | 57.44 | 60.17 | 82.22 |
| 0.006011 | 58.92 | 58.09 | 83.22 |
| 0.007200 | 54.90 | 57.93 | 81.98 |
| 0.007920 | 53.97 | 53.73 | 80.78 |
| 0.009000 | 55.11 | 54.25 | 82.87 |
| 0.010800 | 53.96 | 57.90 | 69.15 |
| 0.012000 | 55.57 | 45.30 | 79.48 |
| DTAB-rich | |||
| 0.010000 | 58.24 | 58.95 | 83.34 |
| 0.000864 | 43.13 | 66.35 | 70.12 |
| 0.000960 | 41.16 | 64.74 | 63.46 |
| 0.001536 | 40.96 | 64.27 | 68.30 |
| 0.002016 | 41.20 | 65.51 | 59.03 |
| 0.002496 | 37.79 | 65.90 | 50.05 |
| 0.002976 | 30.66 | 64.54 | 46.15 |
| 0.003264 | 43.78 | 65.20 | 40.10 |
| 0.003600 | 56.09 | 62.77 | 82.35 |
| 0.005040 | 39.50 | 58.87 | 68.79 |
- M (mol·L−1) is SDS and DTAB molarity in solvents (±3 × 10⁻⁴ mol·L−1) and standard uncertainties u are u(m) = 0.00001 mol·L−1, u(T) = ±0.01 K, and u(p) = ±0.01 MPa.
3.8. Viscosity B-Coefficient (B)
| T/K | SDS-rich |
|---|---|
| 293.15 | 1.3689 |
| 298.15 | 1.0474 |
| 303.15 | 1.7095 |
| T/K | DTAB-rich |
| 293.15 | 2.5019 |
| 298.15 | 0.6706 |
| 303.15 | 1.2427 |
- M (mol·L−1) is SDS and DTAB molarity in solvents (±3 × 10⁻⁴ mol·L−1) and standard uncertainties u are u(m) = 0.00001 mol·L−1, u(T) = ±0.01 K, and u(p) = ±0.01 MPa.
The stronger HbHI is decreased the B value with a tendency to behave as a structural breaker [54]. The surfactants induced stronger hydrophilic and hydrophobic interactions with the water system. The B values reflect the structure, making or breaking effects noted as (ηr−1/m) > 1. It indicates an ability of a solute to interact with the medium via the IMF and HB.
4. Conclusion
In this study, the relative viscosity, viscous relaxation time, and acoustic impedance values increase with increasing of concentration of the surfactants due to stronger ion-hydrophobic interaction with the weakening of cohesive forces with stronger frictional forces. By the addition of SDS and DTAB into water, the surface tension value decreases while the viscosity and friccohesity value increase due to weakening of cohesive forces and stronger intermolecular forces. These properties are correlated to each other. Mixed surfactants form self-assembly which could be applicable in the industry, pharmaceuticals, and drug formulation. Therefore, friccohesity determined the surface and bulk properties of the solution. With increasing concentration of the surfactant, surface excess concentration values are increased with stronger hydrophobicity pushing larger DTAB and SDS amount to the surface with more Brownian motion and stronger LDF. A less volume because of stronger HbHbI, bringing together the stronger LDF, and stronger LDF causes stronger binding forces have produced a greater internal pressure and lower surface area. On increasing the temperature, the area of the molecule increases because of weak intermolecular interaction and bond forces. SDS and DTAB mixed surfactant could be applicable in industrial and pharmaceutical for the formation of the drug, drug delivery, drug loading, enhanced solubility, and dispersion of drug. We have calculated the surface and bulk properties of the mixed surfactant which can be used in these applications.
Conflicts of Interest
The authors declare that there are no conflicts of interest regarding the publication of this paper.
Acknowledgments
Ajaya Bhattarai is thankful to The World Academy of Sciences (TWAS), Italy, for providing funds to work in the Department of Chemical Sciences, Central University of Gujarat, Gandhinagar (India).
Open Research
Data Availability
The authors share the data underlying the findings of the manuscript.


