Experimental Study on Limestone Cohesive Particle Model and Crushing Simulation
Abstract
This study investigates the effect of impact velocity and particle size on crushing characteristics. We use a discrete-element method simulation and construct cohesive limestone particles with internal microinterfaces and cracks for impact crushing experimentation. The simulation model follows the same process as the impact crushing experiment. Results show that, after crushing at impact velocities of 30 and 40 m/s, the simulated particle-size distribution curve matches experimental results as closely as 95%. For different particle sizes, results are more than 90% in agreement. These results indicate the feasibility of the cohesive-particle crushing simulation model. When the particle size is 15 mm, an approximate linear relationship exists on impact velocity and crushing ratio. For a constant impact velocity, the particle size of 18 mm results in the maximum crushing ratio.
1. Introduction
The discrete-element method (DEM) is an effective numerical simulation method for investigating crushing particles [1]. For DEM numerical simulation of particle breakage, it is necessary to construct a model of the material’s particle mechanics. The quality of the model strongly affects the simulation results [2]. In the mineral ore field, Potyondya and Cundall built a DEM model—based on a bonded particle model—that simulated rock crushing [3]. The rock is filled with assembly of spherical particles of different sizes, and the contact point is added with the parallel bond. Bonding differently sized particles into cohesive particles. The cohesive particles are used in the impact crushing experiment. Schubert et al. showed that experimental results had similarities with DEM simulations, proving the feasibility of this approach [4]. Price et al. proposed a filling method using the particles’ mesh vertices to automatically derive the 3D surface, thereby converting four points into a sphere [5]. However, the random sampling technique required to select four points from a large number of mesh vertices affects the computational efficiency. Al-Khasawneh proposed a new model based on the DEM [6]. In simulations and experiments, their model avoided the problems caused by calculating too many cohesive particles. However, it also ignored the changes of micromorphology in the grain-crushing process.
Jiang et al. developed the numerical model of rock fragmentation via waste-jet impact based on the finite-element method. The results showed that the theoretical scopes of the crushing and damage zone were slightly smaller than those of the numerical method because the stress wave reflection and superposition were ignored in the developed theoretical model [7]. Quist and Evertsson built an ore particle model for simulating cone crushing in a virtual environment with a collection of particles using a bimodal model [8]. Lei built a cohesive-particle model with a single particle that can dynamically simulate the whole process of a jaw crusher crushing the material [9]. Li established a model of a collection of particles to simulate asphalt pavement. He used uniaxial compression and indirect tensile test parameters to calibrate the DEM, improving the established theories of milling operations [10]. The internal parameters of the above mode only be given one group of bond parameters, and more researches only are carried out compression crushing. It is difficult to reflect the internal strength of many kinds of minerals binding the surface and different minerals in the ores. Due to particle breakage and fracture that can only be fully understood at the particle scale, DEM has been widely used in the past few years [11–13]. In this paper, we constructed a cohesive-particle model with internal microinterfaces and cracks to simulate the crushing process of a single material. The particle size distribution after crushing was analyzed. The real crushing ratio and sand forming rate were compared and analyzed.
2. Materials and Methods
2.1. Hertz–Mindlin (No Slip) Nonsliding Contact Model and Theory
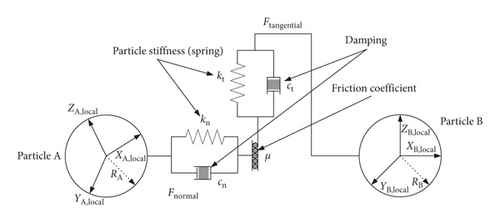
Hertz–Mindlin (no slip) is a DEM simulation model with the normal force based on Hertz contact theory and the tangential force based on the work of Mindlin–Deresiewicz. The contact between granular cells is modeled by a spring-damping system. The spring represents the elasticity of the unit. Damping is force attenuation or object in the energy dissipation of the movement. The damping represents the inelasticity, and the sliding block with friction coefficient represents the friction between elements. The contact model between particle elements is shown in Figure 1. The contact model is efficient and accurate for calculation of the forces [14–17].
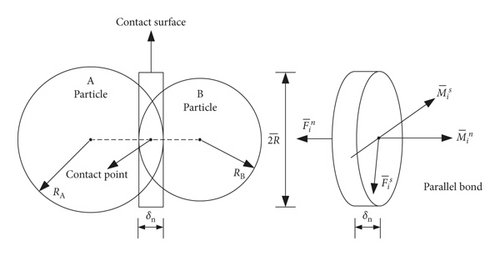
The contact stiffnesses between two particles are modeled as a set of elastic springs with a constant normal and shear stiffness at the contact point (Figure 2). When two particles overlap, a normal and shear contact force develop at the contact point, causing a relative motion to occur between two balls during each calculation step. Parallel bond replaces cohesion between different tissues with polymerization in rock material particles. Therefore, the numerical calculation model of the crushed rock material particles, the cohesive particle model, is obtained.
2.2. Hertz–Mindlin Model with Bonding Particle Adhesion
The Hertz–Mindlin with the bonding contact model can use a finite bond force to calculate the bonded particle model. The bonding force/moment is an additional Hertz–Mindlin force. This model is especially suitable for simulating the fracture failure of concrete and rock-like materials [21, 22].
2.3. Construction of Cohesive Model of Limestone
Owing to the complex internal structure and diverse composition of rock, the bond strength differs even between different samples of the same mineral. Using the Hertz–Mindlin with the bonding model, we use multiple-strength bond keys to distribute bonds randomly to construct the initial defects in the interior of the particles. The particle-ball model is then divided into four parts. The shared surfaces of each part represent internal cracks and can simulate the differences in cohesion between both similar and different minerals. The discrete-element model of rock particles needs to determine the physical parameters and contact parameters. The physical parameters and contact parameters of limestone discrete-element model are determined through a series of experiments. The results are shown in Tables 1 and 2.
| Material | Poisson’s ratio | Shear modulus (Pa) | Density (kg·(m3)−1) |
|---|---|---|---|
| Limestone | 0.25 | 2.09e + 8 | 2650 |
| Steel | 0.30 | 7e + 10 | 7800 |
| Mutual contact | Coefficient of restitution | Coefficient of static friction | Rolling friction coefficient |
|---|---|---|---|
| Limestone-limestone | 0.208 | 0.77 | 0.1 |
| Limestone-steel | 0.557 | 0.61 | 0.07 |
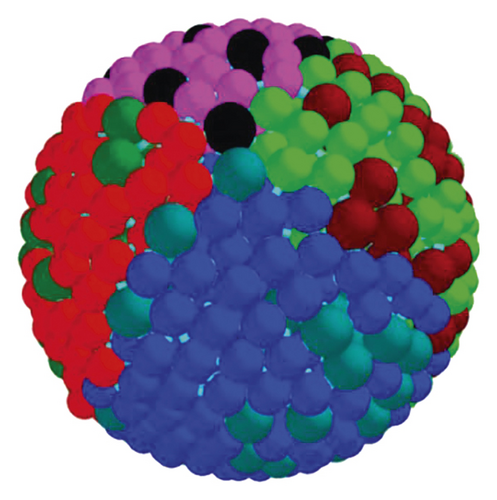
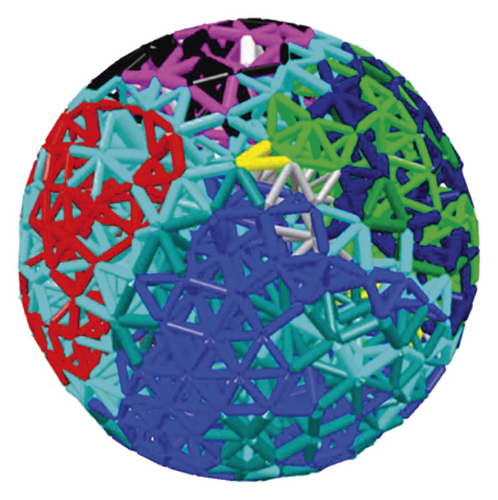
The cohesive-particle model is established with internal microinterfaces and cracks as shown in Figure 3. In Figure 3(a), four different color combinations red-dark green, blue-light green, green-brown, and pink-black represent the distributions of four same-sized particle types. The bonding surface of each structure is the internal crack of the particle, which is composed of two small particles of different sizes. The different cohesive force between small particles and the initial crack in the cohesive particles is set to a smaller bond strength. In Figure 3(b), the different colors, lengths, and thicknesses of the link bar indicates the different bond strength of bond keys.
The bonding surface of the initial crack in the material is easily broken owing to the mechanical properties of rock. We determine a set of appropriate parameters through the impact crushing experiment and simulation experiment. The type and value of the contact model parameters are shown in Table 3.
| Contact type | BPM parameter type | Values |
|---|---|---|
| Red-dark green | Normal stiffness per unit area (N/m3) | 6e + 11 |
| Shear stiffness per unit area (N/m3) | 3e + 11 | |
| Critical normal stress (Pa) | 8e + 6 | |
| Critical shear stress (Pa) | 4e + 6 | |
| Bonded disk radius (mm) | 0.6 | |
| Blue-light green green-brown | Normal stiffness per unit area (N/m3) | 6e + 11 |
| Shear stiffness per unit area (N/m3) | 3e + 11 | |
| Critical normal stress (Pa) | 7e + 6 | |
| Critical shear stress (Pa) | 3.5e + 6 | |
| Bonded disk radius (mm) | 0.6 | |
| Pink-black | Normal stiffness per unit area (N/m3) | 6e + 11 |
| Shear stiffness per unit area (N/m3) | 3e + 11 | |
| Critical normal stress (Pa) | 6e + 6 | |
| Critical shear stress (Pa) | 3e + 6 | |
| Bonded disk radius (mm) | 0.6 | |
2.4. Impact Crushing Experiment Platform
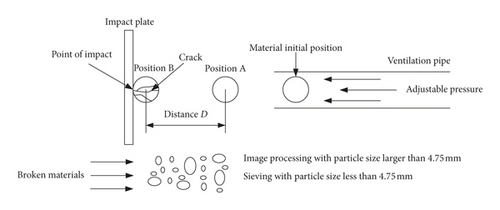
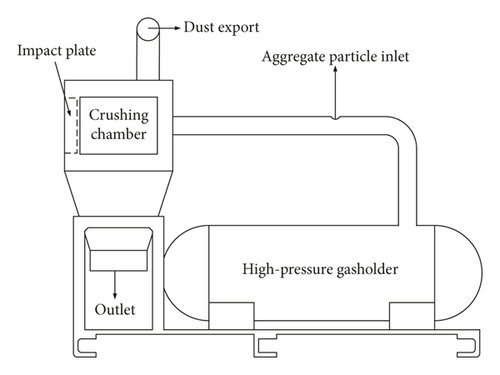
Figure 4 shows a schematic of the single-particle impact crushing experiment. The material particles are accelerated by high-pressure gas and impact a stationary plate. We obtain the required particle impact velocity by adjusting the pressure. The impact velocity is calculated using a high-speed camera to measure the distance between points A and B and the time difference between the two frames. After collecting the crushed material, the size distribution is obtained. For material less than 4.75 mm in diameter, standard sieves are used to screen the distribution of particle sizes. For larger particles, a video size-detection system is used. The impact simulation experimental device is shown in Figure 5. In the experimental device, the MROM110 CMOS high-speed camera and the MACRO100F2.8D manual focus lens are used. The shooting rate can reach 10,000 frames/s, which can fully capture the position information of high-speed shot particles. Since the camera′s light-receiving rate is relatively low at high resolution, a carbon lamp is added to fill the camera to achieve a clear speed image. The light source used in this test is a 1000 W carbon lamp. The high-pressure gas in the high-pressure gasholder is equivalent to the power system of the experimental device, and the limestone driven by the high-pressure gas is sufficiently accelerated in the acceleration pipeline to enter the crushing chamber and hit the impact plate of the crushing chamber at a higher linear velocity. The impact plate has a speed acquisition window on the surface of the crushing chamber and is sealed with bulletproof glass. The speed of the limestone particles before impact can be calculated from the pictures taken by the high-speed camera. The aggregated particles can also be collected efficiently after crushing. The crushed particles are collected and processed by a combination of mechanical screening and image processing to calculate the mass distribution and the true crush ratio of the particle size interval.
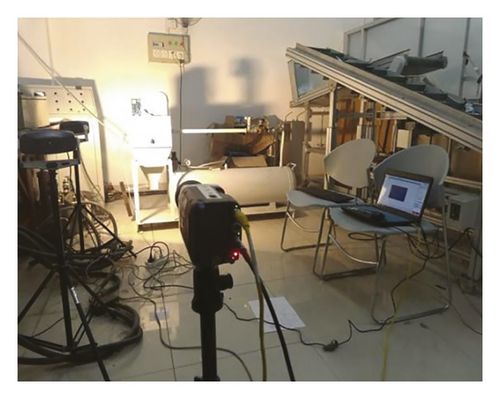
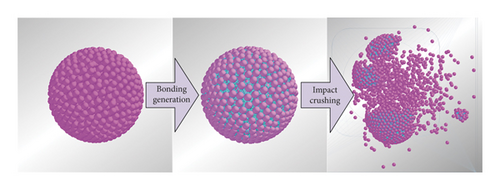
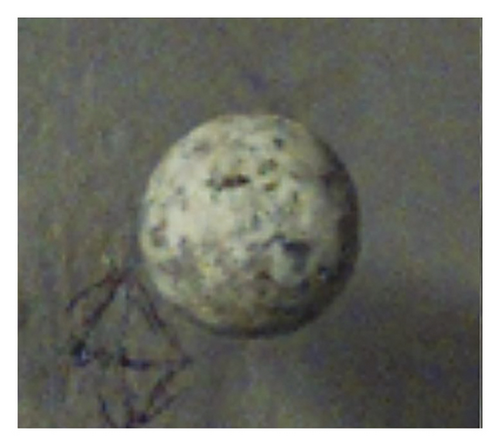
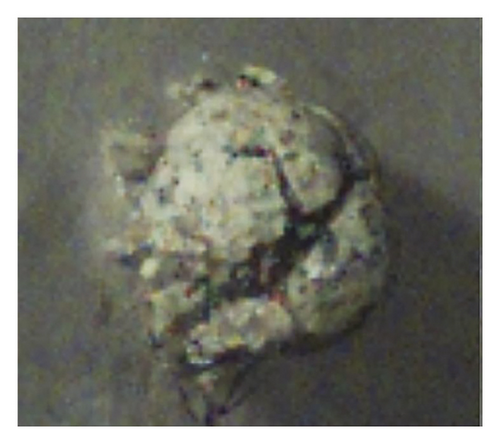
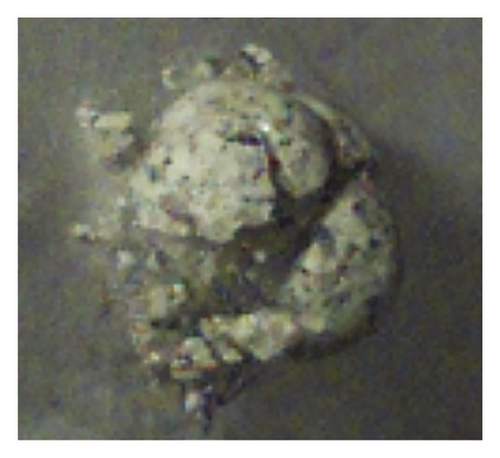
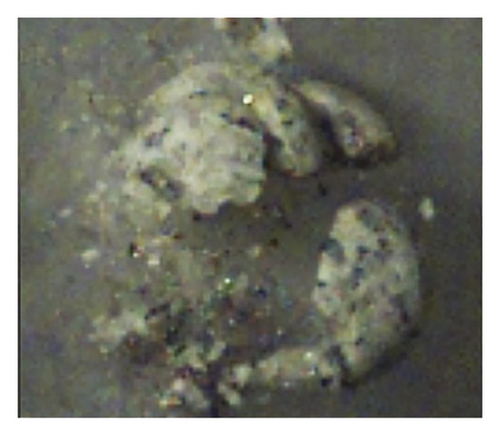
In this paper, we construct cohesive-particle models using a variety of bond-key combinations based on previous research on the parameters of a single bond key. DEM is used to simulate impact experiments with different velocities and different particle sizes. The simulation of the impact process is shown in Figure 6. The 15 mm model cohesive particle with internal initial crack and microstructure is impacted at different velocities, and an image size-detection system is used to measure the distribution of particles size after crushing. In addition, at 45 m/s, different sizes of limestone cohesive particles are modeled and the experiment is repeated. The limestone material with a particle size of about 15 mm is rounded, and then a single-particle active impact crushing experiment is performed. A limestone crushing process is recorded using a high-speed camera (Figure 7).
3. Results and Discussion
3.1. Simulation and Experimental Analysis of Different Impact Velocities
We accelerate the 15 mm single-particle limestone material with different air pressures to reach the desired impact velocities. We then observe the particle-size distribution after crushing and analyze the degree of fragmentation and crushing effect. After 10 crushing experiments, we take the crushed limestone and calculate the grain mass proportions using sieve screening and the image size-detection system. The DEM simulation is used to count the bonded-particle aggregate after each particle is completely crushed. The cohesive particles’ model diameter of the simulation experiment is 15 mm. The particle-size fractions are determined using image processing.
3.1.1. Effect of Impact Velocity on Particle-Size Distribution after Crushing
Impact velocities of 20 m/s, 30 m/s, 40 m/s, and 50 m/s are used to crush materials with similar particle sizes, and the granularity characteristics are analyzed. With increasing impact velocity, particles are broken further. The characteristics of the particle-size distribution are analyzed.
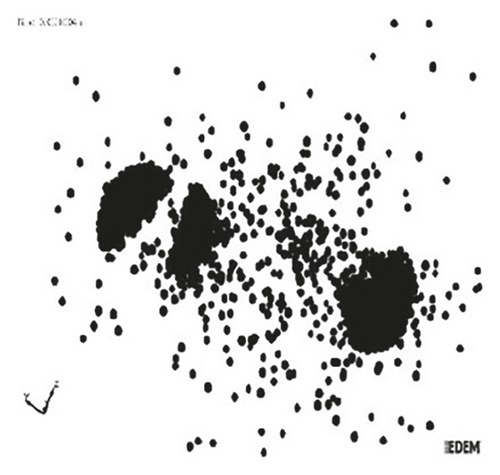
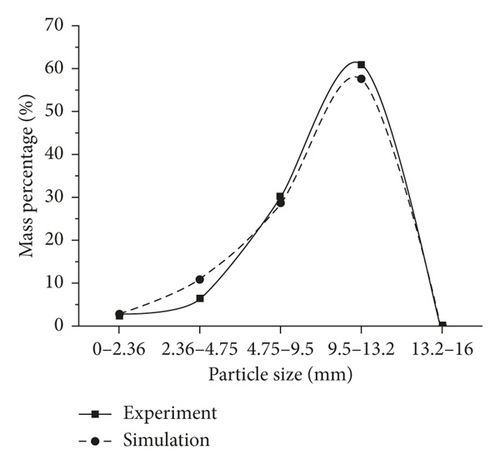
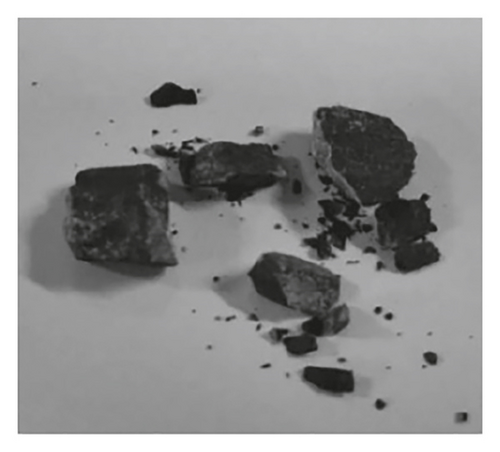
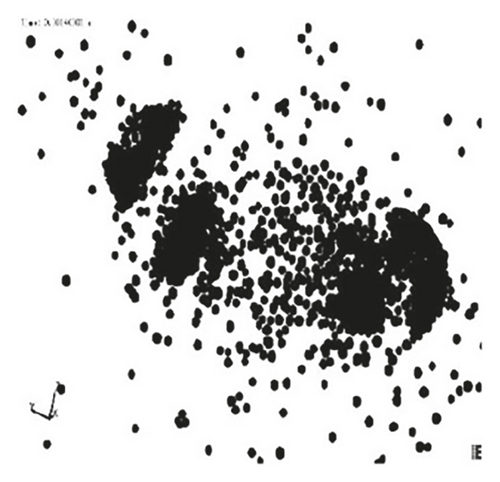
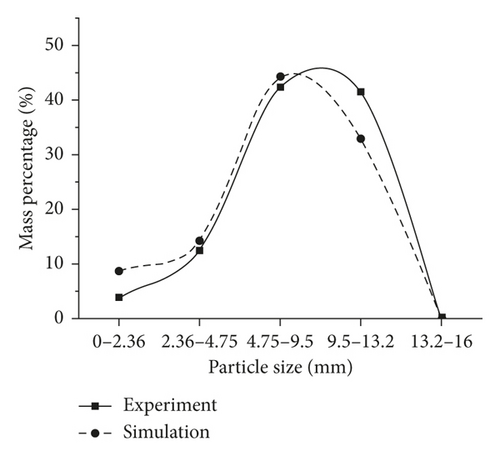
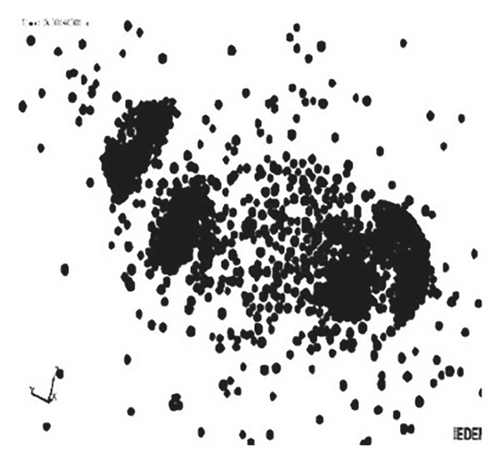
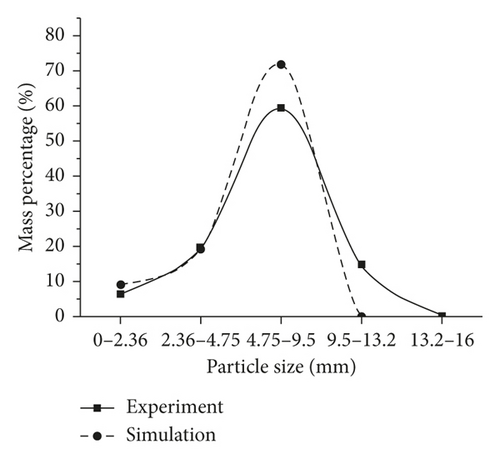
For impact velocity 20 m/s, ore particles break from the middle into two pieces. When impact velocity is increased to 30 m/s, the particles break into 3-4 parts. For impact velocity 40 m/s, the particles break into 4-5 parts. The particle-size distribution of the simulated fracture is close to the real crushing condition, so the internal structure of the initial microstructure and the crack of our particle model simulates the impact crushing process well. For impact velocity 50 m/s, the particles break into 7-8 parts, similar to the simulation. The particles with particle size 4.75–13.2 mm accounts for the majority; fewer particles are <2.36 mm or >13.2 mm in diameter. The particle-size distribution curve is close to a normal distribution. When the particle size is almost the same, Figures 8–11 show that the morphology of the broken material is similar. With increasing impact velocity, the particle-size distribution curve is skewed to the left overall, the grain size is decreased, and the particle-size distribution curve is closer to a normal distribution after breaking. The simulation results are close to the experimental results.
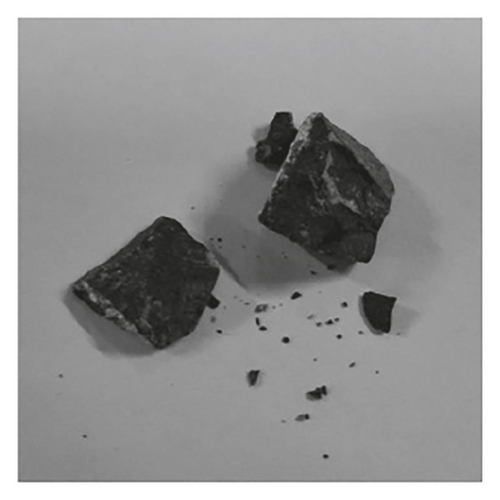
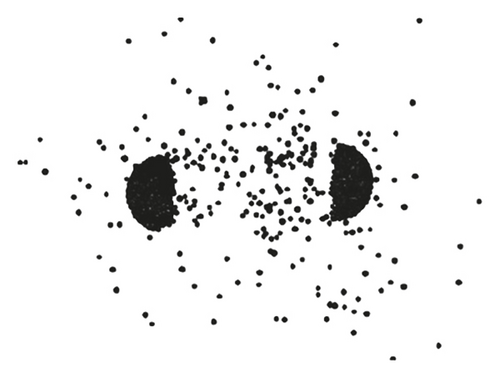
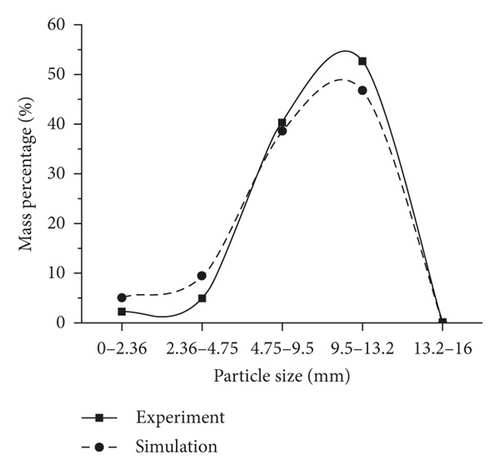
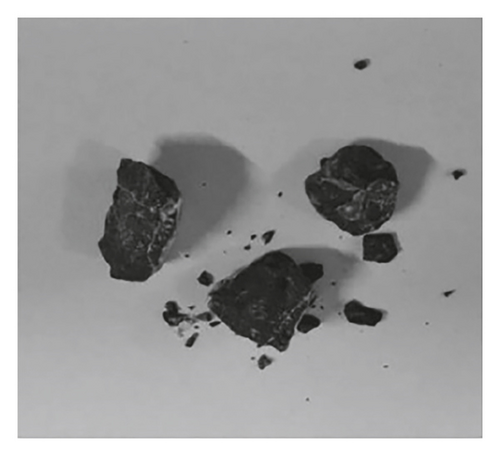

3.1.2. Effect of Impact Velocity on Crushing Ratio and Sand Forming Rate
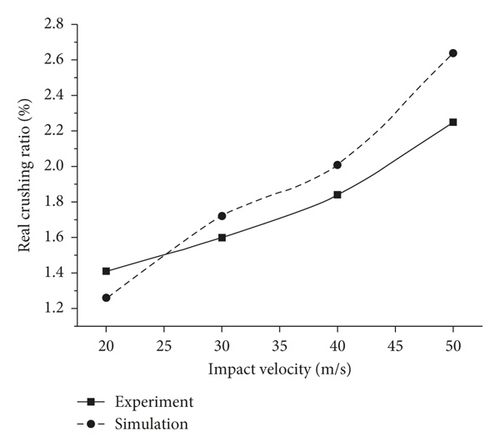
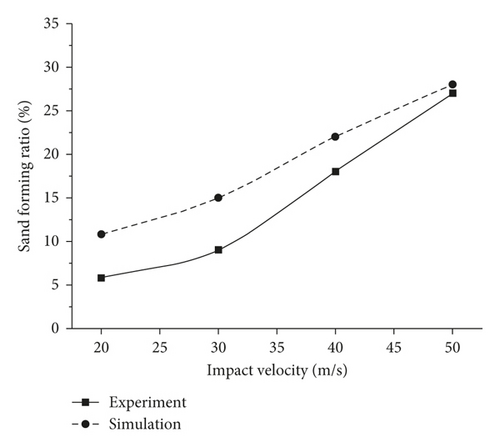
Figure 12 shows the comparison of experimental and simulation real crushing ratios for limestone of particle size 15 mm at an impact velocity of 20–50 m/s. The average particle size of the ore materials for the experiment and the simulation was obtained by the weighted arithmetic average method and used to calculate the real crushing ratio. With increasing impact velocity, the real crushing ratio and sand forming ratio increases proportionally. This relationship has the same trend for simulation and experimental results. This shows that the establishment of the internal initial crack and the microinterface of the particle model are reasonable.
3.2. Simulation and Experimental Analysis of Different Particle Sizes
For dynamic loads such as impact crushing, the initial particle size has a significant effect on the physical properties of the particles, which are nonuniform solids with many internal cracks. The random distribution of the cracks determines if the local macroscopic strength of the particle is less than the nominal strength. The larger the particle, the more the internal cracks, and the more likely it is to be damaged owing to a weak point.
3.2.1. Effect of Particle Size on Particle-Size Distribution after Crushing
In the DEM simulation, 10 mm, 14 mm, 18 mm, and 22 mm balls are accelerated to 45 m/s to make their unit impact crushing energy consistent. Using statistical methods, we analyze and compare the particle-size distributions after crushing as shown in Figures 13–16.
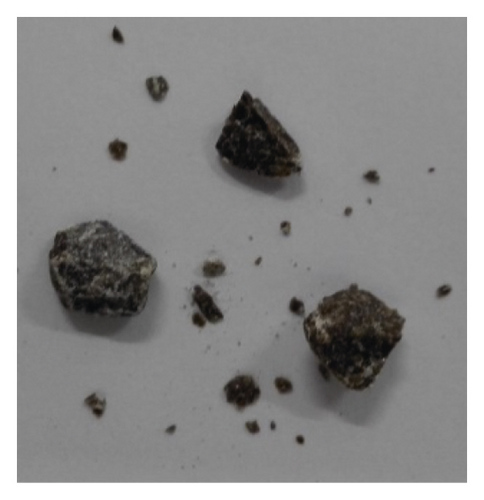
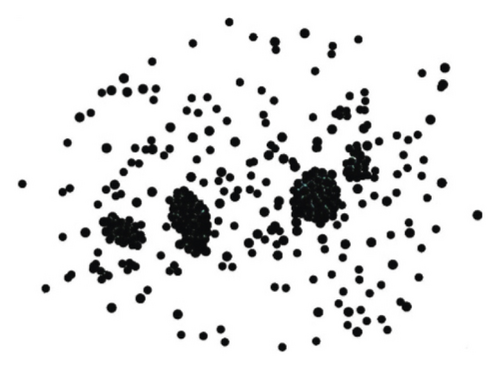
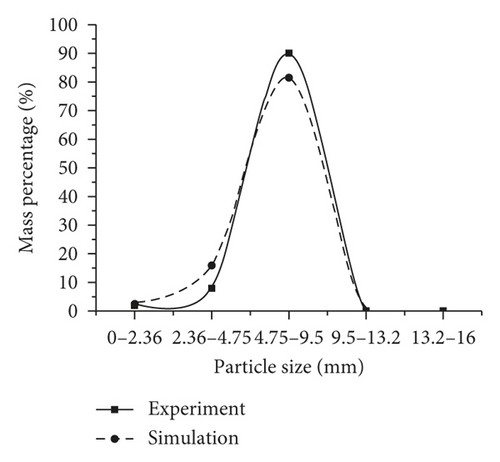
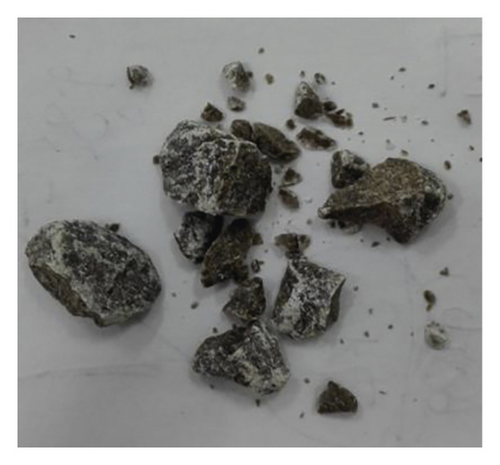
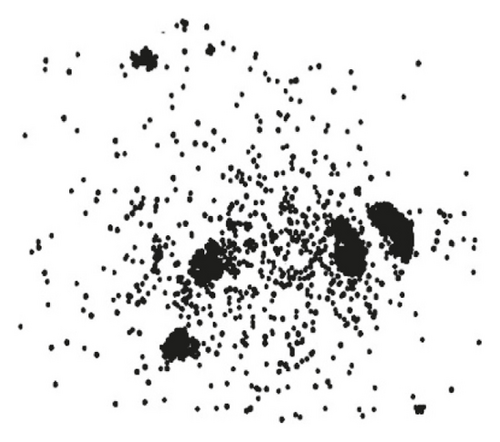
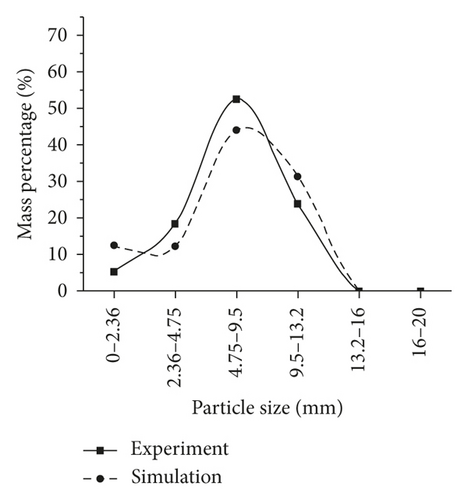
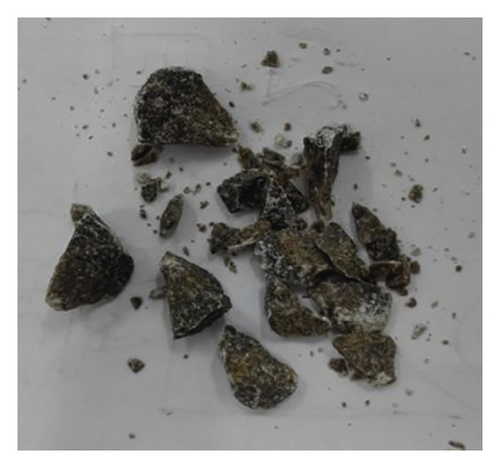
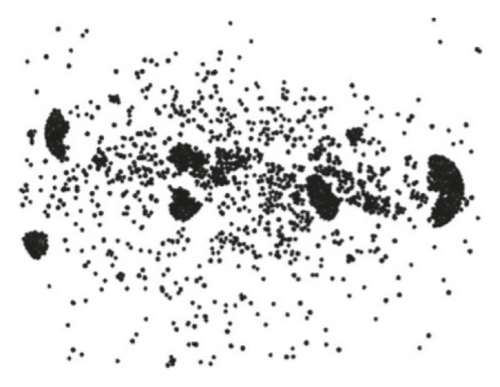
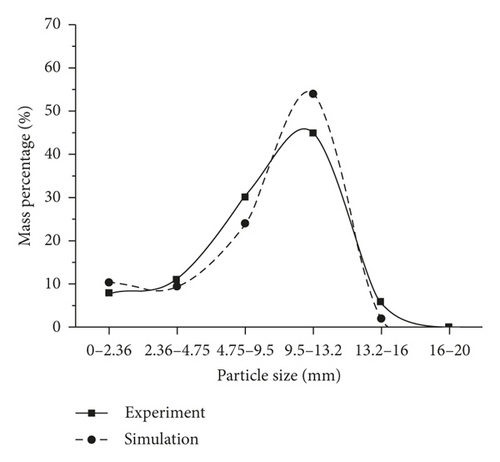
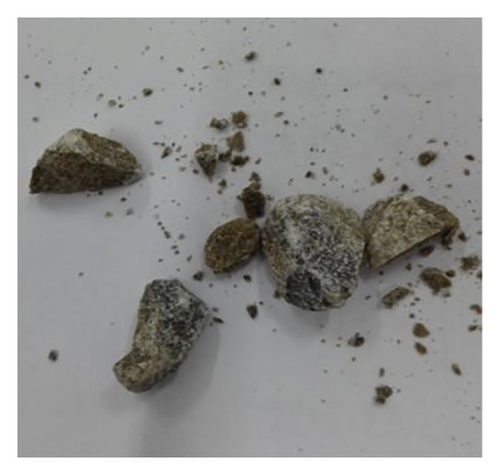
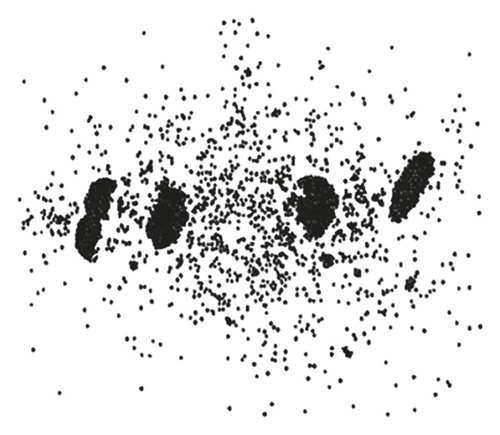
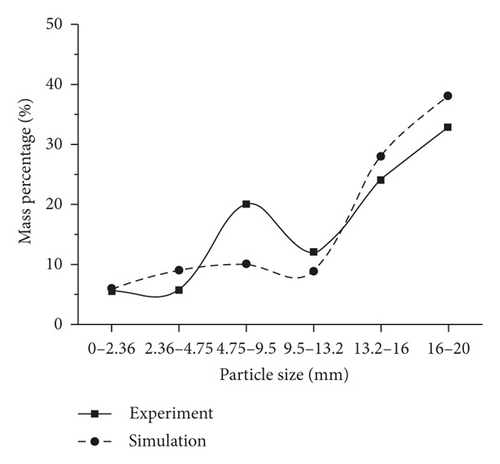
In the experiment, for the 14 mm material particle size, the material breaks into 4-5 parts, similar to the simulation results. At impact velocity 45 m/s, particle size 4.75–13.2 mm accounts for most material, and fewer particles have diameters >13.2 mm or <2.36 mm. Figures 13–16 show the particle-size distribution curve after experiment and simulation under the same impact velocity. When unit impact crushing energy of the material is kept constant, the particle-size distribution curve is shifted to the right as the particle size increases, the fine aggregate gradually decreases, the larger particle size increases, and the probability density curve after crushing tends to a normal distribution. This simulation result is similar to the experimental result.
3.2.2. Effect of Particle Size on Crushing Ratio and Sand Forming Rate
To investigate the relationship between particle-size distribution and particle size after impact crushing, the present study uses experimental and DEM simulation data. Limestone single particles with diameter 10–22 mm are used in the impact crushing experiment at the same velocity, to maintain constant unit impact crushing energy. From the experiment and simulation results, we obtain the average particle size of the crushed material and calculate the crushing ratio. The curve relationship between the crushing ratio and the particle size is established; the results are shown in Figure 17(a). To calculate the broken sand ratio, we establish the particles size and sand ratio curve and compare with the results of the impact crushing experiment as shown in Figure 17(b).
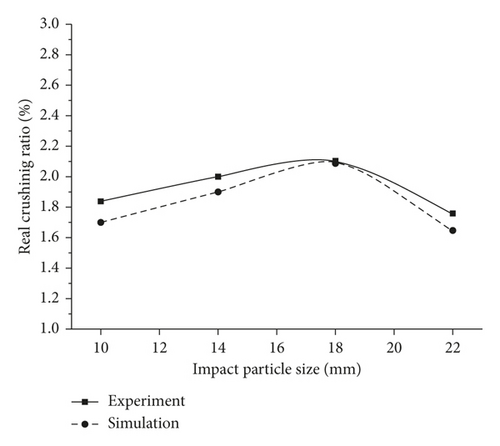
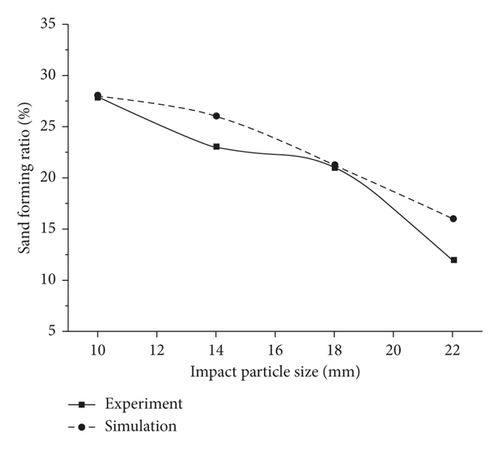
Figure 17(a) shows the comparison of experimental and simulated crushing ratios of 10–22 mm limestone particles at 45 m/s. The average particle size for the experiment and the simulation was obtained using the weighted arithmetic average method and used to calculate the crushing ratio. As particle size increases, the crushing ratio first increases to a maximum and then decreases. Figure 17(b) shows the inverse proportional relationship between the percentage of sand formation and the particle size of materials after crushing. The trend is the same for both the simulation and the experiment, showing that the particle model with the internal initial crack and microstructure is reasonable.
4. Conclusions
- (1)
The proposed model can simulate the internal defects of rock materials, and the strength can be adjusted according to different materials. The model is suitable for the impact fracture of anisotropic brittle materials and is a modification of the bonded particle model.
- (2)
For constant particle size, there is a linear relationship between impact velocity and crushing ratio. Sand formation rate increases as impact velocity increases.
- (3)
Up to a certain impact velocity, there is an optimum particle size, which has the highest degree of fragmentation and the maximum crushing ratio.
- (4)
For constant unit impact crushing energy, there is an approximate inverse relation between sand formation rate and particle size. The entire particle-size distribution curve is shifted to the right with the increasing particle size. The proportion of fine aggregate to larger particles gradually decreases.
The cohesive-particle model with internal microinterfaces and cracks is feasible for simulating the impact crushing process of limestone particles. The DEM has an important application value in the simulation of material fragmentation and is used as the basis for a new method for further research on the efficiency of impact crushing, consumption of crushing energy, and material characteristics after crushing.
Conflicts of Interest
The authors declare that there are no conflicts of interest regarding the publication of this paper.
Acknowledgments
This work was financially supported by the International Science and Technology Cooperation and Exchange Program in Fujian Province (2018I1006), Major Project of Industry-University-Research Cooperation in Fujian Province (2016H6013), and the Subsidized Project for Cultivating Postgraduates’ Innovative Ability in Scientific Research of Huaqiao University (1611403006). The project received research start-up fee from Huaqiao University (17BS305) and Fujian Natural Science Foundation Project (2017J01108).
Open Research
Data Availability
The data used to support the findings of this study are included within the article.


