Experimental Analysis of a Small-Scale Rotor at Various Inflow Angles
Abstract
The performance characteristics of a rotor that is typically used for small unmanned aircraft were analyzed in a series of wind-tunnel experiments. Wind-tunnel measurements were conducted with the rotor at various inflow angles in order to investigate the effects on the rotor performance of partially or fully edgewise flow as they are typically encountered with small multirotor vehicles. Rotor tests were also performed under static and fully axial flow conditions in order to investigate the aerodynamic performance during hover as well as vertical climb and descent. The wind-tunnel data were corrected to account for the interference of wind-tunnel walls with the rotor wake and the blockage due to the presence of the rotor test stand in the wind-tunnel test section. The results are presented in terms of thrust, power, and roll moment coefficients under different rotor rotational speeds for a T-motor 18x6.1. Additionally, the measured thrust and power coefficients of Master Airscrew Electric 11x7 are compared with available propeller data under static and axial flow conditions for verification purposes. It is shown that the rotor performance characteristics are strongly affected by the freestream advance ratio and the freestream inflow angles. For example, at inflow angles that are typical for multirotor vehicles between about 15° and 0° with respect to the rotor disc, thrust coefficients stay constant or grow with increasing advance ratio, whereas power coefficients remain relatively constant with changing advance ratio.
1. Introduction
Multirotor unmanned aircraft have demonstrated their potential for diverse applications that include military, civilian, and commercial remote sensing missions. Their ability to takeoff vertically, hover, transition quickly between forward flight and hover, and precisely maneuver within confined spaces make small multirotor vehicles well-suited for applications for which many fixed-wing unmanned aerial vehicles (UAVs) are unsuitable. Generally, small multirotor aircraft rely on multiple fixed-pitch rotors to generate lift and thrust loads that are required for their advanced flight control and navigation systems. Subsequently, these vehicles have unique abilities for undertaking missions that human-piloted aircraft often are unable to accomplish efficiently and safely [1]. The flight characteristics and dynamics of small multirotor vehicles, however, are greatly impacted by the aerodynamics of their rotors [2, 3]. Thus, in order to further improve the efficiency and utility of small multirotor vehicles, the aerodynamic characteristics of small rotors need to be thoroughly understood for the different flight conditions that these vehicles encounter and that differ significantly from traditional propeller aerodynamics with largely axial inflows.
Although stability and control modeling of small multirotor vehicles have received significant attention (e.g., [4, 5]), the rotor aerodynamics of these vehicles have only been studied to a limited degree. Most of the studies in this field have been constrained to investigations of static and axial flow conditions. Brandt and Selig [6] tested 79 propellers of different diameters ranging from 9 to 11 in (22.9 to 27.9 cm) under static and axial flow conditions. They reported thrust and power coefficients as well as propulsive efficiencies of the propellers in terms of the advance ratio for different rotational speeds. Similar experimental results were reported for various low-Reynolds-number propellers with applications to unmanned aerial vehicles in references [7–13]. Additionally, a number of studies have proposed prediction models for evaluating the performance of low-Reynolds-number rotors under static and axial flow conditions. However, these prediction models need to be tuned in order to account for low-Reynolds-number effects. The adjustments of the prediction models are commonly performed by comparing the results with those obtained from experimental measurements [14]. For instance, McCrink and Gregory [15] presented a model based on blade element momentum theory (BEMT) with several corrections for predicting the performance of low-Reynolds-number propellers. The BEMT model was validated using wind-tunnel measurements. Lee et al. [16] developed and experimentally validated a source-doublet panel method to investigate effects of different design parameters on the hovering performance of coaxial rotors.
A few studies have also investigated the performance of small rotors at various angles of attack. Theys et al. [17, 18] performed wind-tunnel measurements on Graupner E-9x5 rotor to obtain aerodynamic forces and moments at various angles of attack, rotor rotational speeds, and freestream velocity. The experimental results were also used to validate BEMT and vortex lattice model that were developed for small rotors [18]. Carroll et al. [19] presented a hybrid optimization-aerodynamic scheme for the efficient design of the rotor geometric characteristics. The aerodynamic model was based on BEMT and included a nonuniform inflow model. The rotor performance prediction method was validated against experimental results that were taken at various angles of attacks and freestream velocities. Khan and Nahon [20] coupled a BEMT model with an inflow model in order to predict aerodynamic forces and moments of a rotor under hover, vertical, and forward flight conditions. The validity of the model was demonstrated using experimental measurements. These studies have invariably shown that rotor aerodynamics of small rotorcraft systems are significantly affected by low-Reynolds-number flows, which requires a deep understanding due to the boundary layer transition [21].
From the review of the literature conducted on aerodynamic analysis of small-scale rotors, it became apparent that wind-tunnel test data have been reported for numerous propellers under axial flow condition (e.g., [6–13]). Wind-tunnel measurements under edgewise flow conditions, however, have been reported only for a small rotor in studies by Theys et al. [17, 18], as described earlier. The present study aims at exploring the aerodynamic performance of small-scale rotors under various inflow angles through a series of wind-tunnel experiments. For this purpose, a three degree-of-freedom rotor test stand was built and placed in the test section of the Ryerson University’s wind tunnel in order to measure thrust, torque, and roll moment of several rotor designs. The test stand was placed on a turntable to allow the measurement of the rotor loads at inflow angles ranging over 360 degrees. The measurements were performed to evaluate the performance of rotors under static, vertical climb, and descent as well as edgewise flight conditions for different rotor rotational speeds. The measurements were corrected to account for the effects that are due to the constraints of a closed wind tunnel and the presence of the test stand in the test section. The results are presented for two different rotors, namely, the Master Airscrew Electric 11x7 and the T-motor 18x6.1. The results of the former are compared with those reported in reference [6] under static and axial flight conditions. The latter was assessed for its thrust, power, and roll moments under static, axial and forward flight conditions. Besides providing insight into small rotor aerodynamics, the subsequently derived experimental data provides a source of data that is suitable for the validation of small-scale rotor prediction methods.
During the wind-tunnel experiments, thrust, power, and roll moment were acquired. Thrust is the aerodynamic force that the rotor develops perpendicular to its rotational plane. In the case of multirotor vehicles, rotor thrust provides the loads to compensate for the vehicle weight and aerodynamic drag. In addition, thrust is essential for providing pitch and roll trim. Rotor power is the “penalty” of producing a required thrust. In addition, the associated torque is often used for yaw control of many multirotor vehicles. The roll moment of the rotor is a by-product during forward flight when the rotor experience significant edgewise inflow components and advancing/retreating blade effects become significant. The roll moment is primarily of control interest. Not acquired in the herein discussed experiments are additional loads that are also closely related to advancing flight with significant edgewise inflow components, in particular, the rotor drag and side force as well as its pitching moment. Nevertheless, the measured quantities allow the development and validation of theoretical models that will subsequently enable the prediction of the remaining quantities.
2. Methodology
2.1. Experimental Setup
The rotor tests were conducted in the Ryerson University’s subsonic closed-circuit wind tunnel that is shown in Figure 1. The wind tunnel has a contraction ratio of 3.2 that is before the rectangular test section, which has a cross-section of 0.9 m × 0.9 m and a length of 1.5 m and is equipped with corner fillets. Turning vanes redirect the flow at each corner in order to maintain relatively straight flow throughout the circuit and minimize losses. Three antiturbulence screens that are installed in the settling chamber reduced the turbulence level in the test section.

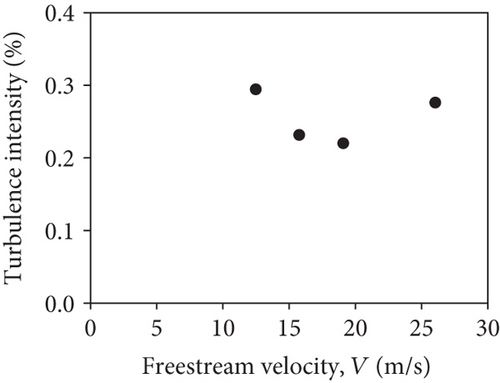
The airspeed in the tunnel is controlled by adjusting the rotational speed of a 200 hp electric motor that drives a 1.23 m diameter fan. The airspeed can reach to a maximum of 60 m/s in the empty test section, although the tunnel was operated at speeds up to 25 m/s for the present study. The freestream velocity in the test section was determined by measuring the pressure drop in the contraction section using an Omega PX277 differential pressure transducer. The ambient pressure was measured using a Validyne P55A pressure transducer, while the air temperature was measured using a LabJack EI-1034 temperature probe that was located in the test section after the test stand. Hotwire anemometry tests were initially conducted to examine the quality of the airflow in the empty test section. As shown in Figure 2, the turbulence intensity is less than 0.29% for the freestream velocities considered in this study. The data was taken using a single-sensor hotwire probe that was placed at the center of the wind tunnel cross-section and connected to a Dantec Dynamics MiniCTA system in order to measure the turbulence intensity. The hotwire data was acquired at a sampling rate of 10,000 Hz. The turbulence intensity could be measured only at the center of the test section due to limitations of the current setup. Figure 2, however, can provide a good estimate of the level of turbulence in the wind tunnel.
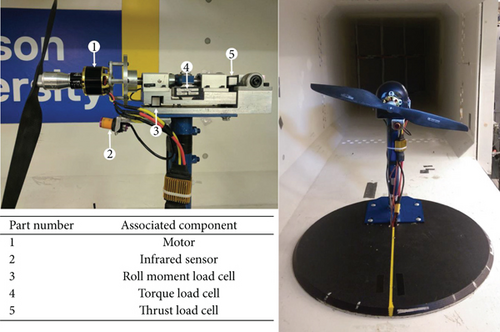
In order to assess the rotor performance during in-flight conditions, a three degree-of-freedom rotor test stand and data collection apparatus were built. The test stand is shown in Figure 3. It consists of a Scorpion SII-4020-420KV brushless motor with a Scorpion Commander 50 V 90A ESC (OPTO) speed controller for driving the rotors. Thrust, torque, and roll moment were measured using three low-profile load cells that were connected to an 8 in steel shaft. The shaft was fixed to the brushless motor mount. The torque required by the rotor was measured using an A-Tech MLP-150 load cell, while two A-Tech MLP-50 load cells were employed for measuring the thrust and roll moment of the rotor. The entire shaft and load cell assembly were placed on an aluminium chassis and enclosed by a fiberglass cowling. The rotor rotational speed was measured using an E18-D80NK IR infrared sensor that measures the time between blade passages. The infrared sensor has a maximum response time of 2 ms. The test stand was mounted to the turntable in the test section, which allowed for the adjustment of the angle of attack. The electronic speed controller was attached to the stand support with its heat fins directed towards the freestream in order to ensure adequate cooling. The power was supplied to the brushless motor using an adjustable 1200 W 50 Amp AC/DC power supply. The power supplied to the brushless motor was controlled by Arduino UNO microcontroller running a custom-made throttle control program that was written in the Arduino Integrated Development Environment (IDE). The microcontroller was connected to a laptop, which allowed the user to run the IDE terminal and input a throttle setting in percentage. The load cells were connected to Omega DMD-460 load cell conditioners, which were in turn connected to a LabJack T7 data acquisition system (DAQ). The data were collected using LabJack LJLogM software at a sampling rate of 1000 Hz for 8 seconds.
2.2. Testing Procedure
Before each rotor test campaign, the load cells were calibrated using a pulley system and known weights. For the calibration of the thrust load cell, different known weights were axially applied to the load cell in order to obtain the linear relationship between the thrust and the output voltage of the load cell. In a similar manner, the linear calibration relations for the torque and roll moment load cells were obtained by applying different moments using known weights and moment arms. No noteworthy cross-coupling was observed between the load cells. The calibration relations of the load cells were adjusted to reflect the tare loads. Furthermore, the load cells were calibrated according to the ranges of loads that were expected to be measured. For the ambient pressure transducer and test-section temperature sensor, manufacturer-supplied calibrations were employed. The differential pressure transducer in the contraction section was calibrated using the dynamic-pressure measurements of a pitot-static tube that was installed in the empty test section.
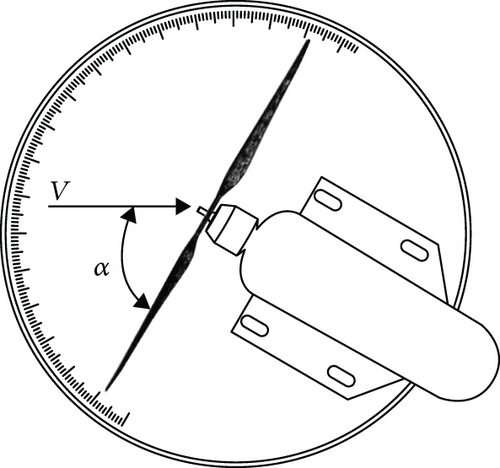
Prior to attaching the rotors, the base loads of the test stand were recorded at different airspeeds and angles of attack. These base-load measurements were then employed to correct thrust, torque, and roll moment of the rotors. Performance data of the rotors were collected at various airspeeds up to about 25 m/s or the windmill-brake state while the rotor rotational speed was kept nearly constant by slightly adjusting the throttle of the brushless motor. Measurements were also carried out in static conditions with the tunnel off, which represent the rotor loads in hover. In general, the rotor tests were performed for three different rotational speeds: 3000 rpm, 4000 rpm, and 5000 rpm. The effects of the different flight conditions on the rotor performance were investigated by measuring thrust, torque, and roll moment at various rotor-inflow angles ranging from 90° to −90°. As shown in Figure 4, the angles of attack of 90° and −90° correspond to the freestream being normal to the rotor disc, which are associated with the rotor in a vertical climb and descent, respectively. The angle of attack 0° is associated with the case of the rotor during edgewise flight.
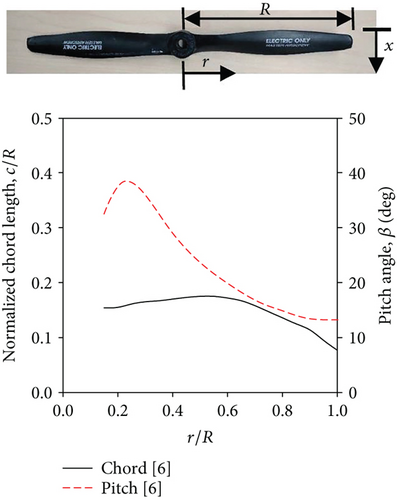
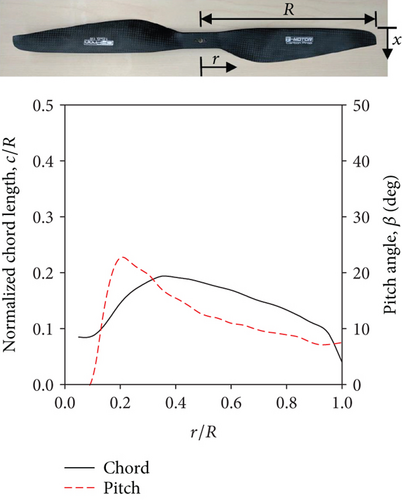
Measurements were performed for several rotor designs in order to investigate the effects of the rotor profile and diameter on the thrust, power, and roll moment. The results are presented for two different rotors. The geometric characteristics of the Master Airscrew Electric 11x7 (11 inches in diameter with 7 inches of pitch) and the T-motor 18x6.1 (18 inches in diameter with 6.1 inches of pitch) are shown in Figures 5 and 6, respectively. The variations in normalized chord length, c/R and blade pitch angle, β, across the length of the blade for the Master Airscrew Electric 11x7 are taken from reference [6]. The T-motor 18x6.1 characteristics were determined using a digital scan of a commercially acquired rotor. The normalized coordinates of the cross-section of the T-motor are listed in Table 1.
| x/c | z/c | x/c | z/c | x/c | z/c | x/c | z/c | x/c | z/c |
|---|---|---|---|---|---|---|---|---|---|
| 1 | -5.90E-05 | 0.62586 | 0.063227 | 0.082348 | 0.047796 | 0.073038 | −0.02082 | 0.593057 | 0.018583 |
| 0.993762 | 0.001211 | 0.611869 | 0.064811 | 0.06975 | 0.044035 | 0.089175 | −0.01976 | 0.604277 | 0.018854 |
| 0.98398 | 0.003171 | 0.599353 | 0.066157 | 0.058953 | 0.040365 | 0.104675 | −0.01846 | 0.621039 | 0.01919 |
| 0.973638 | 0.005203 | 0.586064 | 0.067515 | 0.049118 | 0.036592 | 0.120382 | −0.017 | 0.637036 | 0.019418 |
| 0.962682 | 0.007315 | 0.570191 | 0.069041 | 0.039745 | 0.03251 | 0.137182 | −0.01533 | 0.653063 | 0.019543 |
| 0.951065 | 0.009547 | 0.553528 | 0.070536 | 0.0315 | 0.028378 | 0.153638 | −0.01363 | 0.669833 | 0.019569 |
| 0.938732 | 0.011901 | 0.536975 | 0.071913 | 0.025091 | 0.024644 | 0.170088 | −0.0119 | 0.686265 | 0.019507 |
| 0.925646 | 0.014389 | 0.520443 | 0.073179 | 0.020206 | 0.021328 | 0.18691 | −0.01013 | 0.699591 | 0.019399 |
| 0.911788 | 0.017007 | 0.503867 | 0.074331 | 0.01615 | 0.018087 | 0.203707 | −0.00837 | 0.71197 | 0.019252 |
| 0.897174 | 0.019757 | 0.48704 | 0.075378 | 0.012819 | 0.014883 | 0.220532 | −0.00662 | 0.724343 | 0.019061 |
| 0.881868 | 0.022622 | 0.470124 | 0.076301 | 0.010331 | 0.01194 | 0.237505 | −0.00488 | 0.730378 | 0.018951 |
| 0.866005 | 0.025568 | 0.453783 | 0.077064 | 0.008616 | 0.009405 | 0.254456 | −0.00316 | 0.736413 | 0.018831 |
| 0.849787 | 0.028557 | 0.437789 | 0.077687 | 0.007439 | 0.007161 | 0.264982 | −0.0021 | 0.753193 | 0.018441 |
| 0.833471 | 0.031534 | 0.421586 | 0.078188 | 0.006629 | 0.005115 | 0.27539 | −0.00107 | 0.769949 | 0.017958 |
| 0.817262 | 0.034451 | 0.405111 | 0.078562 | 0.006092 | 0.003261 | 0.290221 | 0.000374 | 0.786569 | 0.01737 |
| 0.801191 | 0.037292 | 0.38873 | 0.078793 | 0.005772 | 0.001723 | 0.299596 | 0.001267 | 0.803542 | 0.016644 |
| 0.785122 | 0.040073 | 0.372412 | 0.078872 | 0.005595 | 0.0005 | 0.308913 | 0.002138 | 0.816857 | 0.015982 |
| 0.775937 | 0.041631 | 0.356134 | 0.078794 | 0.005526 | −0.00073 | 0.323889 | 0.003495 | 0.830156 | 0.015243 |
| 0.766753 | 0.043164 | 0.339676 | 0.078544 | 0.005551 | −0.00185 | 0.332385 | 0.004237 | 0.841992 | 0.014523 |
| 0.751247 | 0.045695 | 0.322771 | 0.078104 | 0.005669 | −0.00304 | 0.340595 | 0.004931 | 0.853848 | 0.013745 |
| 0.735674 | 0.048161 | 0.310395 | 0.077662 | 0.005885 | −0.00427 | 0.356181 | 0.006191 | 0.86978 | 0.012625 |
| 0.726981 | 0.049505 | 0.297726 | 0.077105 | 0.006703 | −0.0055 | 0.372306 | 0.007421 | 0.885074 | 0.011467 |
| 0.718312 | 0.050821 | 0.284726 | 0.076426 | 0.008162 | −0.00704 | 0.388606 | 0.008602 | 0.899681 | 0.010291 |
| 0.703238 | 0.053048 | 0.272056 | 0.075657 | 0.009725 | −0.00857 | 0.404953 | 0.009731 | 0.913591 | 0.009104 |
| 0.695245 | 0.054199 | 0.255876 | 0.074518 | 0.011464 | −0.01004 | 0.421548 | 0.010824 | 0.926815 | 0.007905 |
| 0.687161 | 0.055341 | 0.239958 | 0.07322 | 0.013711 | −0.01161 | 0.437858 | 0.011844 | 0.939376 | 0.006677 |
| 0.68263 | 0.055971 | 0.223712 | 0.071703 | 0.015689 | −0.0128 | 0.454036 | 0.012794 | 0.951316 | 0.005469 |
| 0.678159 | 0.056586 | 0.207174 | 0.06995 | 0.01765 | −0.01384 | 0.470494 | 0.013701 | 0.962675 | 0.004284 |
| 0.670097 | 0.057677 | 0.191223 | 0.068044 | 0.020194 | −0.01501 | 0.487181 | 0.014563 | 0.973494 | 0.003107 |
| 0.664231 | 0.058456 | 0.175348 | 0.065931 | 0.023664 | −0.01636 | 0.503663 | 0.015355 | 0.983811 | 0.00193 |
| 0.658925 | 0.059151 | 0.159064 | 0.063525 | 0.028127 | −0.01776 | 0.51998 | 0.016078 | 0.993667 | 0.000743 |
| 0.653715 | 0.059823 | 0.143016 | 0.060902 | 0.033371 | −0.01901 | 0.536563 | 0.016748 | 1 | −5.90E-05 |
| 0.648309 | 0.060507 | 0.127512 | 0.058101 | 0.039901 | −0.02009 | 0.553493 | 0.017372 | ||
| 0.642378 | 0.061247 | 0.112213 | 0.055031 | 0.048251 | −0.02089 | 0.567843 | 0.017853 | ||
| 0.635364 | 0.062102 | 0.096805 | 0.051544 | 0.05899 | −0.02121 | 0.581992 | 0.018282 |
2.3. Wind-Tunnel Corrections
Owing to the fact that flow conditions in a wind tunnel are not completely the same as those in free air, wind-tunnel test data need to be corrected to reflect the conditions experienced by the test model in an unbounded freestream. Three wind-tunnel corrections were employed in this study to account for the effects on the measured quantities of a rotor that was tested in a closed wind tunnel. These corrections account for solid blockage, base loads of the test stand, and interference with the walls of the test section.
The third correction considers the interference arising from the wind-tunnel test section walls. The interference factors for a vanishingly small rotor in a closed wind-tunnel test section may be obtained by representing the rotor wake as a skewed line of point doublets and using the method of mirror images [24]. For the rotor of a finite size, the rotor disc area can be discretized into small segments, each generating a portion of the rotor wake. Considering each partial wake as a doublet wake, interferences of all partial wakes can then be added at each control point on the test model in order to obtain a distribution of the wind-tunnel wall interference [25]. The average interference over the rotor disc is subsequently obtained by averaging the interferences at all control points [26].
The change in the angle of attack was negligible under axial flow conditions and also under edgewise flow at moderate to high advance ratios. A detailed analysis of the change in the angle of attack due to the wall interference is presented in Section 3.2.
2.4. Uncertainty Analysis
The TSM was employed to obtain uncertainties associated with all the parameters of the rotor tests. For this purpose, the uncertainty percentages associated with measuring devices were initially evaluated using the data sheets provided by the manufacturer of each device. These uncertainty percentages were associated with ambient pressure, freestream dynamic pressure, load cells, rotor rotational speeds, and temperature of the air in the test section. These uncertainties were then implemented in the TSM in order to obtain the uncertainty percentages associated with thrust, power, and roll moment coefficients as well as freestream advance ratio, namely , , , and (Uμ/μ). Table 2 summarizes the uncertainty percentages for present rotor tests. As can be seen from the table, the uncertainty percentages range from 1.11% for the freestream advance ratio to 2.15% for the rotor power coefficient.
| Parameter | Uncertainty (%) |
|---|---|
| Thrust coefficient, | 1.78 |
| Power coefficient, | 2.15 |
| Pitching moment coefficient, | 1.57 |
| Freestream advance ratio, Uμ/μ | 1.11 |
3. Results and Discussion
3.1. Comparison with Other Experimental Results
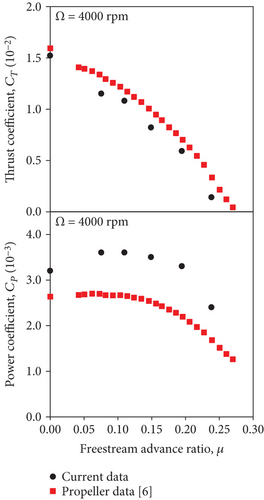
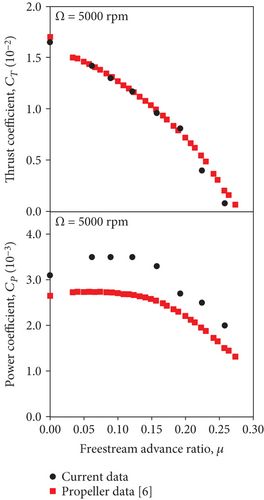
During the verification stage, the experimental results for the Master Airscrew Electric, MAE 11x7, are compared with the propeller test data that are reported in reference [6]. Figure 7 compares the thrust and power coefficients of the MAE 11x7 at 90° angle of attack with those values reported in the propeller data of reference [6] for rotor rotational speeds of 4000 and 5000 rpm. The current thrust data agree well with the reported values for both rotational speeds, whereas the power data show larger differences but similar trends. Otherwise, the data behaves as it is expected from typical small-scale propellers. The discrepancies between the current power data and those reported in reference [6] are most likely attributable to the different test facilities and instrumentation used in reference [6]. For example, reference [6] reported a turbulence intensity of less than 0.1% compared to less than 0.3% of the Ryerson facility. Higher turbulence intensity causes an early boundary layer transition, which means a larger part of the blade is covered by a turbulent boundary layer and experiences a higher aerodynamic drag. Higher turbulence intensity can also advance the onset of stall, leading to a higher drag load. Both effects, increased turbulent flow and earlier stall, increase profile power, which causes a higher total power required. Nevertheless, the results suggest that the rotor thrust decreases with an increase in freestream velocity, irrespective of the rotor rotational speed. The variations of rotor thrust coefficients with respect to the freestream advance ratio are almost in a parabolic manner for the rotor in a vertical climb. Moreover, the comparison of the thrust coefficients in Figures 7(a) and Figure 7(b) indicates that the thrust coefficients slightly increase with the increase in rotor rotational speed for a given advance ratio, which can be attributed to Reynolds-numbers effects as it impacts the high-lift region of the sections. In contrast to that, the rotor power coefficients are lesser effected by Reynolds-number effects. In general, the power coefficients remain almost constant for the low advance ratios. At advance ratios beyond 0.15, a further increase in freestream velocity, however, yields monotonic decrease of the rotor power coefficients as the thrust decreases before full windmill-brake state is reached.
3.2. T-Motor Performance Data
Static thrust and power coefficients of the T-motor 18x6.1 are presented in Figure 8. As can be seen from the figure, the thrust coefficients slightly increase with the rotational speed of the rotor, while the power coefficients remain constant with an increase in rotor speed. This suggests that the static rotor thrust exhibits a slight Reynolds-number dependency but is otherwise proportional to the square of the rotational speed of the rotor. With increasing rotational speeds, the section chord-Reynolds numbers increase, which results in higher maximum section-lift coefficients and benefits the inboard section near the hub of the rotor. Thus, a slight increase in static thrust is observed with increasing rotational speed. Power, however, shows very little dependency with Reynolds number and its coefficient remains largely constant with changing rotational speed.

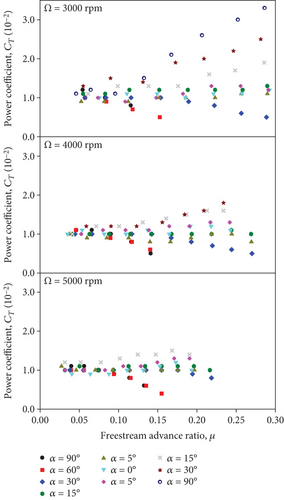
The variation of thrust coefficient with respect to the freestream advance ratio and at various angles of attack is shown in Figure 9 for three rotor rotational speeds of 3000 rpm, 4000 rpm, and 5000 rpm. The results are presented for inflow angles that range from +90° to −90° using the angle-of-attack convention of Figure 4. Henceforth, these inflow angles that are measured with respect to the wind-tunnel coordinate system are considered as uncorrected angles of attack, which are related to the corrected angles of attack using equation (11). Data could not be obtained at −30° angle of attack for rotor speed of 5000 rpm and at an angle of attack of −90° for speeds of 4000 rpm and 5000 rpm due to resonance effects observed under these conditions. The windmill-brake state is observed only for angles of attack of α ≥ 30° under all the rotational speeds considered. The lowest thrusts occur at 90° and 60° angles of attack over the entire range of advance ratios for all the three speeds considered. 90° is fully axial flow as typical for a pure propeller. As can be seen from Figure 9, the highest thrust coefficients occur at −90° angle of attack and a rotor speed of 3000 rpm over the entire range of the freestream advance ratios. This angle of attack is associated with a vertical descent.
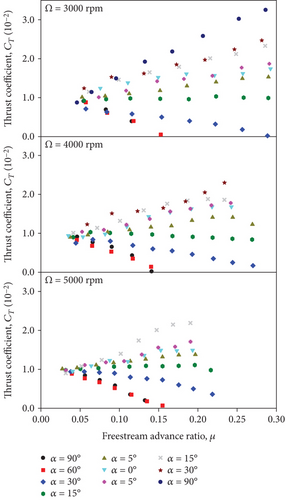
The square of the advance-ratio term in equation 22 confirms that the increase in thrust coefficient with increasing fully edgewise flow, as observed from the experimental results in Figure 9, is primarily due to the net effects of the azimuthal variations of dynamic pressures. As can also be seen from equations 19 and 20, the advancing side has much larger effective angles of attack and produces more lift than the retreating side. These lift differences due to different angles of attack of the advancing and retreating sides, however, cancel each other, and the net section-lift coefficient should be equal to its static value as indicated by the integral expression of equation 22. Nevertheless, the thrust imbalance between advancing and retreating sides results in a roll moment that will be discussed later. The thrust increase was also observed in [31], where the aerodynamic performance of a T-motor blade was assessed using a higher order potential flow model. In theory, this additional thrust should have an upper advance-ratio limit due to a growing region where the retreating blade stalls. With the current experimental setup, however, it was not possible to find the maximum of the additional thrust, beyond which retreating blade stall causes a reduction in thrust as the advance ratio is further increased. Nevertheless, the additional thrust and the subsequent moments have a significant impact on the dynamics and control of small multirotor vehicles but are underreported in literature.
The rotor power coefficients at angles of attack ranging from −90° to 90°are shown in Figure 10 for rotational speeds of 3000 rpm, 4000 rpm, and 5000 rpm. The results shown in the figure are based on the uncorrected angles of attack that are measured with respect to the wind-tunnel coordinate system. Similar to the thrust coefficients, the rotor power coefficients at −90°, −30° and− 15° angles of attack are generally greater than those at the other angles of attack over the entire range of the freestream advance ratio for all the three rotational speeds. During near vertical-climb conditions with angles of attack of 90° to 30°, however, the power and thrust coefficients in Figures 9 and 10 decrease with increase in the freestream velocity as one would expect from what essentially is a propeller. Negligible variations, however, are observed for the power coefficients with respect to the freestream advance ratio at inflow conditions that have significant edgewise flow components at angles of attack of −5°, 0°, 5°, and 15°.
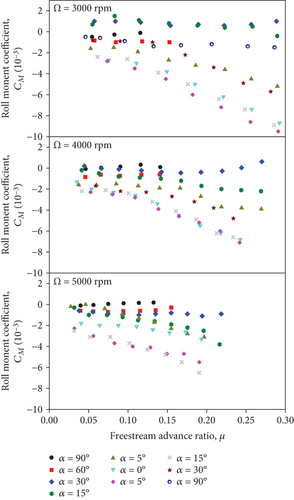
The roll moment coefficients that were observed at the aforementioned uncorrected angles of attack and rotor rotational speeds are shown in Figure 11. Similar to the thrust and power coefficients, the roll moment coefficients are presented based on the uncorrected angles of attack. The figure supports the earlier discussion about the significant influence of edgewise flow on the rotor roll moment as advancing and retreating blade produce different amounts of lift. The roll moment is of concern when trimming multirotor vehicles. For the rotational speeds of 3000 rpm and 4000 rpm, the magnitudes of the roll moment coefficients significantly increase with the freestream advance ratio at angles of attack of 5°, 0°, −5°, −15°, and −30°. The magnitudes of the roll moment coefficients at angles of attack of α ≥ 15° and −90°, however, are relatively small and remain nearly constant over the range of the advance ratio for Ω = 3000 rpm and 4000 rpm. As the rotor speed increases to 5000 rpm, the roll moment coefficient exhibits a similar trend as those for 3000 rpm and 4000 rpm, except that the magnitude of the roll moment at 15° angle of attack slightly increases with the freestream velocity.
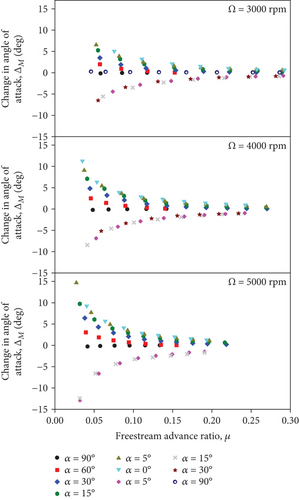
The results presented in Figures 9 to 11 were based on the uncorrected angles of attack. As described in Section 2.3, the angle of attack in the free-air condition can differ from what is measured in the wind-tunnel test section due to wall-interference effects. Therefore, it is important to evaluate the change in the angle of attack for the current set of experimental data using equation 11. Figure 12 illustrates the change in the angle of attack due to the wall interference, Δα, as a function of freestream advance ratio for T-motor 18x6.1 under rotor rotational speeds of Ω = 3000 rpm, 4000 rpm, and 5000 rpm. As can be seen from the figure, the magnitude of the change in the angle of attack under the axial flow conditions, α = ±90, is very small (less than 0.3°) for all the advance ratios and rotor speeds considered. The change in the angle of attack is relatively high for −30° ≤ α ≤ 30° under very low advance ratios. The change in the angle of attack, however, substantially reduces with increasing advance ratio. The magnitude of Δα is approximately less than 3° for μ > 0.1 at all the angles of attack and rotational speeds. Therefore, the thrust, power, and roll moment coefficients in Figures 9 to 11 were assumed to be equivalent to those under the free-air condition when the flow is axial or the advance ratio is in the moderate to high range. For low advance ratios, however, changes in thrust and power coefficients with respect to the inflow angles are relatively small, as can be seen from Figures 9 and 10. In other words, the constant angle-of-attack curves of thrust and power coefficients tend to merge as the advance ratio decreases. Nevertheless, one can relate the uncorrected angles of attack in Figures 9 to 11 to the free-air angles of attack by adding the respective values of Δα in Figure 12. For example, at 0° angle of attack and advance ratio of μ = 0.076 under the rotational speed of 3000 rpm, the change in the angle of attack is Δα = 5°, and thereby the corrected angle of attack is 0° + 5° = 5°.
4. Conclusions
The aerodynamic characteristics of a small rotor that is typically used with small multirotor vehicles were investigated in wind-tunnel tests for a wide range of advance ratios and inflow angles. Systematic corrections were applied to the wind-tunnel data. These corrections accounted for the influence of the test stand base loads, solid blockage and constraints due to the wind-tunnel walls. During static conditions, the thrust coefficients exhibited a small Reynolds-number dependency by slightly increasing with rotor rotational speeds. The power coefficients, however, remained constant with the rotational speed.
The aerodynamic performance of the small-scale rotor was strongly influenced by edgewise flows. During this test and others not discussed herein, a rotor angle of attack of 15° appears to be the dividing angle of attack, for which thrust remains relatively constant with increasing freestream advance ratio. At larger angles of attack, an increase in freestream advance ratio results in a decrease in thrust and power. At angles of attack of less than 15° thrust and power increase with increasing advance ratios, although the changes in power are small for inflow angles between −5° and 15°. These gains can be explained with the difference in dynamic pressure between the advancing and retreating sides of the blade that result in additional thrust with very little or no additional power needs. In general, small multirotor vehicles typically operate at an angle of attack between approximately 0 and 15° for many applications. Similar to thrust and power, the results also suggested nonlinear variations in the roll moment coefficients with respect to inflow angles and rotor rotational speeds that also suggest a large impact during flight—that is, at an angle of attack of −30° ≤ α ≤ 15°. Outside of this range, the recorded roll moment appears to be negligible.
Nomenclature
-
- A:
-
- Rotor disc area (m2)
-
- AT:
-
- Cross-sectional area of the wind-tunnel test section (m2)
-
- CD,b:
-
- Drag coefficient associated with base-load measurement
-
- Cl,α:
-
- Section lift-curve slope
-
- CM:
-
- Roll moment coefficient
-
- CM,b:
-
- Roll moment coefficient associated with base-load measurement
-
- CQ,b:
-
- Torque coefficient associated with base-load measurement
-
- CP:
-
- Power coefficient
-
- CT:
-
- Thrust coefficient
-
- c:
-
- Chord (m)
-
- c75:
-
- Chord length at 75% of the blade radius
-
- K:
-
- Solid blockage correction based on model shape
-
- M:
-
- Rotor roll moment (N.m)
-
- Mm:
-
- Moment measured using roll moment load cell (N.m)
-
- P:
-
- Rotor power (W)
-
- Pamb:
-
- Ambient pressure (Pa)
-
- Q:
-
- Rotor torque (N.m)
-
- Qm:
-
- Moment measured using torque load cell (N.m)
-
- R:
-
- Rotor radius (m)
-
- Ra:
-
- Air gas constant (287 J/kg⋅K)
-
- r:
-
- Radial position along the blade (m)
-
- T:
-
- Rotor thrust (N)
-
- Ta:
-
- Temperature of the air in the test section (K)
-
- Tm:
-
- Measured axial force from the thrust load cell (N)
-
- :
-
- Section thrust on advancing side
-
- :
-
- Section thrust on retreating side
-
- :
-
- Section thrust under static condition
-
- :
-
- Uncertainty associated with roll moment coefficient
-
- :
-
- Uncertainty associated with power coefficient
-
- :
-
- Uncertainty associated with thrust coefficient
-
- UM:
-
- Uncertainty associated with rotor roll moment (N.m)
-
- UT:
-
- Uncertainty associated with rotor thrust (N)
-
- UP:
-
- Uncertainty associated with rotor power (W)
-
- URe:
-
- Uncertainty associated with Reynolds number
-
- UV:
-
- Uncertainty associated with freestream velocity (m/s)
-
- Uμ:
-
- Uncertainty associated with freestream advance ratio
-
- Uρ:
-
- Uncertainty associated with density of air (kg/m3)
-
- UΩ:
-
- Uncertainty associated with rotor rotational speed (rad/s)
-
- u:
-
- Korizontal rotor-induced velocity (m/s)
-
- V:
-
- Freestream velocity (m/s)
-
- :
-
- Volume of the test model (m3)
-
- v:
-
- Rotor-induced velocity normal to the rotor disc plane (m/s)
-
- vh:
-
- Induced velocity of the rotor in hover (m/s)
-
- w:
-
- Vertical rotor-induced velocity (m/s)
-
- x:
-
- Chordwise coordinate of the blade airfoil cross-section measured from the leading edge (m)
-
- z:
-
- Vertical coordinate of the blade airfoil cross-section measured from the chord line (m)
-
- α:
-
- Rotor angle of attack
-
- β:
-
- Blade pitch angle (rad)
-
- ∆u:
-
- Horizontal interference velocity (m/s)
-
- ∆V:
-
- Increment in the measured freestream velocity, (m/s)
-
- ∆w:
-
- Vertical interference velocity (m/s)
-
- δu,D:
-
- Interference factor for longitudinal interference velocity due to drag
-
- δu,L:
-
- Interference factor for longitudinal interference velocity due to lift
-
- δw,D:
-
- Interference factor for vertical interference velocity due to drag
-
- δw,L:
-
- Interference factor for vertical interference velocity due to lift
-
- μ:
-
- Freestream advance ratio
-
- ν:
-
- Kinematic viscosity of the air (m2/s)
-
- ρ:
-
- Density of the air (kg/m3)
-
- τ:
-
- Solid blockage correction based on model-span to tunnel-width ratio
-
- χe:
-
- Effective wake skew angle (rad)
-
- Ω:
-
- Rotor rotational speed (rad/s).
Conflicts of Interest
The authors declare that there is no conflict of interest.
Acknowledgments
The authors would like to thank Jerry Karpynczyk, Timothy B. Carroll, Giovanna Saccaro, Dylan Krcmarov, and Nicholas Mejia for their help in setting up and executing the experiments. This study was made possible with funding from Aeryon Labs Inc., the Natural Science and Engineering Research Council of Canada, and Ontario Centres of Excellence through a Collaborative Research and Development Grant titled “Advanced Rotor Analysis Method for the Next-Generation Small Multirotor Aerial Vehicle.”
Open Research
Data Availability
The data used to support the findings of this study are available from the corresponding author upon request.


