Optimization of Preparation Conditions of Novel Adsorbent from Sugar Scum Using Response Surface Methodology for Removal of Methylene Blue
Abstract
A novel and inexpensive adsorbent was prepared from sugar scum for the removal of methylene blue as an organic pollutant from aqueous solutions. The response surface methodology was used to study the effects of the calcination temperature and time on the yield and the methylene blue adsorption. In order to determine the optimal conditions of the preparation, the Doehlert design and desirability function were applied. The increase in calcination temperature increases the methylene blue adsorption and induces a reduction in yield. The optimal conditions have been identified to be a calcination temperature of 986°C and calcination time of 61 min. The characteristics of the obtained adsorbent were determined using SEM/EDX, and surface functions were obtained based on FTIR and pHpzc. The produced adsorbent had a porous structure and a pHpzc of 12.5. The results showed that the yield was 49.74% and the adsorption of methylene blue was 24.52 mg·g−1 with a contact time of 10 h determined by kinetic test. The sugar scum was found to be an effective material for the preparation of appropriate adsorbent for dye removal from wastewater.
1. Introduction
Industrial liquid effluents containing synthetic organic chemicals are potential sources of pollution. They contaminate all the constituents of the environment: soil, water, and air. The majority of these compounds are toxic or carcinogenic and harmful to organisms even in low concentrations [1]. Among these products, the dyes used in several sectors such as textiles, cosmetics, plastics, pigments units, leather, and paper industries have been considered as the primary pollutant due to their stability and low biodegradability [2].
The complex aromatic structures of the dyes render their degradation difficult in the presence of heat, light, microbes, and oxidizing agents [3]. Thus, the discharge of the dye-bearing wastewater in the environment has been the focus of much research in recent years. The scientific community has become increasingly concerned about the potential impact of those contaminants by developing effective removal techniques. Various treatment processes have been used to remove the dyes from wastewater such as adsorption [2, 4–6], membrane filtration [7], photocatalytic and electrochemical combined treatments [8], combinations of coagulation/flocculation with microfiltration, ultrafiltration and adsorption on activated carbon [9], biodegradation [10], oxidation [11], and ozonation [12].
The adsorption is an effective method for the elimination of dyes from wastewater, especially if the adsorbent is inexpensive, readily available, and does not require any additional pretreatment step before its application. Some advantages of adsorption process are its relative simplicity, low cost, and possible regeneration of the adsorbent [3, 13].
In recent years, there has been increasing interest in the research of the production of adsorbents from the agricultural byproducts and industrial wastes for dye removal. The utilization of those wastes has a positive impact on reducing solid wastes, the production of low-cost materials with high added value, and environment protection. Thus, adsorbents have been prepared from clay materials [14, 15], zeolites [16, 17], siliceous material [18], marble dust [19], sewage sludge [20], chitosan [21], fly ash [22], and peels [23].
Sugar scum is derived from the sugar-refining process through juice carbonatation. It is separated from the sugary juices using filtration and contains primarily precipitated calcium carbonate as well as minerals and organic materials removed in juice purification [24]. It is disposed of in open fields or sold as compost to farmers to neutralize acidic soils and improve their structures [24, 25]. So, the objective of the present study is to prepare an adsorbent from sugar scum for the removal of organic pollutants from aqueous solution. The response surface methodology and multicriteria optimization with a Doehlert design and desirability function were used to study the influence of the calcination temperature and time on the yield and adsorption of methylene blue and to determine the optimal conditions of the preparation. The adsorbent obtained under these experimental conditions was characterized by different methods to determine morphological features, surface functions, and point of zero charge.
2. Materials and Methods
2.1. Preparation of Adsorbent
The sugar scum used in this study was brought from a discharge of sugar factory located in Sidi Bennour, Morocco. It was dried at 110°C for 24 h and crushed and sieved to obtain particle size less than 200 µm. The sugar scum powder was put in a tubular furnace (Carbolite Ltd., UK) and heated at a rate of 10°C/min, held at different calcination temperatures between 400 and 1000°C during desired time, and allowed to cool to room temperature. The product was ground (granulometry less than 200 µm), weighed to determine the yield of the product, and stored in a tightly closed bottle for later experimental uses. All the chemicals used in this study were of analytical reagent grade.
2.2. Response Surface Methodology
| Factor | Undimensional variable | Experimental domain |
|---|---|---|
| U1: calcination temperature (°C) | X1 | 400 to 1000 |
| U2: calcination time (min) | X2 | 30 to 120 |
To estimate the coefficients of the model, the Doehlert design was applied using NEMROD software (New Efficient Methodology for Research using Optimal Design). This design permits to represent the responses studied in all experimental domains of these two factors with a minimum number of experiments for later predication of responses in each point of the domain. The Doehlert experimental design and the corresponding experimental conditions are given in Table 2. The experimental domain center was repeated four times in order to validate the experimental error and to test the reproducibility of the responses [26, 27].
| Experiment | Design of experiment | Operating condition | ||
|---|---|---|---|---|
| X1 | X2 | Temperature (°C) | Time (min) | |
| 1 | 1.0000 | 0.0000 | 1000.00 | 75 |
| 2 | −1.0000 | 0.0000 | 400.00 | 75 |
| 3 | 0.5000 | 0.8660 | 850.00 | 114 |
| 4 | −0.5000 | −0.8660 | 550.00 | 36 |
| 5 | 0.5000 | −0.8660 | 850.00 | 36 |
| 6 | −0.5000 | 0.8660 | 550.00 | 114 |
| 7 | 0.0000 | 0.0000 | 700.00 | 75 |
| 8 | 0.0000 | 0.0000 | 700.00 | 75 |
| 9 | 0.0000 | 0.0000 | 700.00 | 75 |
| 10 | 0.0000 | 0.0000 | 700.00 | 75 |
2.3. Characterization of Adsorbent
2.3.1. Batch Adsorption Tests from Aqueous Solutions
The adsorption capacity of sugar scum powder and calcined sugar scum powders was determined by performing batch mode adsorption. Methylene blue was used as adsorbate to determine the adsorption capacity of adsorbents and also serves as a model compound for adsorption of organic contaminants from aqueous solution. The effect of various parameters such as adsorbent dose, contact time, initial methylene blue concentration, and pH on the adsorption capacity of methylene blue was studied. A defined amount of adsorbent was added to flasks of 100 cm3 containing 50 cm3 of desired concentration of methylene blue solution. The desired pH of the solution was adjusted using 0.1M of HCl and NaOH with a pH meter. The suspensions were mixed on a shaker at 170 rpm during a given time and separated with centrifuge. The residual concentration of methylene blue was determined by the spectrophotometric method (UV-3100PC Spectrophotometer) at 664 nm.
2.3.2. Adsorbent Yield
2.3.3. Characterization Techniques
X-ray powder diffraction analysis of sugar scum powder and optimal adsorbent was carried out in Reminex Managem laboratory in Morocco to identify the various phases present in those materials. Scanning electron microscopy coupled with energy dispersive X-ray spectroscopy (SEM/EDX) was used to examine the morphological features of scum powder and optimal adsorbent as well as to determine its elemental composition using TESCAN VEGA3–EDAX instrument with an accelerating voltage of 20 kV.
The sugar scum powder and optimal adsorbent were analyzed with Fourier-transform infrared (FTIR) spectroscopy on a Nicolet 5700 spectrometer in the scanning range of 4000 to 400 cm−1 (64 scans, at a resolution of 4 cm−1) to identify surface functional groups; the sample was mixed with KBr powder, and the mixture was pressed into pellet.
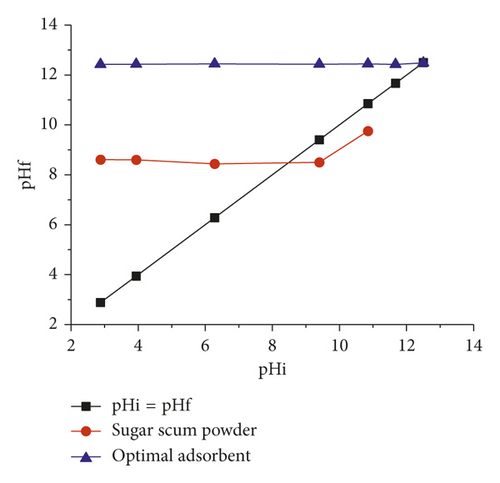
The pH at point of zero charge (pHpzc) corresponds to the pH at which the surface net charge of the adsorbent is zero. In order to determine the pHpzc, 50 mL of 0.01M NaCl, bubbled with nitrogen gas to expel the dissolved CO2, was taken, and its initial pH was adjusted between 2 and 12 using 0.1M of HCl and NaOH with a pH meter. Then, 10 mg of adsorbent was added to each flask. These flasks were kept for 72 h, and the final pH of the solutions was measured. The pHpzc of adsorbent was identified by the intersection of the curves pHf = f(pHi) [28].
3. Results and Discussion
3.1. Optimization of the Preparation Conditions
To obtain an adequate adsorbent, the calcination temperature and time were optimized under the following operating conditions: adsorbent dose of 4 g·L−1, contact time of 24 h, initial methylene blue concentration of 100 mg·g−1, and at pH of solution.
The Doehlert experimental design and experimental results are given in Table 3. In order to interpret the results, the response surfaces were represented in the domains of interest of temperature and time using NEMROD software (isoresponse curves). The estimated values of coefficients for responses yield (Y1) and methylene blue adsorption (Y2) are given in Table 4.
| Experiment | Design of experiment | Operating condition | Experimental response | |||
|---|---|---|---|---|---|---|
| X1 | X2 | Temperature (°C) | Time (min) | Y1 (%) | Y2 (mg/g) | |
| 1 | 1.0000 | 0.0000 | 1000.00 | 75 | 49.970 | 21.179 |
| 2 | −1.0000 | 0.0000 | 400.00 | 75 | 86.054 | 5.786 |
| 3 | 0.5000 | 0.8660 | 850.00 | 114 | 50.608 | 22.052 |
| 4 | −0.5000 | −0.8660 | 550.00 | 36 | 83.710 | 3.057 |
| 5 | 0.5000 | −0.8660 | 850.00 | 36 | 60.860 | 23.690 |
| 6 | −0.5000 | 0.8660 | 550.00 | 114 | 83.266 | 2.729 |
| 7 | 0.0000 | 0.0000 | 700.00 | 75 | 80.608 | 10.589 |
| 8 | 0.0000 | 0.0000 | 700.00 | 75 | 80.796 | 10.153 |
| 9 | 0.0000 | 0.0000 | 700.00 | 75 | 80.586 | 11.026 |
| 10 | 0.0000 | 0.0000 | 700.00 | 75 | 80.726 | 10.153 |
| Coefficient | Yield, Y1 | MB adsorption, Y2 | ||
|---|---|---|---|---|
| Significance (%) | Significance (%) | |||
| b0 | 80.679 | <0.01 ∗∗∗ | 10.480 | <0.01 ∗∗∗ |
| b1 | −21.279 | <0.01 ∗∗∗ | 11.790 | <0.01 ∗∗∗ |
| b2 | −3.088 | <0.01 ∗∗∗ | −0.568 | 9.9 |
| b11 | −12.667 | <0.01 ∗∗∗ | 3.002 | 0.275 ∗∗ |
| b22 | −10.536 | <0.01 ∗∗∗ | 2.202 | 0.752 ∗∗ |
| b12 | −5.663 | <0.01 ∗∗∗ | −0.756 | 21.5 |
- ∗∗∗Statistically significant at the level <99.99%. ∗∗Statistically significant at the level 99%.
3.1.1. The Effect of Factors on the Yield
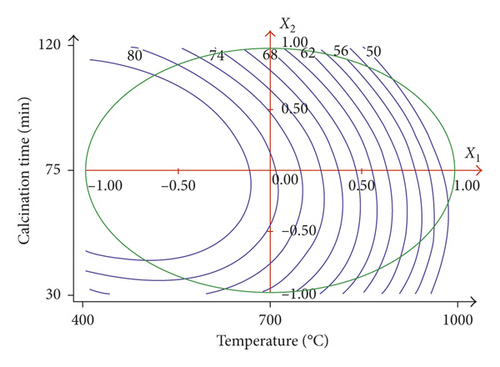
The analysis of the results which are given in Table 3 shows that the yield (Y1) varies between 49.97 and 86.054%. Table 4 and Figure 1 show that the calcination temperature (X1) and calcination time (X2) have a negative influence on the yield. The yield is more influenced by calcination temperature (b1 = −21.297) than by calcination time (b2 = −3.088). At 1000°C, the yield is reduced by 50% due to the decomposition of the carbonates and formation of new phases (CaO as major phase) and CO2. Thus, in order to have a better yield, it is necessary to operate at a low calcination temperature.
3.1.2. The Effect of Factors on the Adsorption of Methylene Blue (Y2)
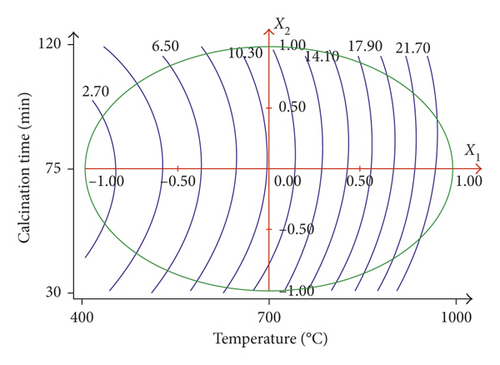
As shown in Table 3, the methylene blue adsorption on the calcined sugar scum powder varies between 2.73 and 23.69 mg·g−1. Table 4 and Figure 2 show that the calcination temperature is the predominant factor with a positive impact (b1 = 11.79), and the increase in calcination temperature produces a significant increase in adsorption of methylene blue. The increase in the calcination temperature increases the release of the CO2, causing an increase in the dimensions of pores and thus resulting in an increase in the adsorption of methylene blue. Thus, to maximize the methylene blue adsorption, it is necessary to operate at a high calcination temperature.
3.1.3. Optimization
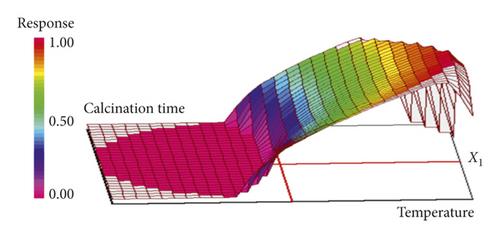
The desirability function varies in the interval [0, 1]; the value 1 corresponds to the maximum satisfaction (desired value), and 0 corresponds to an unacceptable response [30]. The maximum of the function D gives the best global compromise for all the responses in the studied domains and corresponds to optimal experimental conditions. All the information and results of the multicriteria optimization are given in Table 5. After the calculation by the NEMROD software, the response surface corresponding to the maximum of the global desirability function D, where there are optimal conditions for the preparation of adsorbent with high yield and good quality, is presented as a three-dimensional plot in Figure 3. The optimal point which corresponds to the maximum of the global desirability function is found for a calcination temperature of 986°C and calcination time of 61 min. At these conditions, the predicted values of the responses calculated from the model for the yield and adsorption of methylene blue were 50.68% and 25.01 mg·g−1, respectively. In order to validate the model, three samples of calcined sugar scum powder were prepared under optimal conditions. The characteristics of the optimal adsorbent were 49.74% for the yield and 24.52 mg·g−1 for the adsorption of methylene blue. The difference between the experiment and the predicted values is very lower which confirm the good accuracy of the model.
| Response | Lower limit | Target value | Weight | di (%) | dimin (%) | dimax (%) | Cal. value | Exp. value |
|---|---|---|---|---|---|---|---|---|
| Y1 = yield (%) | 40 | 50 | 1 | 100.00 | 100.00 | 100.00 | 50.68 | 49.74 |
| Y2 = MB adsorption (mg·g−1) | 15 | 25 | 1 | 100.00 | 97.49 | 100.00 | 25.01 | 24.52 |
| Desirability | 100.00 | 98.74 | 100.00 |
- di: partial desirability of response Yi, dimin: minimal partial desirability of response Yi, dimax: maximal partial desirability of response Yi, Cal. value: calculated value, and Exp. value: experimental value.
3.2. Study of the Influence of Some Factors on the Methylene Blue Adsorption
3.2.1. Effect of Adsorbent Dose
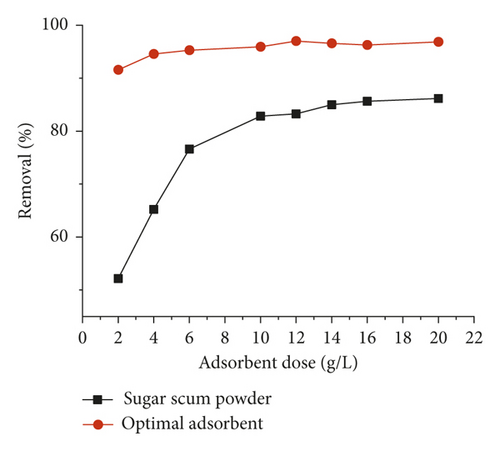
The effect of adsorbent dose, ranging from 2 to 20 g·L−1, on the adsorption of methylene blue is depicted in Figure 4. The methylene blue removal increases as the amount of the adsorbent increases and reaches a maximum value at 4 g·L−1 and 16 g·L−1 for optimal adsorbent and sugar scum powder, respectively. These observations could be attributed to an increase in the surface area of the adsorbents and hence the number of available adsorption sites for the adsorption of methylene blue [13, 31]. In addition, the methylene blue removal on optimal adsorbent was found to be greater than that for sugar scum powder. The obtained results may suggest that the calcination at high temperature produces a development of the porosity of the obtained material and therefore the number of active sites, requiring slight dose to reach the equilibrium compared to sugar scum powder.
3.2.2. Effect of Contact Time
Figure 5 represents the variation of the methylene blue adsorption on optimal adsorbent and sugar scum powder as a function of time. The adsorption increased with contact time at the initial stage of adsorption and almost remained constant after some time. The adsorption process of methylene blue was rapid at the beginning of the process due to the availability of active sites on the exterior surfaces. After the saturation of those active sites, methylene blue entered to the pores of the adsorbent with a slower rate to reach equilibrium time [19, 32]. The contact time which corresponds to the equilibrium state is equal to 2 h for sugar scum powder and 10 h for the adsorbent prepared at optimal conditions. The adsorption rate of methylene blue on optimal adsorbent was found to be highly slower than that for sugar scum powder.
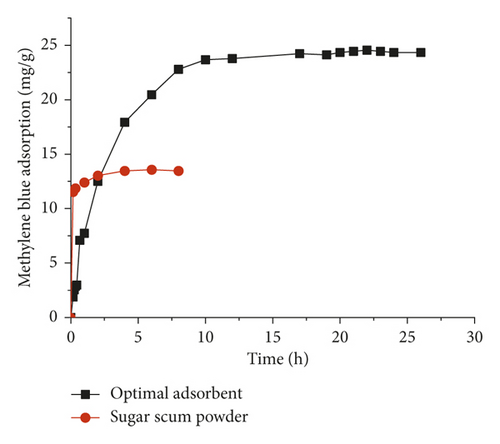
This difference might be mainly due to the modification of the physicochemical characteristics of optimal adsorbent caused by the calcination process. The methylene blue amount removed by optimal adsorbent was 24.5 mg·g−1, which is higher than the one obtained for sugar scum powder (13.5 mg·g−1).
3.2.3. Effect of Initial MB Concentration
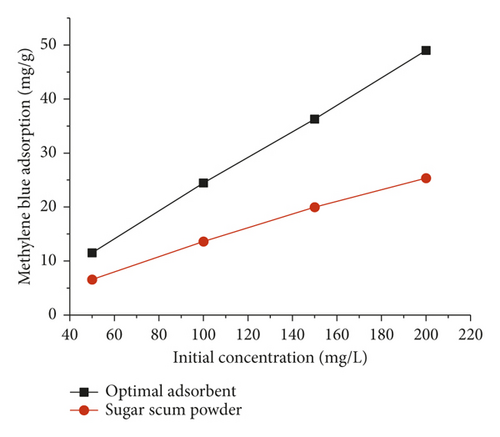
The effect of initial methylene blue concentration on the amount adsorbed on optimal adsorbent and sugar scum powder is shown in Figure 6. The contact time determined by kinetic tests was 2 h and 10 h for sugar scum powder and optimal adsorbent, respectively. It can be seen that the methylene blue adsorption increased as the initial MB concentration increased from 50 to 200 mg·L−1. This could be explained by the fact that as the concentration gradient between the aqueous solution and the solid phase increases, the diffusion rate of MB increases. Furthermore, for the higher initial aqueous concentrations, the contact probability between methylene blue contained in the aqueous phase and the used adsorbent might be more privileged [19, 32]. Similar results were also obtained by Hamed et al. [19], and they studied MB removal from aqueous solutions by marble dust.
3.2.4. Effect of pH
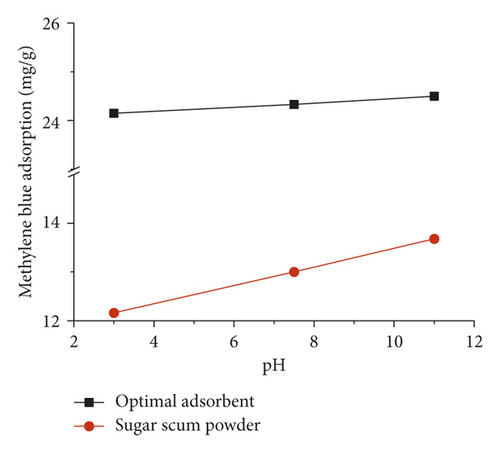
In order to evaluate the effect of pH on the adsorption process, experiments were carried out in the pH range of 3 to 11. Figure 7 illustrates the adsorption of methylene blue on optimal adsorbent and sugar scum powder versus pH. The contact time determined by kinetic tests was 2 h for sugar scum powder and 10 h for optimal adsorbent. It can be observed that for both adsorbent, the increase in pH from 3 to 11 induces a slight increase in the adsorption of methylene blue from 12.16 to 13.68 mg·g−1 for sugar scum powder and from 24.15 to 24.5 mg·g−1 for optimal adsorbent. This can be attributed to an increase in the number of negatively charge sites, which favors the attraction between the positively charged dye and the negatively charged surface of adsorbent. In addition, the optimal adsorbent was a more effective adsorbent compared to sugar scum powder due to its better specific area and porosity.
3.3. Characterization of Adsorbent
The XRD patterns of sugar scum powder and adsorbent prepared under optimal conditions are shown in Figure 8. The comparison of the XRD peaks of Figure 8(a) with JCPDS code number 01-086-2339 revealed that the calcite (CaCO3) is a primary phase in the sugar scum powder [33, 34]. The peaks of Figure 8(b) were matched with JCPDS code number 01-077-2010, 01-084-1265, and 01-079-0612 which indicated the presence of calcium oxide (CaO), calcium hydroxide (Ca(OH)2), and magnesium oxide (MgO) in the optimal adsorbent. The main peak appeared at 2θ = 37.4 indicating that CaO is the main phase [33, 34]. Therefore, the calcination of scum powder at optimal conditions produced the decomposition of the carbonate into CaO and MgO.
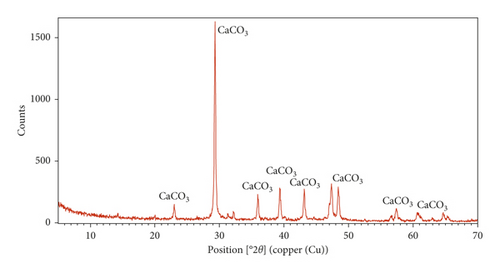
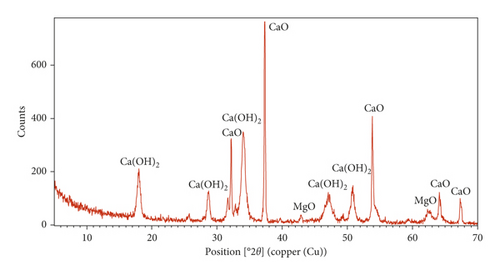
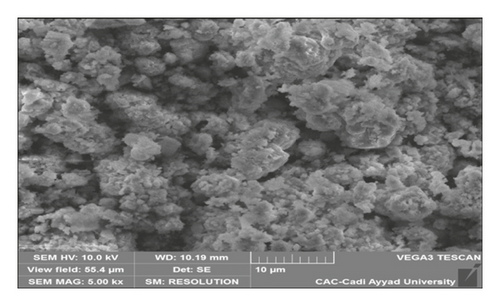
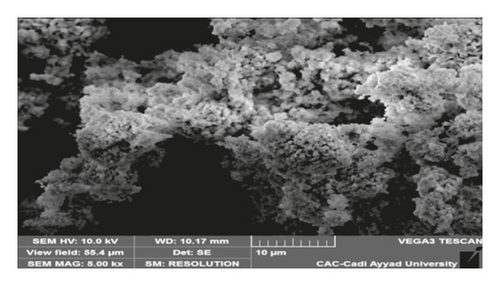
Figure 9 shows SEM micrographs of sugar scum powder and optimal adsorbent. It illustrates that those materials are formed of agglomeration of small particles with irregular shape. At 986°C, spherical particles were obtained due to the decomposition of carbonates and formation of new phases (CaO and MgO) [31]. In addition, the adsorbent prepared at optimum conditions presents higher porosity than sugar scum powder due to the release of carbon dioxide. The results of the elemental analysis using EDX (Table 6) indicate that sugar scum powder is formed by calcite with large amounts of Ca, C, and O. The optimal adsorbent contains higher amounts of Ca and O and less amount of C due to the decomposition of carbonate. Small amounts of other elements (P, Mg, Si, S, and Al) are observed for sugar scum powder and optimal adsorbent.
| Element | Sugar scum powder | Optimal adsorbent |
|---|---|---|
| Oxygen (%) | 45.73 | 32.87 |
| Calcium (%) | 32.99 | 62.55 |
| Carbon (%) | 16.96 | 1.16 |
| Phosphorus (%) | 1.51 | 0.92 |
| Magnesium (%) | 1.33 | 1.07 |
| Silicon (%) | 0.76 | 0.50 |
| Sulfur (%) | 0.43 | 0.58 |
| Aluminum (%) | 0.29 | 0.36 |
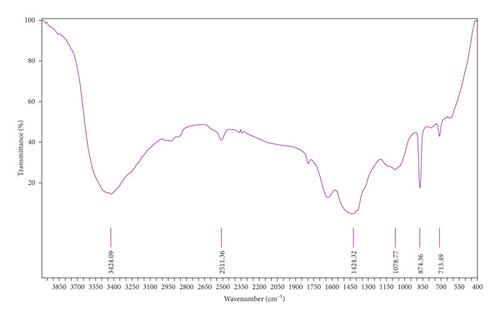
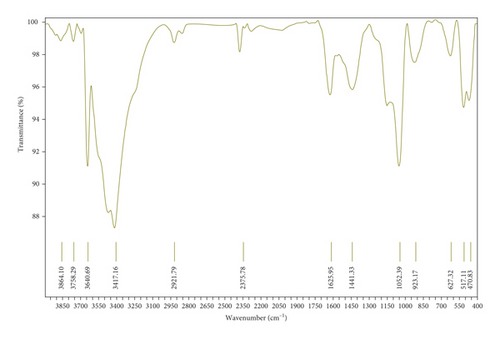
Figure 10(a) corresponds to the FTIR spectra of sugar scum powder. The band located at around 3424 cm−1 was attributed to O–H stretching vibration of the adsorbed water [35]. The peaks at 713, 874, 1078, 1424, and 2511 cm−1 were assigned to the calcite (CaCO3) [19, 31, 35]. The low intensity band at 1630 cm−1 was due to the bending vibrations of strongly adsorbed water [35]. The FTIR spectra of adsorbent prepared under optimal conditions are reported in Figure 10(b). According to Zaki and et al. [36], the peaks located at 3864, 3640, 1440, 517, and 470 cm−1 were attributed to CaO. Peaks at around 3450 and 1625 cm−1 corresponded to OH stretching and bending vibrations [37]. The bands located at 1052 and 900 cm−1 may be ascribed to the carbonate [37]. The absence of the absorption peaks at 713 and 874 cm−1 in the spectra of the adsorbent prepared at optimal conditions indicates that CaCO3 is turned into CaO during calcination.
The pHpzc values of sugar scum powder and optimal adsorbent are 8.46 and 12.5, respectively (Figure 11). The calcination of scum powder has increased the pHpzc. When the pH is lower than pHpzc, the surface of the adsorbent gets positively charged, and the surface is negatively charged in pH values higher than pHpzc. Those adsorbents can be considered basic.
4. Conclusion
The present study shows that the sugar scum is an effective material for the preparation of appropriate adsorbent for dye removal from wastewater. The Doehlert design and desirability function were used to determine the optimal conditions for the preparation of an adsorbent with high yield and good adsorption quality of methylene blue. The increase in calcination temperature increases the adsorption capacity of methylene blue and reduces the yield. The optimal conditions were identified to be a calcination temperature of 986°C and time of 61 min. At these conditions, the experimental responses for the yield and adsorption capacity of methylene blue were 49.74% and 24.52 mg·g−1, respectively, which are in acceptable agreement with the predicted values. The adsorbent prepared at optimum conditions was a more effective adsorbent compared to sugar scum powder due to its better specific area and porosity. These values reflect an interesting adsorbent power of the prepared adsorbent.
Conflicts of Interest
The authors declare that they have no conflicts of interest.
Acknowledgments
The authors are grateful to the Center of Analyses and Characterization (CAC) of University Caddy Ayyad, Morocco. Also, their respectful thanks go to professors of the REMATOP and REMINEX Managem laboratories in Marrakech, Morocco.


