
QSAR Modeling and Molecular Docking Analysis of Some Active Compounds against Mycobacterium tuberculosis Receptor (Mtb CYP121)
Abstract
A quantitative structure-activity relationship (QSAR) study was performed to develop a model that relates the structures of 50 compounds to their activities against M. tuberculosis. The compounds were optimized by employing density functional theory (DFT) with B3LYP/6-31G⁎. The Genetic Function Algorithm (GFA) was used to select the descriptors and to generate the correlation model that relates the structural features of the compounds to their biological activities. The optimum model has squared correlation coefficient (R2) of 0.9202, adjusted squared correlation coefficient (Radj) of 0.91012, and leave-one-out (LOO) cross-validation coefficient () value of 0.8954. The external validation test used for confirming the predictive power of the built model has R2pred value of 0.8842. These parameters confirm the stability and robustness of the model. Docking analysis showed the best compound with high docking affinity of −14.6 kcal/mol which formed hydrophobic interaction and hydrogen bond with amino acid residues of M. tuberculosis cytochromes (Mtb CYP121). QSAR and molecular docking studies provide valuable approach for pharmaceutical and medicinal chemists to design and synthesize new anti-Mycobacterium tuberculosis compounds.
1. Introduction
Mycobacterium tuberculosis is a bacterial species responsible for causing tuberculosis (TB). It mainly affects the lungs and other parts of the body such as spine, kidney, and brain unless urgent treatment is provided. Tuberculosis remains one of the most prevalent infectious bacterial diseases, resulting in the death of 1.4 million people worldwide [1]. There are drugs like isoniazid, rifampicin, ciprofloxacin, and ethambutol available as a cure for tuberculosis.
However, due to the emergence of multidrug-resistant (MDR) and extensively drug-resistant (XDR) tuberculosis, this poses a big challenge towards the successful treatment of tuberculosis [2]. This led to development of new therapeutics against diverse strains of M. tuberculosis [3]. New synthesized 1,2,4-Triazole derivative compounds demonstrate tuberculosis inhibition activity [4]. Synthesis of novel molecules is typically developed using a trial-and-error approach, which is time-consuming and costly.
Quantitative structure-activity relationship (QSAR) plays a crucial part in novel drug design via a ligand-based approach [5]. The key success of the QSAR method is the possibility to predict the properties of new chemical compounds without the need to synthesize and test them. This technique is broadly utilized for the prediction of physicochemical properties in the chemical, industrial, pharmaceutical, biological, and environmental spheres [6]. Moreover, the QSAR strategies save resources and accelerate the process of developing new molecules for use as drugs, materials, and additives or for whatever purposes [7]. Meanwhile molecular docking is a computational method used to determine the binding strength between the active site residues and specific molecule(s) [8]. Molecular docking is expedient tool used in the drug discovery field to investigate the binding compatibility of molecules (ligands) to target (receptor) [9].
The aim of this research was to develop QSAR model to predict the activity of 1,2,4-Triazole derivatives as potent anti-Mycobacterium tuberculosis compounds and to elucidate the interaction between the inhibitor molecules and Mycobacterium tuberculosis target site.
2. Materials and Methods
2.1. Data Collection
Fifty molecules of 1,2,4-Triazole derivatives as potent antitubercular agents that were used in this study were obtained from the literature [4].
2.2. Biological Activities (BA)
| S/N | Molecules | Experimental activity (pBA) |
|---|---|---|
| 1 | 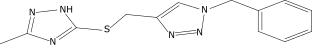 |
4.925 |
| 2a | 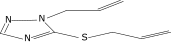 |
5.0345 |
| 3 | 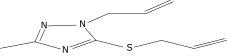 |
5.0064 |
| 4 | 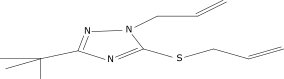 |
5.7386 |
| 5a | 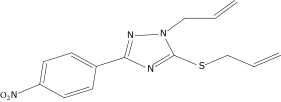 |
5.5994 |
| 6a | 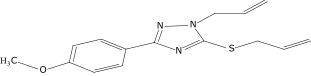 |
5.4543 |
| 7 | 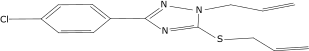 |
4.7441 |
| 8 | 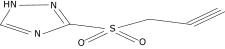 |
6.1674 |
| 9a | 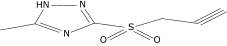 |
6.3456 |
| 10 | 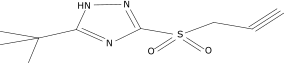 |
7.4134 |
| 11 | 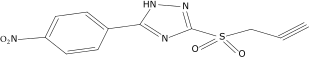 |
5.7441 |
| 12 | 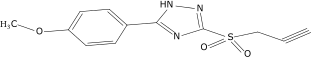 |
5.9258 |
| 13a | 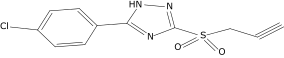 |
5.6754 |
| 14 |  |
6.3793 |
| 15 |  |
6.1667 |
| 16a | 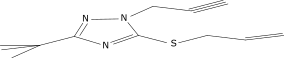 |
5.8765 |
| 17 | 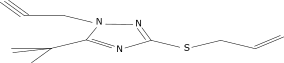 |
6.4171 |
| 18 | 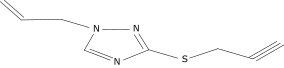 |
5.9413 |
| 19 |  |
7.6397 |
| 20 |  |
8.0899 |
| 21 |  |
6.3981 |
| 22 |  |
5.8131 |
| 23 | 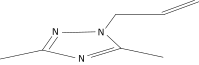 |
6.2878 |
| 24 | 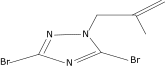 |
5.7268 |
| 25 | 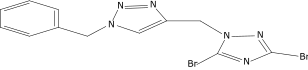 |
7.366 |
| 26a | 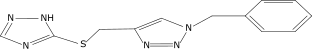 |
7.0123 |
| 27 | 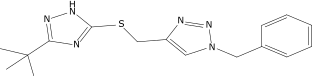 |
6.5267 |
| 28 | 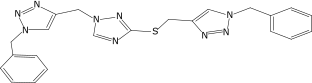 |
5.7405 |
| 29a | 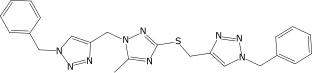 |
5.6533 |
| 30a | 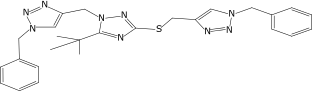 |
6.1923 |
| 31 | 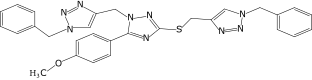 |
7.3233 |
| 32 | 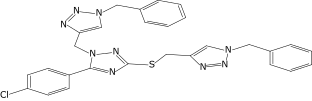 |
6.0097 |
| 33 | 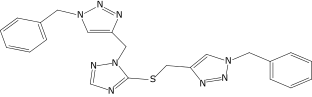 |
6.0928 |
| 34 | 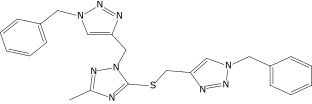 |
7.3279 |
| 35 | 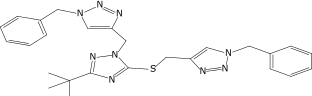 |
6.8568 |
| 36a | 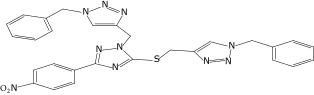 |
6.2234 |
| 37 | 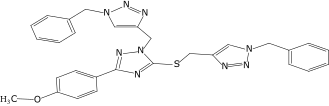 |
7.3079 |
| 38 | 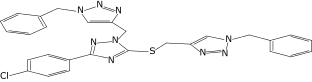 |
7.314 |
| 39a | 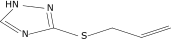 |
8.5854 |
| 40 | 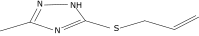 |
8.0615 |
| 41 | 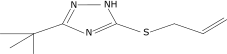 |
8.0615 |
| 42a | 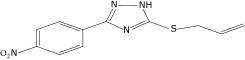 |
6.8494 |
| 43 | 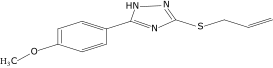 |
7.9432 |
| 44a | 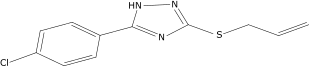 |
7.4535 |
| 45 | 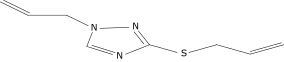 |
7.9759 |
| 46 | 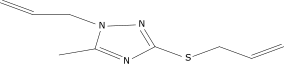 |
7.9759 |
| 47 | 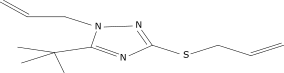 |
7.9294 |
| 48a | 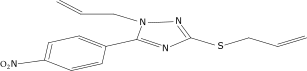 |
6.1213 |
| 49 | 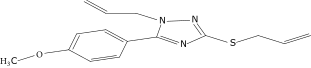 |
5.4406 |
| 50a | 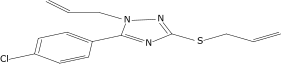 |
4.9074 |
- Superscript a represents the test set.
2.3. Geometry Optimization
The chemical structures of the molecules were drawn with ChemDraw Ultra Version 12.0. Each molecule was first preoptimized with the molecular mechanics (MMFF) and further reoptimized with density functional theory (DFT) utilizing the B3LYP and 6-31G∗ basis set [10, 11] with the aid of Spartan 14 Version 1.1.0 software.
2.4. Molecular Descriptor Calculation
Molecular descriptors are mathematical values that describe the properties of a molecule. Descriptors calculation for all the 50 molecules of 1,2,4-Triazole derivatives was done using PaDEL-Descriptor Version 2.20 software. A total of 1876 molecular descriptors were calculated.
2.5. Normalization and Data Pretreatment
2.6. Training and Test Set
The dataset was split into training set and test set by employing Kennard and Stone’s algorithm. The training set comprises 70% of the dataset which was used to build the model, while the remaining 30% of the dataset (test set) was used to validate the built model.
2.7. Relative Importance of Each Descriptor in the Model
2.8. Degree of Contribution of Selected Descriptors
2.9. Internal Validation of Model
2.10. External Validation of Model
2.11. Y-Randomization Test
2.12. Evaluation of the Applicability Domain of the Model
2.13. Quality Assurance of the Model
The fitting ability, stability, robustness, reliability, and predictive ability of the developed models were evaluated by internal and external validation parameters. The validation parameters were compared with the minimum recommended value for a generally acceptable QSAR model [17] shown in Table 2.
| Validation parameter | Name | Value |
|---|---|---|
| R2 | Coefficient of determination | ≥0.6 |
| P(95%) | Confidence interval at 95% confidence level | <0.05 |
|
|
Cross-validation coefficient | >0.5 |
| R2− | Difference between R2 and | ≤0.3 |
| Next. test set | Minimum number of external test sets | ≥5 |
| R2 test | Coefficient of determination for external test set | ≥0.6 |
| c | Coefficient of determination for Y-randomization | >0.5 |
2.14. Docking Studies
Molecular docking study was carried out in order to elucidate which of the 1,2,4-Triazole derivatives has the best binding affinity against Mtb CYP121. The structure of Mtb CYP121 used in the study was obtained from protein data bank with PDB code 51BG. The prepared ligand and receptor were shown in Figure 1. The optimized structures of 1,2,4-Triazole derivatives initially saved as SDF files were converted to PDB files using Spartan 14 V 1.1.4. The prepared ligands were docked with prepared structures of Mtb CYP121 using AutoDock Vina incorporated in PyRx software. The docked results were compiled, visualized, and analyzed using Discovery Studio Visualizer.


3. Results and Discussion
QSAR was performed to investigate the structure-activity relationship of 50 compounds as potent antitubercular agents. The nature of model in a QSAR study is expressed by its fitting ability, stability, robustness, reliability, and forecast capacity.
Experimental and predicted activities for 1,2,4-Triazole derivatives were presented in Table 3. The low residual value between experimental and predicted activity indicates that the model is of high predictability.
S/number (molecules) |
Experimental activity (pBA) |
Predicted activity (pBA) |
Residual |
|---|---|---|---|
| 1 | 4.925 | 4.8922 | 0.0328 |
| 2 | 5.0345 | 4.8716 | 0.1629 |
| 3 | 5.0064 | 5.0941 | −0.0877 |
| 4 | 5.7386 | 5.8308 | −0.0922 |
| 5 | 5.5994 | 5.5803 | 0.0191 |
| 6 | 5.4543 | 5.6969 | −0.2426 |
| 7 | 4.7441 | 4.8047 | −0.0606 |
| 8 | 6.1674 | 6.2999 | −0.1325 |
| 9 | 6.3456 | 6.5053 | −0.1597 |
| 10 | 7.4134 | 7.1548 | 0.2586 |
| 11 | 5.7441 | 6.0862 | −0.3421 |
| 12 | 5.9258 | 5.6383 | 0.2875 |
| 13 | 5.6754 | 5.4834 | 0.192 |
| 14 | 6.3793 | 6.3443 | 0.035 |
| 15 | 6.1667 | 6.5432 | −0.3765 |
| 16 | 5.8765 | 6.8765 | −1.000 |
| 17 | 6.4171 | 6.1354 | 0.2817 |
| 18 | 5.9413 | 6.02517 | −0.08387 |
| 19 | 7.6397 | 7.6055 | 0.0342 |
| 20 | 8.0899 | 7.8436 | 0.2463 |
| 21 | 6.3981 | 6.2094 | 0.1887 |
| 22 | 5.8131 | 6.4308 | −0.6177 |
| 23 | 6.2878 | 6.30457 | −0.01677 |
| 24 | 5.7268 | 5.9933 | −0.2665 |
| 25 | 7.366 | 7.5444 | −0.1784 |
| 26 | 7.0123 | 6.8471 | 0.1652 |
| 27 | 6.5267 | 5.9850 | 0.5417 |
| 28 | 5.7405 | 6.0962 | −0.3557 |
| 29 | 5.6533 | 6.4796 | −0.8263 |
| 30 | 6.1923 | 6.0426 | 0.1497 |
| 31 | 7.3233 | 6.5095 | 0.8138 |
| 32 | 6.0097 | 6.3151 | −0.3054 |
| 33 | 6.0928 | 5.9501 | 0.1427 |
| 34 | 7.3279 | 7.3990 | −0.0711 |
| 35 | 6.8568 | 6.8761 | −0.0193 |
| 36 | 6.2234 | 8.6487 | −2.4253 |
| 37 | 7.3079 | 7.2405 | 0.0674 |
| 38 | 7.314 | 7.5050 | −0.191 |
| 39 | 8.5854 | 5.6969 | 2.8885 |
| 40 | 8.0615 | 8.1009 | −0.0394 |
| 41 | 8.0615 | 7.8073 | 0.2542 |
| 42 | 6.8494 | 7.6746 | −0.8252 |
| 43 | 7.9432 | 7.9352 | 0.008 |
| 44 | 7.4535 | 7.6946 | −0.2411 |
| 45 | 7.9759 | 7.8569 | 0.119 |
| 46 | 7.9759 | 8.2103 | −0.2344 |
| 47 | 7.9294 | 7.9408 | −0.0114 |
| 48 | 6.1213 | 5.9165 | 0.2048 |
| 49 | 5.4406 | 5.2695 | 0.1711 |
| 50 | 4.9074 | 4.8495 | 0.0579 |
-
Ntrain = 35, R2 = 0.92023900, Radj = 0.91017400, = 0.89538600, and the external validation for the test set was found to be R2pred = 0.8842.
All the validation parameters for this mode were reported in Table 4 and were all in agreement with parameters presented in Table 2, which actually confirmed the robustness of the model.
| S/number | Equation | |
|---|---|---|
| 1 | Friedman LOF | 0.40847300 |
| 2 | R-squared | 0.92023900 |
| 3 | Adjusted R-squared | 0.91017400 |
| 4 | Cross-validated R-squared ( | 0.89538600 |
| 5 | Significant regression | Yes |
| 6 | Significance-of-regression F-value | 58.41835200 |
| 7 | Critical SOR F-value (95%) | 2.45854700 |
| 8 | Replicate points | 0 |
| 9 | Computed experimental error | 0.00000000 |
| 10 | Lack-of-fit points | 28 |
| 11 | Min expt. error for nonsignificant LOF (95%) | 0.24688800 |
From the above models, it could be seen that maxHCsats and 3D-radial distribution function (RDF) descriptors were also observed in the model generated in this research. This indicates that these descriptors have great influence on the activities of the inhibitory compounds against Mycobacterium tuberculosis. The validation parameters reported in this work and those reported in the literature were all in agreement with parameters presented in Table 2, which actually confirmed the robustness of the model.
Descriptive statistics of the activity values of the training and test set data reported in Table 5 show that test set value range (8.2854 to 4.9074) was within the training set value range (8.0899 to 4.7441). Also, the mean and standard deviation of the test set activity value (6.4989 and 0.93) were approximately similar to those of the training set value (6.6222 and 0.96). This indicates that the test set is interpolative within the training. Therefore, Kennard and Stone’s algorithm employed in this study was able to generate a test set that is a good reflection of the training set.
| Statistical parameters | Activity | |
|---|---|---|
| Training set | Test set | |
| Number of sample points | 35 | 15 |
| Range | 3.3458 | 3.678 |
| Maximum | 8.0899 | 8.2854 |
| Minimum | 4.7441 | 4.9074 |
| Mean | 6.622234 | 6.498873 |
| Median | 6.3981 | 6.1213 |
| Variance | 0.924712 | 0.866467 |
| Standard deviation | 0.96162 | 0.93084 |
| Mean absolute deviation | 0.871588 | 0.703515 |
| Skewness | −8.48E − 04 | 0.87066 |
| Kurtosis | −1.24682 | 0.153415 |
The name and symbol of the descriptors used in the QSAR optimization model were reported in Table 6. The presence of the three 2D and three 3D descriptors in the model suggests that these types of descriptors are able to characterize better anti-Mycobacterium tuberculosis activities of the compounds. Pearson’s correlation matrix and statistics of the six descriptors employed in the QSAR model were reported in Table 7, which shows clearly that the correlation coefficients between each pair of descriptors are very low; thus, it can be inferred that there exists no significant intercorrelation among the descriptors used in building the model. The absolute t-statistics value for each descriptor is greater than 2 at 95% significant level, which indicates that the selected descriptors were good. The estimated Variance Inflation Factor (VIF) values for all the descriptors were less than 4, which imply that the model generated was statistically significant and the descriptors were orthogonal.
| S/number | Descriptors symbols | Name of descriptor(s) | Class |
|---|---|---|---|
| 1 | AATS7s | Average Moreau-Broto Autocorrelation-lag 7/weighted by I-state | 2D |
| 2 | nHBint3 | Count of E-state descriptors of strength for potential hydrogen bonds of path length 3 | 2D |
| 3 | minHCsatu | Minimum atom-type H E-state: H on C sp3 bonded to unsaturated C | 2D |
| 4 | TDB9e | 3D topological distance based autocorrelation-lag 9/weighted by Sanderson electronegativities | 3D |
| 5 | RDF90i | Radial distribution function-090/weighted by relative first ionization potential | 3D |
| 6 | RDF110s | Radial distribution function-110/weighted by relative I-state | 3D |
| Intercorrelation | Statistics | |||||||
|---|---|---|---|---|---|---|---|---|
| Descriptors | AATS7s | nHBint3 | minHCsatu | TDB9e | RDF90i | RDF110s | t-Stat | VIF |
| AATS7s | 1 | −3.9153 | 1.8931 | |||||
| nHBint3 | −0.29824 | 1 | 11.6469 | 1.2779 | ||||
| minHCsatu | 0.196097 | 0.269067 | 1 | 10.0386 | 3.6622 | |||
| TDB9e | 0.446768 | −0.19131 | −0.14868 | 1 | 5.66824 | 1.3493 | ||
| RDF90i | 0.097382 | −0.13902 | −0.39183 | 0.144839 | 1 | 9.45783 | 3.0968 | |
| RDF110s | 0.116862 | −0.25217 | −0.66819 | 0.208747 | 0.227911 | 1 | −5.5848 | 3.0275 |
The mean effect (ME) values and standard regression coefficient ( reported in Table 8 provide important information on the effect of the molecular descriptors and the degree of contribution in the developed model. The signs and the magnitude of these descriptors combined with their mean effects indicate their individual strength and direction in influencing the activity of a compound. The null hypothesis says that there is no significant relationship between the descriptors and the activities of the inhibitor compounds. The p values of the descriptors at 95% confidence limit shown in Table 8 are all less than 0.05. This implies that the alternative hypothesis is accepted. Hence, there is a relationship between the descriptors used in generating the model and the activities of the inhibitor compounds which take preference over the null hypothesis.
| Descriptors | Standard regression coefficient (bj) | Mean effect (ME) | p value (confidence interval) |
|---|---|---|---|
| AATS7s | −0.2769 | −0.31421 | 0.000527 |
| nHBint3 | 0.67675 | 0.153246 | 3E − 12 |
| minHCsatu | 0.987436 | 0.58264 | 8.84E − 11 |
| TDB9e | 0.338438 | 0.351968 | 4.48E − 06 |
| RDF90i | 1.097495 | 0.34097 | 3.25E − 10 |
| RDF110s | −0.49948 | −0.11461 | 5.62E − 06 |
Y-Randomization parameter test was reported in Table 9. The low R2 and Q2 values for several trials confirm that the developed QSAR model is robust, while the value greater than 0.5 affirms that the created model is powerful and is not inferred by chance.
| Model | R | R2 | Q2 |
|---|---|---|---|
| Original | 0.962302 | 0.926026 | 0.895386 |
| Random 1 | 0.387394 | 0.150074 | −0.28301 |
| Random 2 | 0.534646 | 0.285847 | −0.15518 |
| Random 3 | 0.357333 | 0.127687 | −0.43633 |
| Random 4 | 0.509588 | 0.25968 | −0.08884 |
| Random 5 | 0.231807 | 0.053735 | −0.60188 |
| Random 6 | 0.140884 | 0.019848 | −0.61556 |
| Random 7 | 0.513288 | 0.263465 | −0.11043 |
| Random 8 | 0.548099 | 0.300412 | −0.062 |
| Random 9 | 0.36673 | 0.134491 | −0.25601 |
| Random 10 | 0.505524 | 0.255554 | −0.12398 |
| Random models parameters | |||
| Average r | 0.409529 | ||
| Average r2 | 0.185079 | ||
| Average Q2 | −0.27332 | ||
| c | 0.837983 | ||
3.1. Interpretation of Selected Descriptors
AATS7s is average Moreau-Broto Autocorrelation-lag 7/weighted by I-state autocorrelation descriptor. It is based on spatial dependent autocorrelation function that measures the strength of the relationship between observations (atomic or molecular properties) and space separating them (lag). This descriptor is obtained by taking the molecule atoms as the set of discrete points in space and an atomic property as the function evaluated at those points. When this descriptor is calculated on molecular graph, the lag coincides with the topological distance between any pair of the vertices. AATS7s is defined on the molecular graphs using atomic masses (m), Sanderson electronegativity (e), and inductive effect of pairs of atoms 7 bonds apart as the weighting scheme. These observations suggested that atomic masses and electronic distribution of the atoms that made up the molecule had significant effect on the antitubercular activity of the dataset. In addition, the signs of the regression coefficients for each descriptor indicated the direction of influence of the descriptors in the models such that positive regression coefficient associated with a descriptor will augment the activity profile of a compound, while the negative coefficient will diminish the activity of the compound.
Electrotopological state atom-type descriptor nHBint3 represents count of E-state descriptors of strength for potential hydrogen bonds of path length 3. It is a spatial dependent 2D autocorrelation descriptor with the incorporation of Moran coefficient (index) in the measurement of the strength of the relationship between observations and space separating them. This Moran autocorrelation descriptor contained in the model reported in this study was defined on the molecular graphs using atomic masses (m), Sanderson electronegativity (e), and inductive effect of pairs of atom 3 bonds apart as the weighting scheme. These observations supported the claim that atomic masses and electronic distribution had significant effect on the antitubercular activities of the molecules The positive mean effect of this descriptor indicates that the inhibitory activity of 1,2,4-Triazole derivatives will increase with hydrogen bonds of path length 3.
minHCsatu (minimum atom-type H E-state: H on C sp3 bonded to unsaturated C) is a 2D electrotopological state (E-state indices) atom-type descriptor. In general, E-state indices encode the intrinsic electronic state of each atom as perturbed by the electronic influences of all other atoms in the molecule within the context of the topological character of the molecule. maxHCsatu favors the addition of –CH3 to unsaturated C atom, for example, in benzene ring. Positive contribution of minHCsatu indicates that the inhibitory activity of 1,2,4-Triazole derivatives will increase with increase in the molecular descriptor.
TDB9e (3D topological distance based autocorrelation-lag 9/weighted by Sanderson electronegativities) is positively correlated to the anticonvulsant activity, meaning that increase in its value augments the activity of the studied compounds. The descriptor measures the strength of the connection between atomic charges 9 bonds apart. The number of rings in the molecular system tends to increase the values of this descriptor as observed for molecules. This may be due to increase in the amount of π-electrons in the molecular system, bringing about increase in the charge difference between atoms 9 bonds apart. The positive mean effect indicates a positive impact on the activity of the inhibitory compounds, which means that increasing the value of this descriptor produces higher activity of these compounds.
RDF90i and RDF110s are 3D radial distribution functions at 2.5 and 7.0 interatomic distance weighted by atomic masses. The radial distribution function is probability distribution to find an atom in a spherical volume of radius. RDF descriptors are independent of the size and rotation of the entire molecule. They describe the steric hindrance or the structure-activity properties of a molecule. The RDF descriptor provides valuable information about the bond distances, ring types, planar and nonplanar systems, and atom types. The presence of these descriptors in the model suggested the occurrence of a linear relationship between antitubercular activity and the 3D molecular distribution of atomic masses in the molecules calculated at radius of 2.0 Å and 7.0 Å from the geometrical centers of each molecule. RDF90i with positive mean effect (MF) indicates positive impact on the activity, while RDF110s with negative mean effect (MF) indicates negative contribution on the activity.
Predicted activity against experimental activity of training and test set was shown in Figures 2 and 3. The R2 value of 0.9202 for training set and R2 value of 0.8842 for test set recorded in this study were in agreement with GFA-derived R2 value reported in Table 2. This confirms the stability, reliability, and robustness of the model. Plot of standardized residual versus experimental activity shown in Figure 4 indicates a symmetric distribution or random scattering of data points above and below the standardized residual line equal to zero. Also, all the data points were within the boundary defined by standardized residual of ±2. Thus, it implies that there was no systemic error in model developed as the spread of residuals was pragmatic on both sides of zero [20].


The standardized residuals in the dataset were plotted against their leverages for every compound, leading to discovery of outliers and influential molecules in the models. The Williams plot of the standardized residuals versus the leverage value is shown in Figure 5. From our result, it is evident that no outlier is found, since all the compounds for both the training and test set were within the applicability domain of the square area except for three compounds that are structurally influential molecules (i.e., compounds 50, 39, and 36). These three compounds are said to be structurally influential molecules, since their leverage values are greater than the warning leverage (h∗ = 0.60). Their high leverage values are responsible for swaying the performance of the model. This was attributed to strong differences in their chemical structures compared to other compounds in the dataset.

3.2. Molecular Docking
Molecular docking study was carried out between the target (Mtb CYP121) and 1,2,4-Triazole derivatives. All the compounds were found to inhibit the receptor by occupying the active sites of the target protein (Mtb CYP121).
For target protein, binding affinity values for all the compounds range from −5.1 to −14.6 kcal/mol as reported in Table 10. However, four ligands (compounds 7, 8, 13, and 14) have higher binding score, which ranges from −10.0 to 14.6 kcal/mol, which were greater than their co-ligands.
| Ligand | Target | Binding affinity (BA) Kcal/mol |
|---|---|---|
| 1 | Mtb CYP121 | −7.3 |
| 2 | Mtb CYP121 | −7.8 |
| 3 | Mtb CYP121 | −8.5 |
| 4 | Mtb CYP121 | −9.1 |
| 5 | Mtb CYP121 | −9.6 |
| 6 | Mtb CYP121 | −9.8 |
| 7 | Mtb CYP121 | −10.3 |
| 8 | Mtb CYP121 | −14.6 |
| 9 | Mtb CYP121 | −9.6 |
| 10 | Mtb CYP121 | −9.6 |
| 12 | Mtb CYP121 | −9.2 |
| 13 | Mtb CYP121 | −11.2 |
| 14 | Mtb CYP121 | −11.2 |
| 15 | Mtb CYP121 | −5.1 |
| 11 | Mtb CYP121 | −9.9 |
| 16 | Mtb CYP121 | −5.3 |
| 17 | Mtb CYP121 | −6.1 |
| 18 | Mtb CYP121 | −7.9 |
| 19 | Mtb CYP121 | −7 |
| 20 | Mtb CYP121 | −7.8 |
| 21 | Mtb CYP121 | −5.5 |
| 22 | Mtb CYP121 | −5.7 |
| 23 | Mtb CYP121 | −5.5 |
| 24 | Mtb CYP121 | −6.9 |
| 25 | Mtb CYP121 | −6.6 |
| 26 | Mtb CYP121 | −6.7 |
| 27 | Mtb CYP121 | −5.4 |
| 28 | Mtb CYP121 | −5.1 |
| 29 | Mtb CYP121 | −5.4 |
| 30 | Mtb CYP121 | −7.5 |
| 31 | Mtb CYP121 | −7.3 |
| 32 | Mtb CYP121 | −6.6 |
| 33 | Mtb CYP121 | −5.6 |
| 34 | Mtb CYP121 | −6 |
| 35 | Mtb CYP121 | −6.3 |
| 36 | Mtb CYP121 | −7.8 |
| 37 | Mtb CYP121 | −7.8 |
| 38 | Mtb CYP121 | −8.4 |
| 39 | Mtb CYP121 | −5.7 |
| 40 | Mtb CYP121 | −6.3 |
| 41 | Mtb CYP121 | −6.3 |
| 42 | Mtb CYP121 | −5.9 |
| 43 | Mtb CYP121 | −5.6 |
| 44 | Mtb CYP121 | −5.5 |
| 45 | Mtb CYP121 | −6.2 |
| 46 | Mtb CYP121 | −5.7 |
| 47 | Mtb CYP121 | −5.9 |
| 48 | Mtb CYP121 | −5.7 |
| 49 | Mtb CYP121 | −5.2 |
| 50 | Mtb CYP121 | −7.8 |
These four ligands were visualized and analyzed in Discovery Studio Visualizer as shown in Figure 6. Binding affinity, hydrogen bond, and hydrophobic bond of ligands 7, 8, 13, and 14 with M. tuberculosis target (Mtb CYP121) are reported in Table 11. Ligand (compound 7) formed hydrophobic interactions with VAL83 PRO285, VAL78, and ALA167 of the target site. In addition, ligand 7 also forms hydrogen bonds (2.16131 Å) with GLN385. Ligand 8 made three hydrogen bonds (2.82894, 2.34089, and 2.47314 Å) with ALA337, HIS343, and ALA233 of the target, while hydrophobic interactions were observed with PHE280, ALA233, CYS345, MET86, ALA233, and PRO346. Ligand 13 made two hydrogen bonds (2.34218 and 3.0328 Å) with ASN74 and GLN385, while VAL78, ALA233, PRO285, ALA233, PRO346, and ALA167 form the hydrophobic interaction. Ligand 14 formed hydrophobic interaction with LEU164, VAL228, VAL78, ALA233, PRO285, ALA233, PRO346, ALA167, and ALA233, while two hydrogen bonds (2.36479 and 3.03627 Å) were formed between ASN74 and GLN385 of the target.
| Ligand | Binding affinity (BA) Kcal/mol |
Target | Hydrogen bond | Hydrophobic interaction | |
|---|---|---|---|---|---|
| Amino acid | Bond length (Å) | Amino acid | |||
| 7 | −10.3 | Mtb CYP121 | GLN385 | 2.16131 | VAL83, PRO285, VAL78, VAL78, LA167 |
| 8 | −14.6 | Mtb CYP121 |
|
|
PHE280, ALA233, CYS345, MET86, ALA233, PRO346 |
| 13 | −11.2 | Mtb CYP121 |
|
|
|
| 14 | −11.2 | Mtb CYP121 |
|
|
|


4. Conclusion
The model with 2D and 3D descriptors is of higher excellence and presents a satisfactory correlation with the anti-Mycobacterium tuberculosis activity. The combination of 2D and 3D descriptors produces a better model to predict the anti-Mycobacterium tuberculosis activities of these compounds. The QSAR model generated met the criteria for minimum recommended value of validation parameters for a generally acceptable QSAR model. The molecular docking analysis has shown that nearly all the 1,2,4-Triazole derivatives potentially inhibit Mtb CYP121. However, compounds 7, 8, 13, and 14 have higher bind score ranging from −10.03 to −11.02 kcal/mol. These four compounds were able to be docked deeply within the binding pocket region of the Mtb CYP121, forming a hydrogen bond and hydrophobic interactions with amino acid of the target. The QSAR model generated provides a valuable approach for ligand base design, while the molecular docking studies provide a valuable approach for structure base design. These two approaches will be of great help for pharmaceutical and medicinal chemists to design and synthesize new anti-Mycobacterium tuberculosis compounds.
Conflicts of Interest
The authors declare that they have no conflicts of interest.