Measurement of the Euler Angles of Wurtzitic ZnO by Raman Spectroscopy
Abstract
A Raman spectroscopy-based step-by-step measuring method of Euler angles (φ, θ, and ψ) was presented for the wurtzitic crystal orientation on a microscopic scale. Based on the polarization selection rule and coordinate transformation theory, a series of analytic expressions for the Euler angle measurement using Raman spectroscopy were derived. Specific experimental measurement processes were presented, and the measurement of Raman tensor elements and Euler angles of the ZnO crystal were implemented. It is deduced that there is a trigonometric functional relationship between the intensity of each Raman bands of wurtzite crystal and Euler angle ψ, the polarization direction of incident light under different polarization configurations, which can be used to measure the Euler angles. The experimental results show that the proposed method can realize the measurement of Euler angles for wurtzite crystal effectively.
1. Introduction
The wide-band gap ZnO semiconductor material with hexagonal wurtzite crystal structure has excellent photoelectric properties. It is expected to become the next generation of the UV photoelectric material with excellent performance. And also, it has found wide extensive application prospects in many areas, such as piezoelectric gas sensor and pressure-sensitive sensor [1–3]. Since crystals often have different performances (e.g., electrical conductivity, thermal expansion coefficient, and mechanical strength) in different crystallographic orientations, fully grasping the crystallographic orientation parameters is necessary in the structural design of ZnO devices and mechanical behavior prediction for material microstructure. Namely, the relationship between crystallographic orientation and the observable characteristic direction of the device should be grasped. In short, the geometric relationship between the crystal coordinate system and specimen coordinate system, that is, Euler angles, needs to be determined.
The existing measurement methods of crystallographic orientations included etch-pit technique [4], neutron diffraction [5], electron backscatter diffraction (EBSD) [6–8], X-ray diffraction [9, 10], and micro-Raman spectroscopy [11]. For the etch-pit technique, it is destructive and restricted by a special erodent. The neutron diffraction method needs a long measurement time, and the neutron source construction and operation are expensive. The X-ray diffraction pattern may show no peaks at all in the whole scanning range when the deviation angle between the crystal plane and the sample surface is relatively large, making it difficult to assess the actual crystal orientation in such a case. The determination by micro-Raman spectroscopy has several advantages: (1) it needs no special preparation for the sample and is nondestructive, (2) the sample can be exposed to the air during the measurement, (3) spatial resolution is high (~1 μm), and (4) time required for the determination is relatively short. Hopkins and Farrow have determined the local crystallographic orientations of laser-recrystallized polycrystalline silicon in silicon-on-insulator (SOI) structures using polarized Raman spectroscopy [12]. Munisso et al. also employed this method to determine the crystallographic orientation of polycrystalline alumina [13]. The Euler angles of multicrystalline silicon have been determined by Becker et al. with Raman spectroscopy during the stress measurement, though this method involves complicated formulas and tedious calculations [14]. The validity of the Raman polarization analysis for the crystallographic orientation determination of the diamond and sapphire crystal has been demonstrated. However, the Raman measurement theory and method for the Euler angles of wurtzite crystal are still in the study stage.
In this article, based on the polarization properties of Raman spectra, the step-by-step measuring method for the Euler angle of the wurtzitic crystal is proposed. First, the theoretical formulas for the Euler angle measurement by Raman spectroscopy were deduced for wurtzite crystal. Subsequently, the specific experimental processes were given for the measurement of the Euler angles of a ZnO crystal. Using the sample with a known crystal orientation (A-plane), the Raman tensor elements of ZnO crystal were determined for the first time. Based on the proposed method, the Euler angles of the M-plane ZnO were measured step by step. Then, the experimental results were compared with the theoretical value to verify the validity of the presented method.
2. Theory
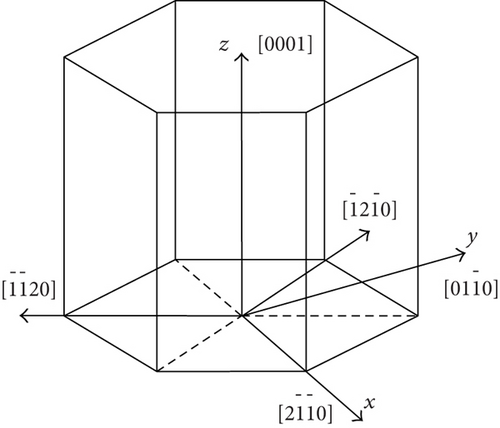
Crystal coordinate system is represented by xyz. The relationship between the hexagonal coordinates and Cartesian coordinates of wurtzite crystal is shown in Figure 1(a), where , , and z ∥[0001].
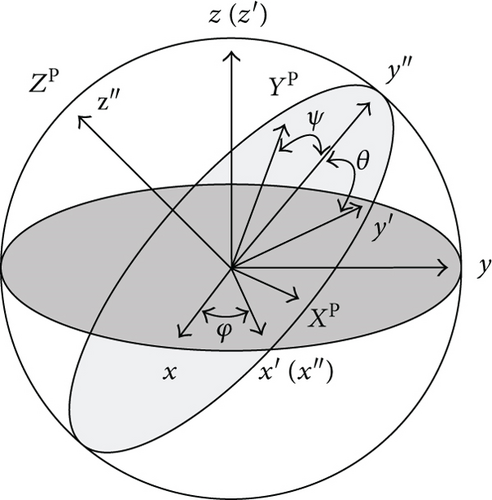
Specimen coordinate system is represented by XPYPZP. The relationship between specimen coordinates and crystal coordinates is shown in Figure 1(b). φ, θ, and ψ are the Euler angles which transform the crystal coordinate system to the specimen coordinate system. The values of φ, θ, and ψ are between 0 and 2π.
Therefore, the expression, can be used to calculate the Raman intensity in the specimen coordinate system.
Equations (7), (8), (18), (19), (20), and (21) describe the relationship of Raman intensities with θ and ψ in different polarization configurations. For the sample with known crystallographic orientation, such as A-plane ZnO sample, the Raman intensities of different in-plane rotation angles, ψ, under the same value of θ are measured; the curves of Raman intensity versus ψ were fitted by (7), (8), (18), (19), (20), and (21); the Raman tensor elements (a′, b′, c′, and d′) can be obtained. Further, for the sample with unknown crystallographic orientation, the Raman intensities of different in-plane rotation angles, ψ, under the same value of θ are also measured. According to (7), (8), (18), (19), (20), and (21) and combining the Raman tensor elements, the curves of Raman intensity versus ψ were fitted. Thus, the unknown Euler angles θc and ψc can be estimated.
In order to simplify fij, the values of θc and ψc are substituted into the expression fij. Thus, we can explicitly obtain a set of general expressions that depend on φ.
Solving the unknown parameters φ and r in (29) using the Gauss-Newton method, the value φc can be determined.
3. Experimental
The samples analyzed in this work were the A-plane and M-plane ZnO grown by the hydrothermal method. Both crystals were cut into square-shaped plates with a size of 5 × 5 mm2 and a thickness of 0.5 mm. The measurement surfaces of samples were polished to an optical grade. The crystallographic orientation of the studied crystal faces was preliminarily determined by means of X-ray diffraction analysis.
The macro-Raman measurements were performed at room temperature using a confocal Raman spectrometer (Renishaw InVia Reflex) with the 532 nm emission line of a semiconductor laser as excitation source. A ×100 objective lens was adopted, and the spot diameter is less than 1 μm.
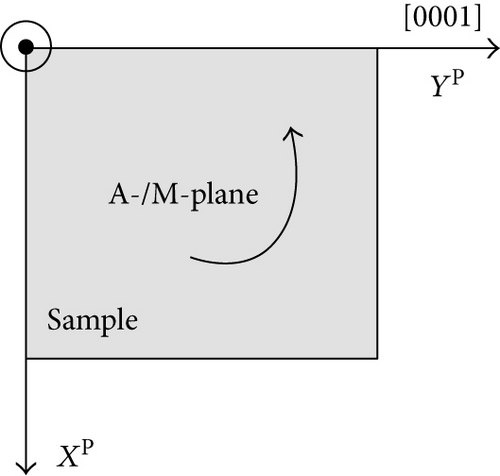
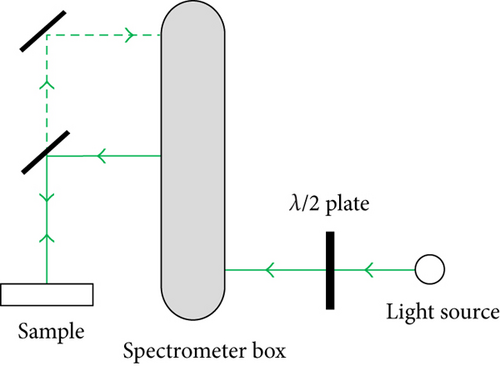
The YP axis (crystal orientation index was [0001]) of the specimen coordinate system of A-plane ZnO was horizontally placed on the experimental platform of Raman spectrometer, as shown in Figure 1(c). The A-plane sample was rotated counter-clockwise by 180 degrees by virtue of parallel polarization and cross polarization configuration, respectively. In the process of sample rotation, the Raman spectral data were collected every 10 degrees. The sample to be measured (M-plane) was placed on the Raman spectrometer in the same way as shown in Figure 1(c). The sample to be measured was rotated counterclockwise by 180 degrees through parallel polarization. In the process of sample rotation, the Raman spectral data were collected every 10 degrees. After that, the sample was rotated counterclockwise by 180 degrees, and 0-degree polarization analyzer (β = 0 degree) was used for the light path in Raman spectrometer. The λ/2 wave plate was placed between the light source and the spectrometer box as shown in Figure 1(c). The λ/2 wave plate was rotated clockwise by 90 degrees along the laser propagation direction. In the rotation process of the λ/2 wave plate, Raman spectral data were collected every 5 degrees.
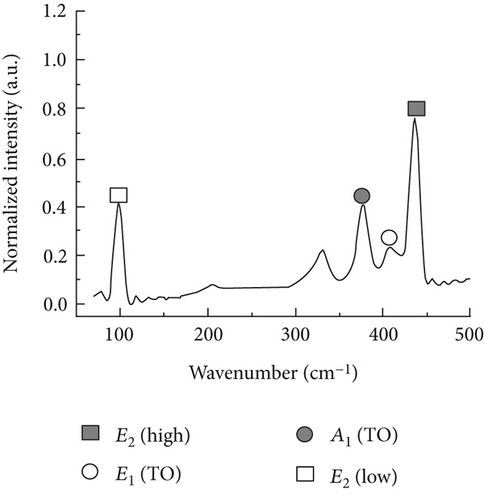
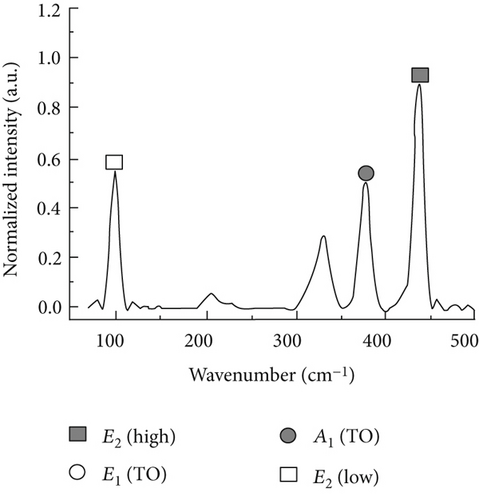
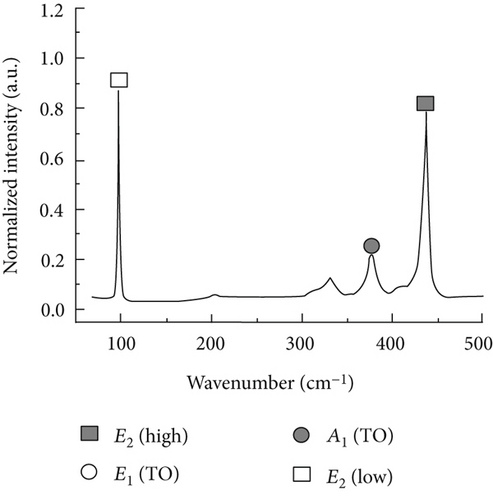
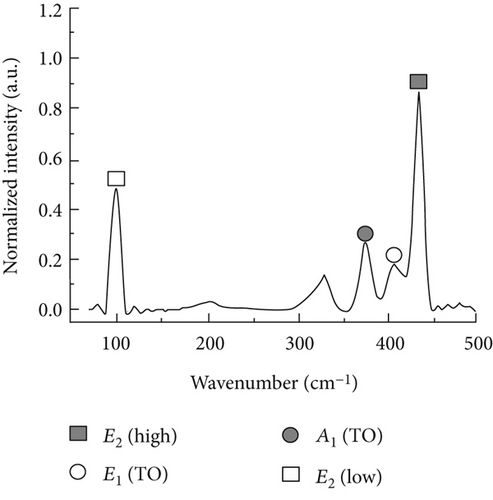
Raman spectra collected on the A-plane sample and M-plane sample of the wurtzitic ZnO single crystals with different polarized configurations are shown in Figure 2. We can clearly observe four first-order optical bands (E2 (low; 99 cm−1), A1 (TO; 378 cm−1), E1 (TO; 407 cm−1), and E2 (high; 437 cm−1)) of A-plane ZnO under the parallel polarization; E2 (low; 99 cm−1), A1 (TO; 378 cm−1), and E2 (high; 437 cm−1) bands can be observed under the cross polarization. As to the M-plane ZnO, we can clearly observe three first-order optical bands, E2 (low), A1 (TO), and E2 (high), under the parallel polarization and four first-order optical bands, E2 (low), A1 (TO), E1 (TO), and E2 (high), under the cross polarization. The observed vibration bands are in good agreement with the theoretical calculation results based on the polarization selection rules.
Figures 3(a) and 3(b) show the experimentally detected intensity variations at A1 (TO) and E1 (TO) bands of the A-plane ZnO single crystal (θ = 90°) as a function of in-plane rotation angle ψ. Raman intensities collected at the A1 (TO) band under both parallel and cross polarization were fitted by theoretical equations (7) and (8), according to the least-square method. The constants a′ = 0.91 and b′ = −0.935 were then obtained. An average value of the constant c′, c′ = 1.275, was extracted from the results of fitting the experimental data in Figure 3(b) by (18) and (20).
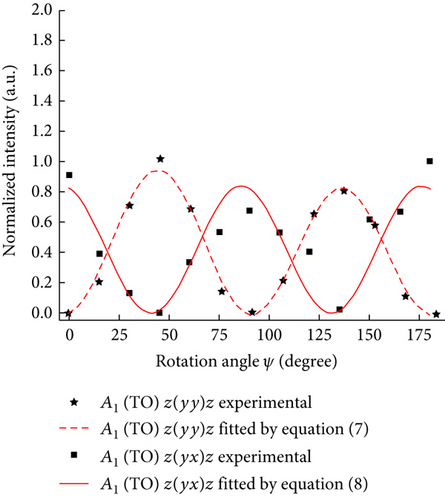
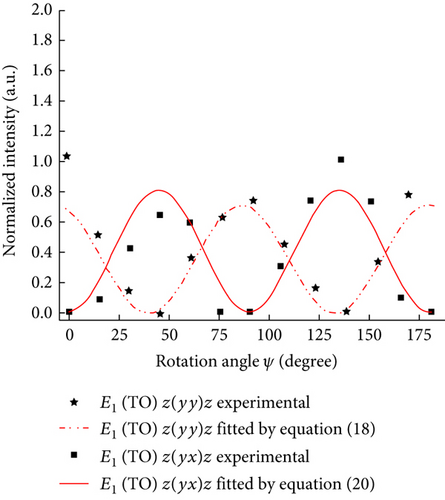
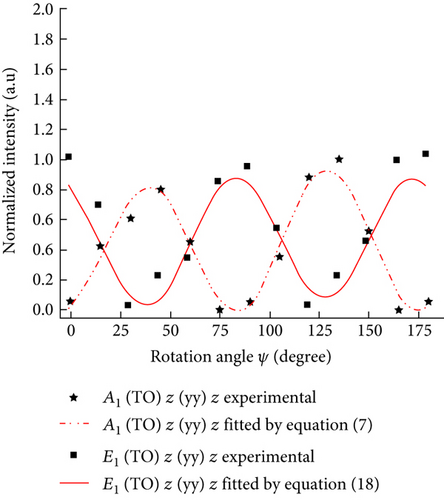
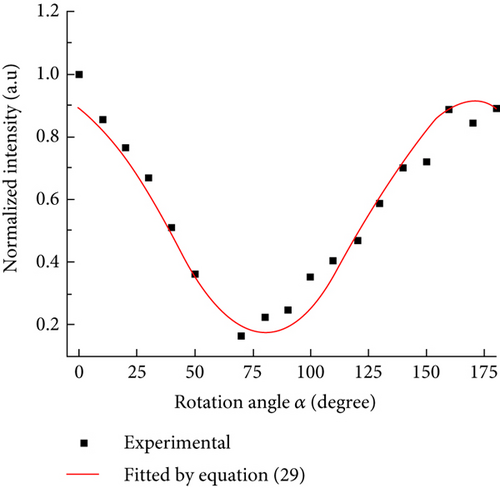
Figure 3(c) shows the intensity variations at A1 (TO) and E1 (TO) bands of M-plane ZnO single crystal as a function of the in-plane rotation angle ψ. Substituting the values of a′, b′, and c′ into (7) and (18), the angular dependence of the intensity of the Raman bands was fitted according to the least-square method and then we got the values of ψc and θc (ψc = 128.97°, θc = 89.87° and ψc = 128.97°, θc = 97.0°). Their average values are ψc = 128.93° and θc = 93.44°, respectively. Raman intensity at the E2 (low) band of M-plane ZnO changed with the polarization direction of incident light, α, as shown in Figure 3(d). The values of U1 = 0.89, U2 = −0.126, and U3 = 0.194 were obtained from a least-square fitting of the plot shown in Figure 3(d). Substituting the values of u1 and u2 (u1 = 4.75 and u2 = −7.06) into the equation system (29), the value of the Euler angle φc can be obtained (φc = −3.67°).
The Miller index of M-plane sample used in the experiment is . The theoretical values of Euler angles calculated by (1) are φc = 0°, θc = 90°, and ψc = 120°. These values are in agreement with experimental values ( φc = −3.67°, θc = 93.44°, and ψc = 128.93°). Therefore, the measurement of Euler angles of wurtzitic ZnO by Raman spectroscopy is feasible.
4. Conclusions
Based on the polarization selection rule and coordinate transformation theory, the step-by-step method for the Euler angle of the crystal of wurtzitic ZnO is proposed. A series of theoretical formulas regarding the Euler angle measurement were deduced. The specific experimental processes were given. The measurement of the Raman tensor elements and Euler angles of a ZnO crystal were achieved. The results show a trigonometric functional relationship between the intensities at each Raman band of wurtzite crystal and the Euler angle, ψ, under different polarization configurations. Fitting the curves of measured Raman intensity versus ψ, the Raman tensor elements and Euler angles θ and ψ can be obtained. There is also a trigonometric functional relationship between the intensities at each Raman band and the polarization direction of incident light, which can be used to measure the Euler angle φ. The experimental results show that the method proposed in this paper can effectively realize the measurement of Euler angles for wurtzite crystal. Our investigation provides the approach for the nondestructive measurement of crystal orientation on the microscale, which can be used to determine the crystallographic orientation of small crystals, local micro regions of crystals, and thin epitaxial films.
Conflicts of Interest
The authors declare that there is no conflict of interests regarding the publication of this paper.
Acknowledgments
The authors acknowledge the financial support from the National Natural Science Foundation of China (nos. 11302149 and 11422219), the Tianjin Application Foundation and Frontier Technology Research Program (no. 15JCQNJC05000), the Natural Science Foundation of Hebei Province (no. A2016202195), and the Innovation Team Training Plan of Tianjin Universities and Colleges (no. TD12-5043).


