The Study of Frost Occurrence in Free State Province of South Africa
Abstract
The study investigated the cessation, onset, and duration of light, medium, and heavy frost in Free State province of South Africa using minimum temperatures from 1960 to 2015. Trends in the frost indices were assessed using the Man-Kendall test. Onset of frost varied spatially with earlier onset over the northern, eastern, and southeastern parts. Areas of early onset also experience late cessation of frost resulting in shorter growing period of less than 240 days. The western parts have longer growing period exceeding 240 days due to earlier cessation of frost and relatively late onset of frost. Trends for the frost-free period (growing period) show contrasting negative and positive trends with isolated significant trends.
1. Introduction
Maize (Zea mays) is a major crop in Sub-Saharan Africa as it forms a staple food of most people in the region [1]. South Africa is amongst the ten highest maize producing countries in the world with an average of 12 million tonnes per year, contributing approximately 2% of the world’s maize production [2]. Free State province produces over 35% of the maize in South Africa [3]. However, the average maize yield for the province varies greatly from one year to another, mainly, due to climate variability [4]. Overall the environmental conditions and natural resources of Free State are conducive for maize production but there are also agroclimatological hazards that have a detrimental effect on production [4, 5]. These restrictive occurrences include drought, late cessation of frost that damages early planted crops, early onset of frost affecting crops at later stages of their growth, sporadic hail occurrence, and low temperatures during the growing period resulting in reduced maize crop production [6, 7].
Apart from drought, farmers consider frost as the major hazard that influences their year to year production [8]. On an annual basis across most frost-prone countries, onset of frost in autumn and cessation of frost in spring cause damage to late planted or long-season crops and early planted crops during the early vegetative stage, respectively [9]. There are four main characteristics of frosts: the onset of frost or first frost date, cessation of frost or last frost date, duration of the frost-free or frost period, and the frequency of frosts. The cessation of frost in southern Africa marks the beginning of the growing period which occurs mostly during the months of September and October, while the onset of frost indicates that the growing period of most summer crops is coming to an end, which normally occurs in April, May, and June [5]. Studies by Tait and Zheng [10], Rahimi et al. [11], and Varshavian et al. [9] emphasized the importance of frost analyses, especially how knowledge about the frequency and timing of frosts will help reduce the risk of damage in frost vulnerable areas as well as minimizing future frost damage. Due to the interannual variability of frost, continuous updating of frost dates is necessary to reflect recent climatic events [12].
Different temperature thresholds are used for determining frost. For example, Zenoni et al. [13] studied the risk related to late frost using five different thresholds (−1°C, −2°C, −3°C, −4°C, and −5°C). Hejazizadeh and Naserzadeh [14] categorized frost as weak (0°C to 2°C), moderate (−2°C to −4°C), or severe (below −4°C) in Iran. Trasmonte et al. [15] studied the frost risk in the Mantaro River basin of Peru using the following limits: 5°C, 2.5°C, 0°C, −2°C, and −4°C. The threshold to use has to be specific according to a crop of interest but different thresholds can also be used to show severity of frost risk or to accommodate a variety of crops. Grain crops including maize freeze at temperatures below 0°C, so a screen temperature of 0°C is a suitable indicator of damaging frost [16]. The critical temperature for maize is between −1°C and −2°C [17]. Trasmonte et al. [15] used the 5°C threshold to determine the frost risk analysis for the maize crop due to its sensitivity to low temperatures.
The risk of frost varies greatly in Free State province due to the contrasting topography and geographical aspect. Thus, there is a need to investigate the variability of the frost indices in the region and their impact on agricultural production. In this study, frost risk for dryland maize production in Free State was assessed using three thresholds: −2°C, 0°C, and 2°C. These thresholds have been determined based on previous studies in other regions [11, 13–17]. Three main indices were determined for each threshold: onset of frost, cessation of frost, and duration of frost-free period. Trends in these indices were assessed at selected stations in Free State with data from 1960 to 2015.
2. Data and Methods
2.1. Data
All the data used was obtained from the Agricultural Research Council (ARC) and the South African Weather Service (SAWS). The daily minimum temperature dataset was used in the analysis for determination of frost risk assessment in Free State province. The data used in the study was recorded inside a Stevenson screen elevated at 1.3 m above ground level. The data was arranged by agricultural season (July to June). Nine stations scattered in different parts of the province were selected with data efficiency exceeding 70% from 1960 to 2015 (Figure 1; Table 1).
| Station | Latitude | Longitude | Altitude (m) | Region |
|---|---|---|---|---|
| Bethlehem | −28.1626 | 28.2953 | 1631 | Northeastern |
| Bloemfontein | −28.9500 | 26.3333 | 1304 | Central |
| Bothaville | −27.4000 | 26.5000 | 1280 | Northern |
| Fauresmith | −29.7700 | 25.3200 | 1522 | Southwestern |
| Ficksburg | −28.8667 | 27.8500 | 1829 | Eastern |
| Frankfort | −27.2667 | 28.5000 | 1502 | Northeastern |
| Virginia | −28.1000 | 26.8667 | 1335 | Northwestern |
| Wepener | −29.7333 | 27.0333 | 1438 | Southeastern |
| Zastron | −30.3000 | 27.0830 | 1661 | Southeastern |
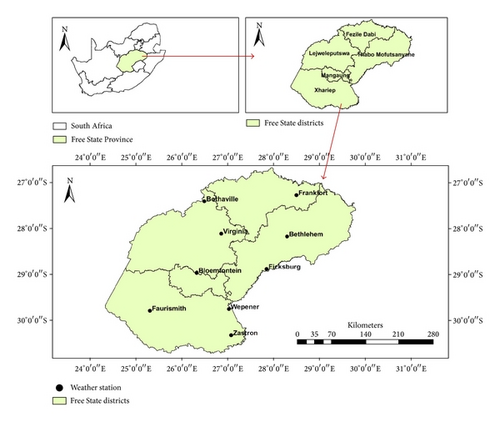
Where necessary, the data was patched with the UK traditional method which uses the nearest neighbour stations (up to five) to determine average temperature values in a particular month and then uses the differences (target station long-term mean temperature – neighbour station long-term mean temperature) in values to patch within that month [18]. A patched value is taken from the average of all the predicted values from each nearby station.
2.2. Methods
2.2.1. Determination of Frost Occurrence
The data was arranged according to agricultural season from July to June of the following year. For each season the last day of frost in spring (cessation of frost) and the first day of frost in autumn (onset of frost) were determined at each of the stations and for each year. Screen temperatures of greater than 0°C upper bounded by 2°C are considered as light frost. Minimum temperatures recorded on the screen greater than −2°C upper bounded by 0°C are considered as medium frost, while minimum temperatures of −2°C or lower represent heavy frost. The frost dates were converted to Julian days to facilitate statistical computations. The frost-free period for each agricultural season was then calculated for light, medium, and heavy frost occurrences as the number of days between last and first frost. The frost-free period is the most important index which marks the length of the growing period for most crops in the high lying regions.
2.2.2. Statistical Analysis
Minitab software was used to determine the appropriate probability distribution for all the variables (onset, cessation, and frost period) at each station. All the data for different frost indices at thresholds were tested for the following distributions at 95% confidence level: Normal, LogNormal, Gamma, Exponential, Weibull, Logistic, and LogLogistic. The best distribution was selected based on the highest significant (>0.05) p values. The onset of frost, cessation of frost, and frost-free period were determined for different probability levels based on the selected distribution to assess frost occurrence in Free State province. To clearly show the risk associated with the onset of frost, cessation of frost, frost period, and frost-free period, the exceedance probability was used for the cessation of frost while the nonexceedance probability was used for the other frost indices.
2.2.3. Trends in Frost Incidences
To determine whether there are trends in the onset of frost, cessation of frost, and duration of frost, the Man-Kendall test was carried out at 95% and 90% confidence levels.
3. Results
Frost indices varied widely throughout Free State province. The analysis of frost probabilities is at 20%, 50%, and 80% nonexceeding/exceeding showing a return period of 4 in 5 years for nonexceeding(1 in 5 years for exceeding), 1 in 2 years, and 1 in 5 years for nonexceeding (4 in 5 years for exceeding), respectively.
3.1. Distribution Fitting
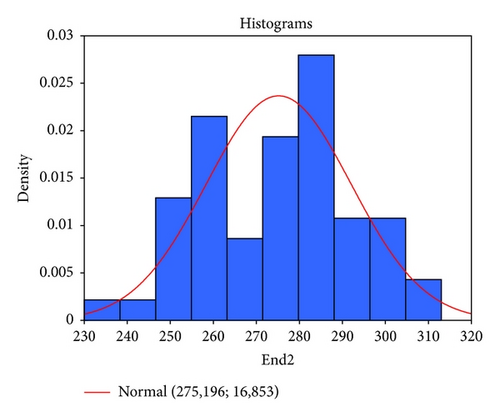
The best-fit distribution for the cessation of frost at 2°C, 0°C, and −2°C is LogNormal, LogNormal, and Normal, respectively (Table 2). Onset of frost for all the thresholds mainly followed the Normal distribution in Free State province. Normal distribution was the dominant distribution for the duration of frost followed by the Weibull distribution which is mostly evident at the frost threshold of 0°C. These distributions were significant at 95% confidence level and showed highest p values amongst all the distributions. Figure 2 shows an example of probability fitting for the Bethlehem station. The results of the Kolmogorov-Smirnov test yielded a p value of 0.76 for the Normal distribution which is significant at 95%.
| Station | Cessation of frost | Onset of frost | Duration of frost | ||||||
|---|---|---|---|---|---|---|---|---|---|
| 2°C | 0°C | −2°C | 2°C | 0°C | −2°C | 2°C | 0°C | −2°C | |
| Bethlehem | Normal | LogNormal | LogLogistic | Logistic | Normal | Normal | Normal | Weibull | Weibull |
| Bloemfontein | LogNormal | LogNormal | Normal | Normal | Normal | Normal | Normal | Normal | Normal |
| Bothaville | LogNormal | LogNormal | Weibull | Normal | Logistic | LogNormal | Normal | Normal | Normal |
| Fauresmith | Normal | LogNormal | Normal | LogNormal | Normal | LogNormal | LogNormal | Normal | LogNormal |
| Ficksburg | LogNormal | LogNormal | LogNormal | Normal | Normal | Normal | LogNormal | Normal | Normal |
| Frankfort | Normal | Normal | Normal | Weibull | Normal | Normal | Normal | Weibull | LogNormal |
| Virginia | LogNormal | LogNormal | Normal | Normal | Normal | Normal | Weibull | Weibull | Normal |
| Wepener | Normal | LogNormal | LogLogistic | Normal | Normal | Normal | LogLogistic | Weibull | Normal |
| Zastron | Gamma | LogNormal | LogLogistic | Normal | Normal | Normal | Normal | Weibull | Normal |
3.2. Cessation of Frost
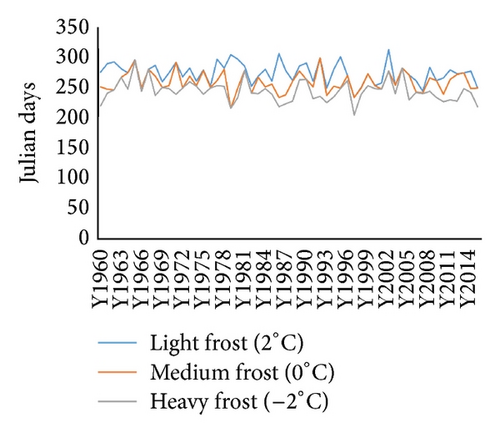
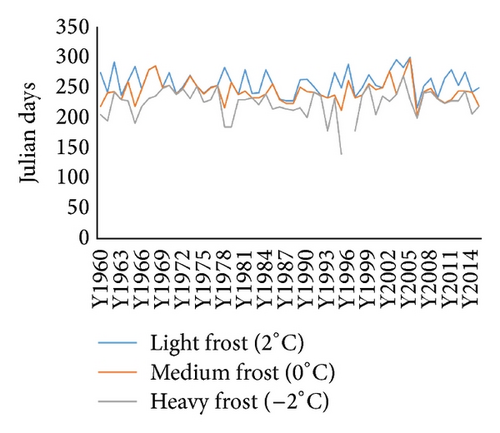
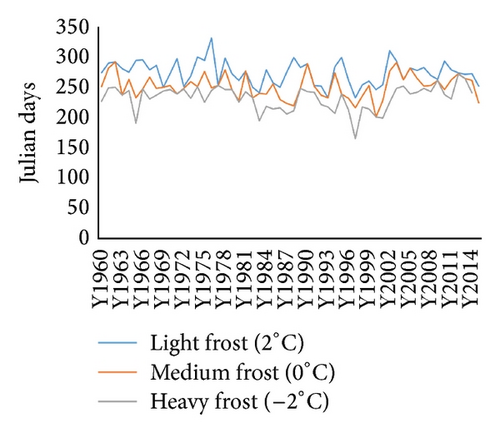
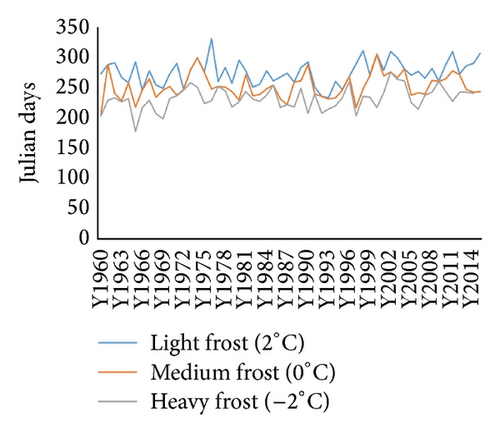
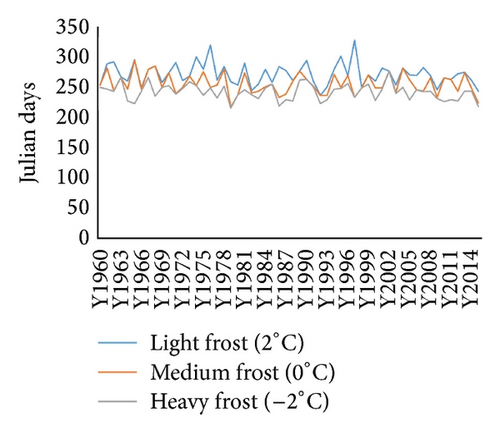
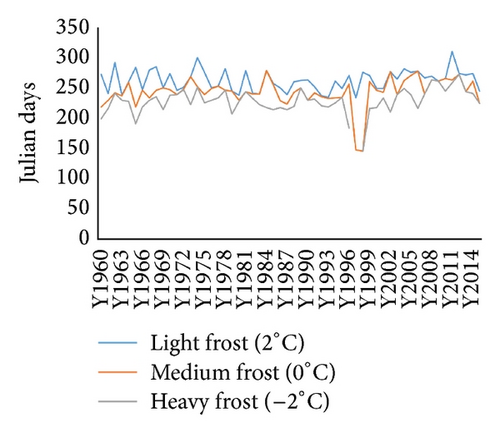
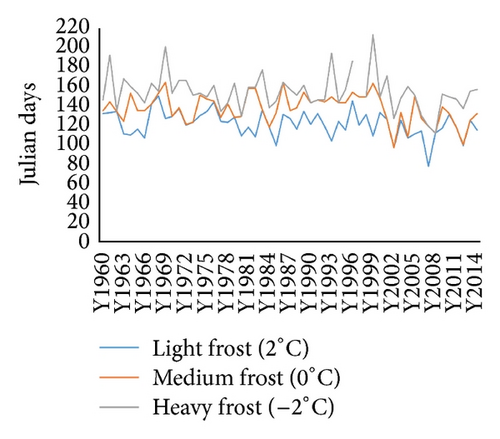
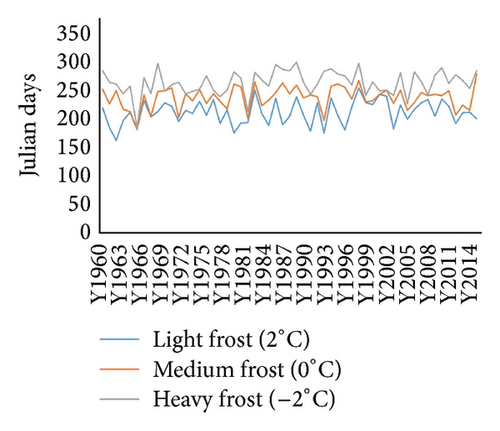
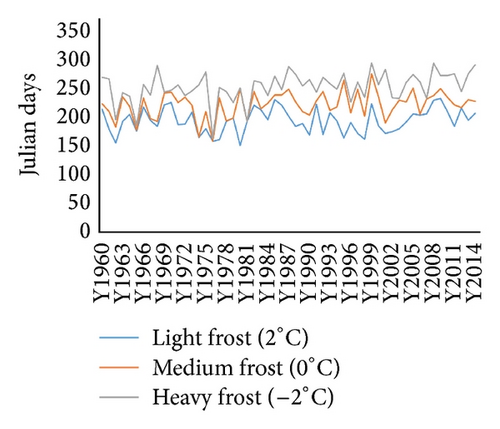
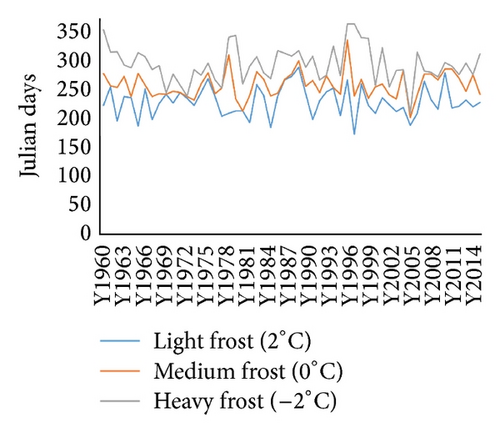
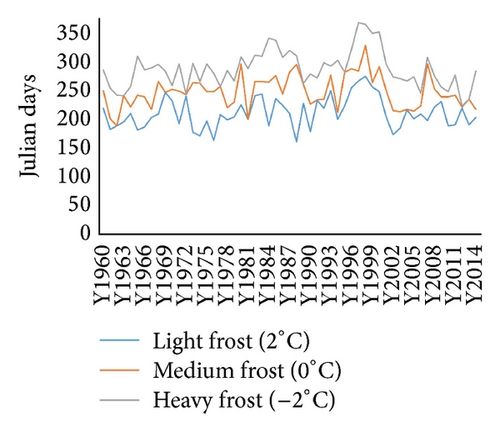
Cessation of frost in Free State as shown in Figure 3 and Table 3 occurs earliest in the areas surrounding Virginia and Bothaville over northern parts of the province with exceedance probability of 20%, 50%, and 80% for light (medium) [heavy] frost on or after 1 October, 16 September, and 17 August (12 September, 1 September, and 17 August) [26 August, 14 August, and 28 July]. Occurrence of light (medium) [heavy] frost is mostly on or after 16 October, 30 September, and 13 September (25 September, 7 September, and 26 August) [8 September, 24 August, and 10 August] at 20%, 50%, and 80% exceedance probability in the northeastern parts (vicinity of Frankfort, Bethlehem, and Ficksburg) and southwestern parts (vicinity of Fauresmith) of the province. Relatively late cessation of frost is evident over the central parts and high lying areas in the southeastern, eastern, and northeastern parts (vicinity of Wepener, Zastron, and Bloemfontein). Light (medium) [heavy] frost at 20%, 50%, and 80% is mostly experienced on or after 22 October, 10 October, and 26 September (9 October, 21 September, and 10 September) [21 September, 7 September, and 27 August]. As shown in Figure 3, the extremely late cessation of frost over Free State occurred between 26 October and 26 November (6 October and 26 November) [26 September and 26 November] for light, medium, and heavy frost, respectively. This is an indication that frost risk is high in Free State province with a chance of frost damage well within the rainfall season with the potential of damaging crops at the vegetative stage [5]. Time series of cessation of frost shows a lot of variation from one year to another with an average standard deviation of 19 days for all the frost thresholds (Figure 3).
| Station | 20% | 50% | 80% | ||||||
|---|---|---|---|---|---|---|---|---|---|
| 2°C | 0°C | −2°C | 2°C | 0°C | −2°C | 2°C | 0°C | −2°C | |
| Bethlehem | 15-Oct | 29-Sep | 13-Sep | 01-Oct | 15-Sep | 31-Aug | 17-Sep | 2-Sep | 19-Aug |
| Bloemfontein | 25-Oct | 09-Oct | 24-Sep | 10-Oct | 21-Sep | 07-Sep | 26-Sep | 4-Sep | 20-Aug |
| Bothaville | 02-Oct | 02-Oct | 31-Aug | 14-Sep | 14-Sep | 16-Aug | 29-Aug | 29-Aug | 28-Jul |
| Fauresmith | 18-Oct | 25-Sep | 03-Sep | 01-Oct | 07-Sep | 20-Aug | 13-Sep | 22-Aug | 05-Aug |
| Ficksburg | 22-Oct | 29-Sep | 08-Sep | 03-Oct | 12-Sep | 24-Aug | 14-Sep | 26-Aug | 10-Aug |
| Frankfort | 16-Oct | 28-Sep | 12-Sep | 30-Sep | 15-Sep | 01-Sep | 16-Sep | 1-Sep | 21-Aug |
| Virginia | 01-Oct | 12-Sep | 26-Aug | 16-Sep | 01-Sep | 14-Aug | 03-Sep | 21-Aug | 02-Aug |
| Wepener | 24-Oct | 12-Oct | 23-Sep | 11-Oct | 26-Sep | 09-Sep | 28-Sep | 10-Sep | 27-Aug |
| Zastron | 26-Oct | 11-Oct | 21-Sep | 14-Oct | 26-Sep | 09-Sep | 02-Oct | 12-Sep | 29-Aug |
3.3. Onset of Frost
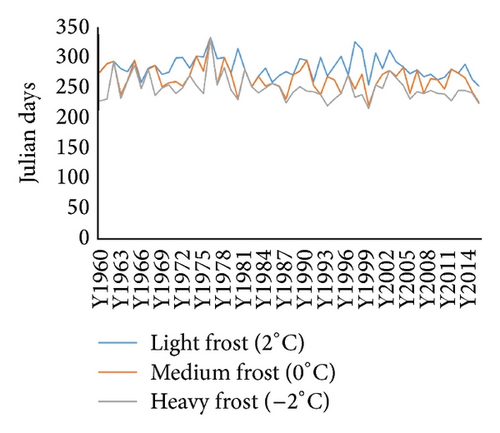
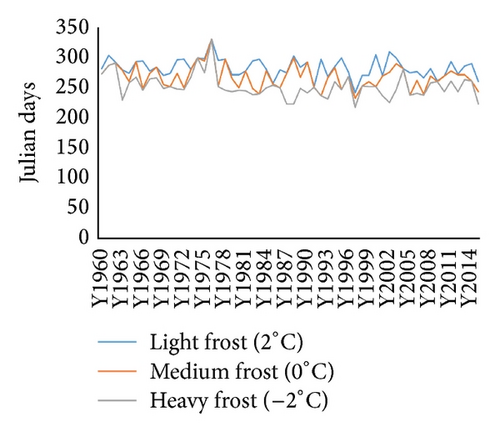
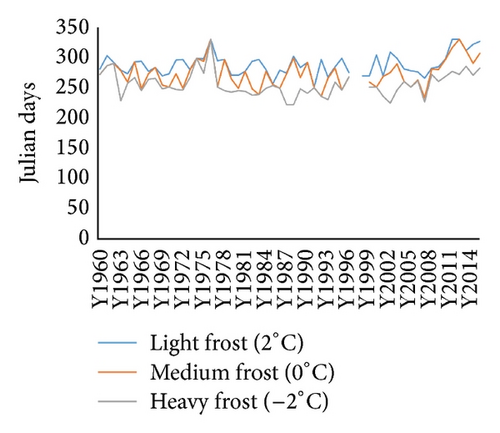
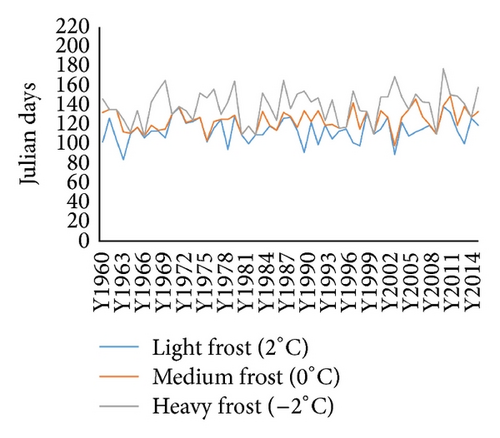
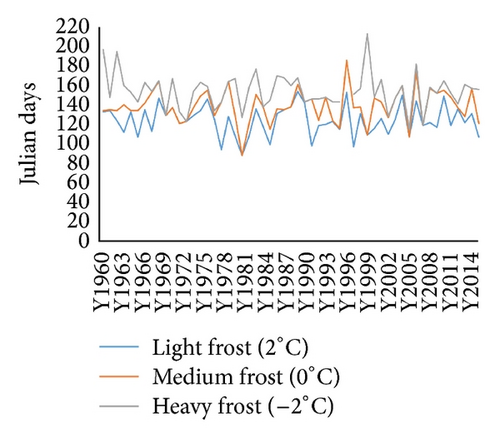
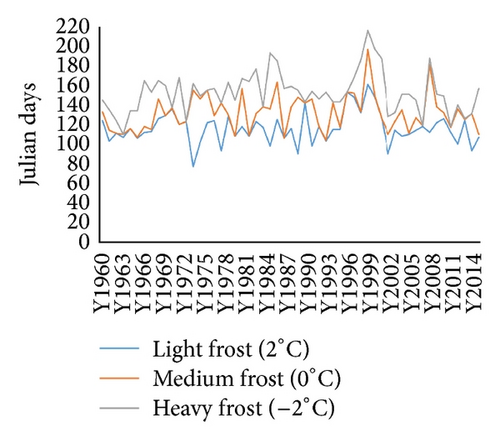
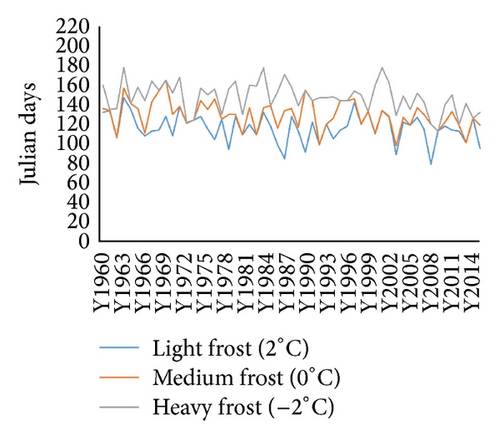
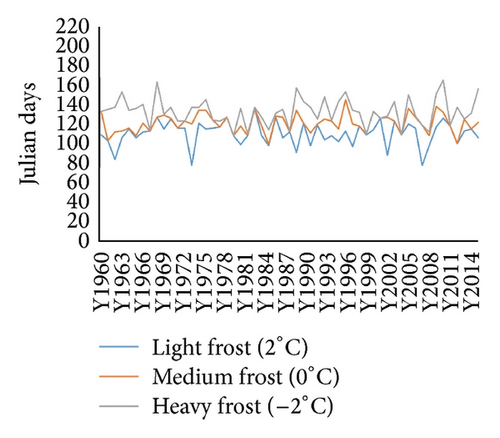
Onset of frost at nonexceeding probabilities of 20%, 50%, and 80% is latest over the northern parts of the province (neighbourhoods of Bothaville and Virginia) with light (medium) [heavy] frost occurring on or before 23 April, 4 May, and 17 May (11 May, 21 May, and 31 May) [21 May, 6 June, and 21 June] (Table 4). Over the northeastern parts (vicinity of Bethlehem, Frankfort, and Ficksburg) onset of frost at 20%, 50%, and 80% nonexceeding probabilities for light (medium) [heavy] frost occurs on or before 15 April, 25 April, and 7 May (27 April, 7 May, and 19 May) [7 May, 17 May, and 28 May]. Frost over the southeastern, eastern, and northeastern parts (vicinity of Wepener, Zastron, and Bloemfontein) is earlier with the timing of light (medium) [heavy] frost at 20%, 50, and 80% probability mostly being on or before 9 April, 18 April, and 28 April (20 April, 1 May, and 12 May) [1 May, 14 May, and 27 May]. Onset of frost for all three thresholds varies greatly over the years with the average standard deviation across all the stations for light, medium, and heavy frost of 13, 14, and 16, days, respectively (Figure 4). Extremely early onset of frost ranges from 18 March to 29 March (29 March to 14 April) [1 April to 25 April] for light, medium, and heavy frost, respectively. This implies that frost-sensitive crops have to be fully matured by mid-March in order to avoid frost damage (Figure 4).
| Station | 20% | 50% | 80% | ||||||
|---|---|---|---|---|---|---|---|---|---|
| 2°C | 0°C | −2°C | 2°C | 0°C | −2°C | 2°C | 0°C | −2°C | |
| Bethlehem | 15-Apr | 27-Apr | 07-May | 25-Apr | 06-May | 17-May | 03-May | 15-May | 28-May |
| Bloemfontein | 12-Apr | 22-Apr | 03-May | 22-Apr | 01-May | 17-May | 02-May | 09-May | 30-May |
| Bothaville | 20-Apr | 04-May | 18-May | 04-May | 17-May | 02-Jun | 17-May | 30-May | 18-Jun |
| Fauresmith | 11-Apr | 26-Apr | 16-May | 25-Apr | 10-May | 01-Jun | 10-May | 23-May | 19-Jun |
| Ficksburg | 13-Apr | 26-Apr | 17-May | 25-Apr | 07-May | 29-May | 07-May | 19-May | 10-Jun |
| Frankfort | 11-Apr | 22-Apr | 01-May | 22-Apr | 01-May | 12-May | 30-Apr | 09-May | 23-May |
| Virginia | 23-Apr | 11-May | 21-May | 03-May | 21-May | 06-Jun | 14-May | 31-May | 21-Jun |
| Wepener | 09-Apr | 20-Apr | 01-May | 18-Apr | 01-May | 14-May | 28-Apr | 12-May | 27-May |
| Zastron | 08-Apr | 19-Apr | 01-May | 18-Apr | 30-Apr | 14-May | 28-Apr | 11-May | 27-May |
3.4. Frost-Free Duration
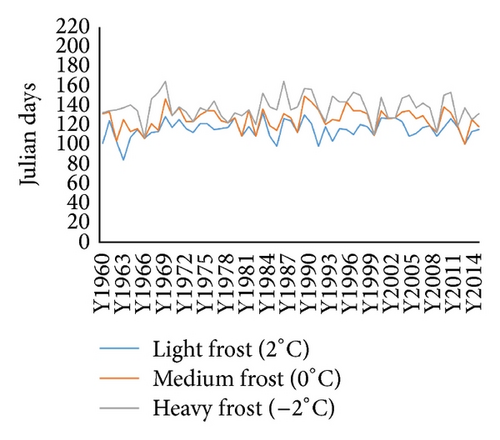
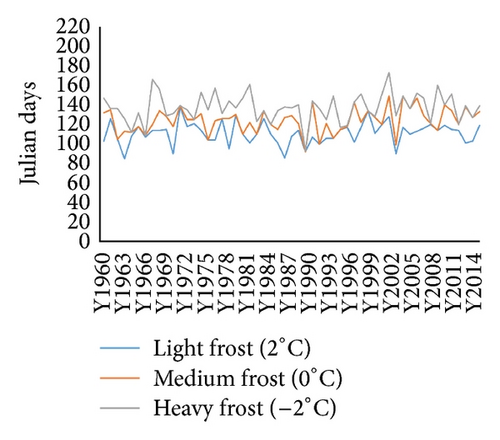
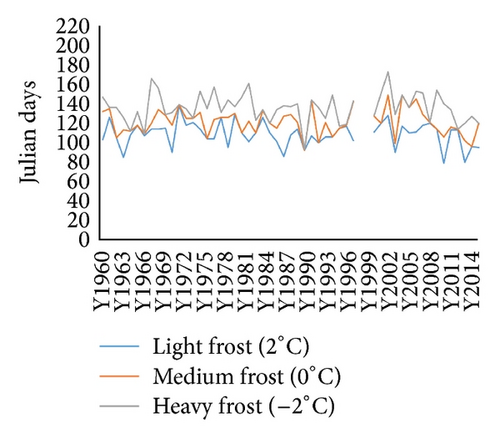
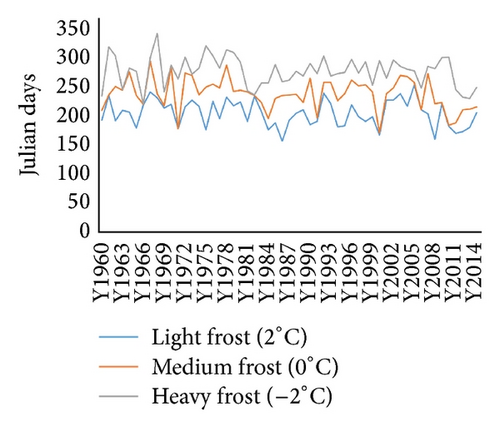
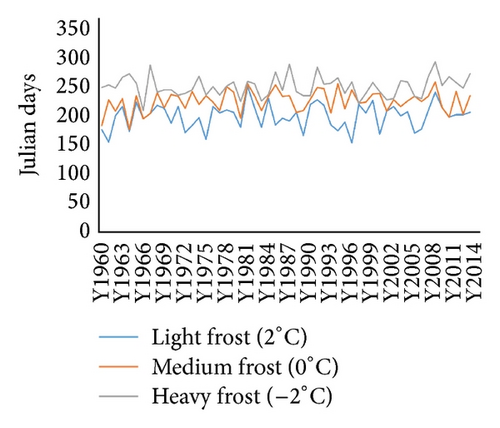
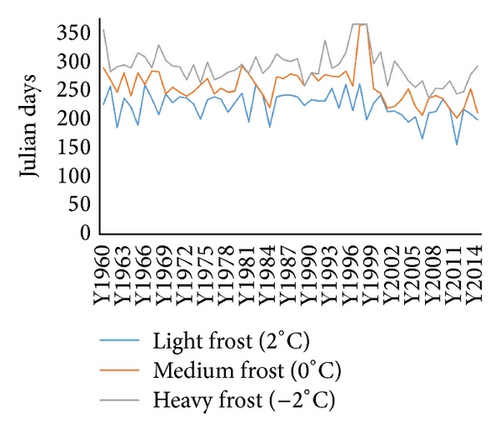
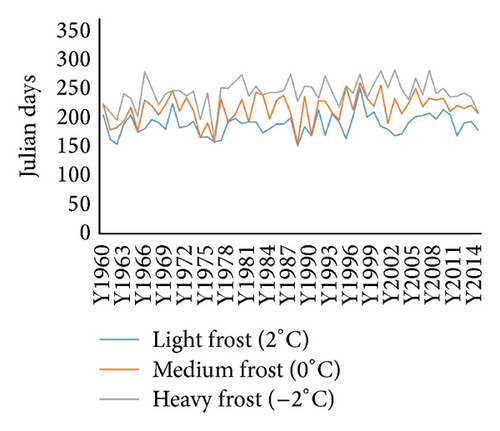
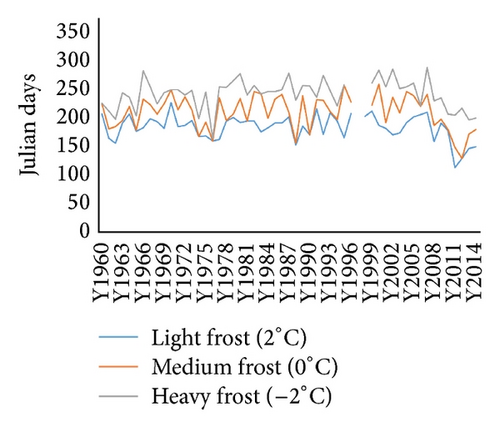
The frost-free period spatial pattern follows that of the onset and cessation of frost. Areas of longest length of frost-free period are evident over the northern parts of the province with light (medium) [heavy] frost at 20%, 50%, and 80% nonexceedance probability being 213, 231, and 254 (245, 263, and 277) [278, 297, and 325] days or less (Table 5). Other areas over the northeastern parts like Bethlehem, Ficksburg, and Frankfort have their frost-free duration for light (medium) [heavy] frost at 20%, 50%, and 80% probability of less than or equal to 183, 202, and 225 (218, 238, and 248) [240, 260, and 273] days. Areas of short frost-free season are mostly over the southeastern parts, close to the escarpments along the border with Lesotho. Frost-free duration for light (medium) [heavy] at 20%, 50%, and 80% in these areas is mostly equal to or less than 173, 189, and 207 (198, 221, and 239) [226, 245, and 265] days. Year to year variation of frost-free period is high over Free State province, as depicted in Figure 5, with average standard deviation of 23, 25, and 26 days for light, medium, and heavy frost, respectively.
| Station | 20% | 50% | 80% | ||||||
|---|---|---|---|---|---|---|---|---|---|
| 2°C | 0°C | −2°C | 2°C | 0°C | −2°C | 2°C | 0°C | −2°C | |
| Bethlehem | 179 | 218 | 240 | 200 | 235 | 260 | 220 | 248 | 276 |
| Bloemfontein | 175 | 201 | 244 | 194 | 222 | 259 | 212 | 243 | 273 |
| Bothaville | 209 | 243 | 269 | 231 | 256 | 297 | 254 | 270 | 325 |
| Fauresmith | 185 | 221 | 262 | 207 | 246 | 287 | 232 | 271 | 314 |
| Ficksburg | 183 | 216 | 261 | 202 | 238 | 278 | 225 | 260 | 295 |
| Frankfort | 183 | 215 | 238 | 202 | 232 | 253 | 221 | 245 | 268 |
| Virginia | 213 | 245 | 278 | 231 | 263 | 293 | 246 | 277 | 308 |
| Wepener | 173 | 198 | 226 | 189 | 221 | 245 | 207 | 239 | 265 |
| Zastron | 173 | 195 | 229 | 187 | 218 | 247 | 201 | 237 | 265 |
3.5. Trends in Frost Indices
Cessation of frost over Free State province mostly shows a negative trend which is significant at 10% significance level for the 2°C and 0°C thresholds, while at −2°C the threshold trend is significant at 5% significance level (Table 6). Negative trends show that cessation of frost is becoming earlier over time implying that planting of crops can be early depending on the soil water content status. In most places, cessation of frost becomes earlier by an average of 2, 3, and 4 days per decade for light, medium, and heavy frost. In contrast, significant positive trends are obtained in Virginia and Ficksburg whereby cessation of frost is becoming later by an average of 3 days per decade for all the frost thresholds. Onset of frost mostly shows nonsignificant positive trends in most parts of Free State with the exception of Virginia and Ficksburg showing a significant negative trend. Subsequently, frost-free duration is mostly positive for the province with significant trends at Bethlehem (light frost) [2 to 3 days’ increase per decade], Bloemfontein (medium and heavy frost) [2 to 5 days’ increase per decade], and Wepener (medium and heavy frost) [2 to 5 days’ increase per decade]. Positive trends are an indication that minimum temperatures are increasing with time over the region, implying an increase of favourable conditions for crops that are sensitive to low temperatures. In contrast, significant negative trends are evident in Ficksburg and Virginia at a rate ranging from 2 to 6 days per decade.
| Station | Cessation of frost | Onset of frost | Frost-free duration | ||||||
|---|---|---|---|---|---|---|---|---|---|
| 2°C | 0°C | −2°C | 2°C | 0°C | −2°C | 2°C | 0°C | −2°C | |
| Bethlehem | Neg (NS) | Neg (NS) | Neg (∗) | Pos (NS) | Pos (NS) | Pos (NS) | Pos (∗∗) | Pos (NS) | Pos (NS) |
| Bloemfontein | Neg (∗∗) | Neg (∗∗) | Neg (∗) | Pos (NS) | Pos (NS) | Pos (∗∗) | Pos (NS) | Pos (∗) | Pos (∗) |
| Bothaville | Neg (NS) | Neg (NS) | Neg (NS) | Neg (NS) | Pos (NS) | Neg (NS) | Neg (NS) | Pos (NS) | Neg (NS) |
| Fauresmith | Neg (∗∗) | Neg (NS) | Neg (NS) | Pos (NS) | Pos (NS) | Pos (NS) | Pos (NS) | Pos (NS) | Pos (NS) |
| Ficksburg | Pos (∗∗) | Pos (∗∗) | Pos (∗) | Neg (∗) | Neg (∗) | Neg (NS) | Neg (∗) | Neg (∗) | Neg (∗) |
| Frankfort | Neg (NS) | Neg (∗∗) | Neg (∗) | Pos (NS) | Pos (NS) | Neg (NS) | Pos (NS) | Pos (NS) | Neg (NS) |
| Virginia | Pos (NS) | Pos (∗) | Pos (∗) | Neg (∗) | Neg (∗) | Neg (∗∗) | Neg (∗) | Neg (∗) | Neg (∗) |
| Wepener | Neg (∗) | Neg (∗) | Neg (∗) | Pos (NS) | Pos (∗∗) | Pos (NS) | Pos (NS) | Pos (∗) | Pos (∗∗) |
| Zastron | Pos (NS) | Neg (NS) | Neg (NS) | Neg (NS) | Neg (NS) | Neg (NS) | Neg (NS) | Neg (NS) | Pos (NS) |
- Pos = positive; Neg = negative; (∗)significant at 5%; (∗∗)significant at 10%; (NS)not significant.
4. Discussion
Frost analysis is important because knowledge of the frequency and timing of frosts will help reduce the risk of frost damage in vulnerable areas [19]. The present study investigated frost risk assessment in Free State province of South Africa at different thresholds (−2°C, 0°C, and 2°C) taking into consideration multiple risk levels (20%, 50%, and 80% exceedance). Probable dates for the first frost and last frost of the growing season can also help farmers in preventing or reducing the damage to agricultural produce caused by frost [11]. Consequently, knowledge of the frost-free period can be used as a proxy for the length of time available for crop production [20].
The assessment of frost occurrence in Free State showed considerable variation from one place to another owing to the vast differences in topography over the province. The results of the frost risk assessment show earlier frost onset, late cessation of frost, and shorter growing period over the northeastern, central, eastern, and southeastern parts. These areas are more vulnerable to frost especially if planting is early and this forces farmers to delay their planting resulting in shorter growing periods suitable for short or medium cultivars [5]. Late planted crops in these areas are also in danger of not achieving full maturity before suffering from damage resulting in poor quality yield or production loss in extreme cases. The first frost at the onset of a frost period causes damage to crops at their later stages of development, while the last frost at the cessation of the frost period damages seedlings and young plants [11, 21]. Farmers in these regions are advised to plant short season varieties taking into consideration all the frost indices. Trends in frost indices are mostly favourable for increasing frost-free period implying that the planting of relatively longer cultivars might be suitable in the future depending on the rate of frost-free period increase. The length of the frost-free period denotes the growing period, and, in Free State, it is mostly between 160 days and over 330 days, depending on the temperature threshold and locality. Long frost-free periods are evident over patches in the far western and northeastern Free State. These areas have low frost risk but it does not mean they are the most desirable places for planting maize or any other crops sensitive to frost damage under rain-fed conditions as there are other climate risks like rainy season length and agricultural drought that have to be considered [22].
In Free State, the frost differences in the risk levels between onset and cessation of frost were mostly 10 days from one risk level to another at all the temperature thresholds which does not denote vast temporal differences to the advantage of crop management in the province. Depending on the timing of the onset of rains, which normally runs parallel with cessation of frost in southern Africa, farmers are advised to utilize either the 50% or the most risk averse level (20th exceedance probability) to minimize crop losses at the seedling stage. Targeting of maturity before the onset of frost should be the practice without compromising on crop yield. In some places, like the eastern Free State, careful consideration of the cultivar which has a high potential but requires relatively lower heat units accumulation is desirable.
5. Conclusion
The spatial patterns of the frost indices at 20%, 50%, and 80% probability are similar. Overall, very late cessation of frost occurs over the east and southeastern Free State. These areas are also characterized by very early onsets resulting in shorter frost-free periods as compared to other regions. In these areas, planting early would definitely harm the seedlings while planting very late would result in crops not attaining their full maturity before the risk of frost increases. The window for planting is therefore relatively short in these places. In contrast, most parts of the northern, western, and southwestern Free State experience relatively long growing periods making them ideal for planting long-season crops providing that other climate requirements have low risk in those areas. In general, the results show low frost risk in the far western parts of the province, increasing gradually towards the east where the late frost cessation and early onset risks are high. Trend analysis showed a tendency of positive trends of frost-free period in some areas implying an increase in minimum temperatures with time. The rate of increase in frost-free period ranges from 1 to 5 days per decade depending on the location and severity of frost.
Competing Interests
The authors declare that there is no conflict of interests regarding the publication of this paper.
Acknowledgments
The authors are grateful for funding by the Department of Agriculture, Forestry and Fisheries (Project no. 000544). The authors thank Dr. Thomas Fyfield of the Agricultural Research Council for editing the manuscript.


