Exploitation of Documented Historical Floods for Achieving Better Flood Defense
Abstract
Establishing Base Flood Elevation for a stream network corresponding to a big catchment is feasible by interdisciplinary approach, involving stochastic hydrology, river hydraulics, and computer aided simulations. A numerical model calibrated by historical floods has been exploited in this study. The short presentation of the catchment of the Tisza River in this paper is followed by the overview of historical floods which hit the region in the documented period of 130 years. Several well documented historical floods provided opportunity for the calibration of the chosen numerical model. Once established, the model could be used for investigation of different extreme flood scenarios and to establish the Base Flood Elevation. The calibration has shown that the coefficient of friction in case of the Tisza River is dependent both on the actual water level and on the preceding flood events. The effect of flood plain maintenance as well as the activation of six potential detention ponds on flood mitigation has been examined. Furthermore, the expected maximum water levels have also been determined for the case if the ever observed biggest 1888 flood hit the region again. The investigated cases of flood superposition highlighted the impact of tributary Maros on flood mitigation along the Tisza River.
1. Introduction
According to the concept of flood defense relying on the Base Flood Elevation corresponding to the design flood of a given recurrence interval, the expected maximum water levels need to be determined all along the river. It is not a clear task, since the BFE depends on many factors, among others on the actual condition of the tributary network in the considered catchment. Producing a suitable solution tool—a flow analysis numerical model—requires interdisciplinary approach exploiting statistical hydrology, river hydraulics, and computer science. In case of large catchments the numerical model may become complex due to the big number of tributaries involved, all having specific flow conditions [1–5]. High velocities and low discharges are characteristic to the upstream tributaries [1] and low velocities and high discharges are typical to the river sections in lowlands [4, 5].
A flow analysis software package known by acronym HEC-RAS has been adopted in this study by the authors. It is capable of accounting for a wide variety of conditions and influences. However, it needs to be calibrated for the conditions of extreme floods which are unique in many aspects [6, 7]. Not any flood event is suitable for calibration purposes, since all aspects of extreme floods need to be revealed by the chosen floods [8].
Once the model is set up properly, it can be used to simulate different possible flood scenarios having specific chance of occurrence [2, 9], imposing certain level of threat to the community. The model produces information regarding maximum water levels along the reaches, corresponding to the modeled extreme flood event. Exhaustive investigation of scenarios corresponding to well-documented historical floods finds out the expected highest peak water levels, in consequence, the safest solution. This approach—applicable to any catchment—is presented in this paper through the example of the Tisza River.
The catchment of the Tisza River is chosen by reason, since due to its size and characteristics it exhibits a number of special conditions which might influence the expected maximum water levels (inhomogeneous hydrological conditions over the subcatchments, intensive change of the river bed due to erosion/deposition, superposition of flood waves coming from tributaries, and so on). The catchment of the Tisza River having area of 157.200 km2 is considered to be the most important tributary of the Danube River. Approximately 30% of the total catchment area of the Tisza River spreads in the Hungarian lowlands, while the rest 70% is in the territory of Slovakia, Ukraine, Romania, and Serbia. In terms of elevations, 46% of the catchment is below 200 MSL (related to the Baltic Sea), 34% is between 200 and 500 MSL, and the remaining 20% is located between 500 and 1600 MSL. The annual drainage exceeds 1500 mm in the highest parts of the catchment, while it remains below 28 mm in the lowlands, producing discharge from 50 l/s to 0.8 l/s per square km of the catchment.
The shape of the catchment is almost circular having diameter of 460 km in the north–south direction and 520 km in the east–west direction. Extreme climate conditions over the catchment, the relative contribution of individual tributaries (Upper-Tisza, Tur, Szamos, Kraszna, Lonyai Canal, Bodrog, Sajo-Hernad, Eger-Creek, Lasko-Creek, Zagyva, Koros, Maros, Aranka, and Bega) to the total flow of the Tisza River, extremely low bed slope of the section stretching in the Hungarian lowlands, significant amount of sediment carried by the river, and the existing water training works altogether make the Tisza River one of the most variegated rivers in the region, producing extreme floods as well as extreme low flow periods. As a result, 1919, 1941, 1970, 1980, and 1998 were plentiful in water. Contrarily, 1921, 1943, 1961, 1973, 1990, and 1994 were short in water.
There is no other river in Europe which encountered so radical reduction in length by regulation works (from 1398.9 km to 945.8 km). The flow is restricted by embankments almost along its whole length, while three dams built in the recent five decades radically changed the mid- and low-flow regimes. On the one hand, the mentioned regulation works along with the deforestation of the catchment increased the runoff and the peak flood discharges. On the other hand, the increased water demand of the industry and of the agriculture further reduced the low discharges during the dry periods.
For the ongoing radical anthropogenic impacts on the flow regime of the river during the last century and due to the risks involved, this study targets extreme flood events. Past floods can be employed for calibration of a suitable numerical model, used later as a tool for predicting the possible outcome of extreme flood scenarios. This opportunity has been investigated by this study.
2. Methods and Materials
2.1. Overview of Historical Floods in the Catchment of the Tisza River
The basic parameters of a flood wave are its volume, peak discharge, and duration. Actually, the hydrograph of the flood wave provides the most information. The peak water level caused by the flood wave—depending on the location and time of interest—is rather consequence than basic parameter of the flood. Table 1 shows the peak water levels of the observed historical floods at four river stations along the Tisza River together with the corresponding intermittent periods.
| Vasarosnameny | Tokaj | Szolnok | Szeged | ||||||||||||
|---|---|---|---|---|---|---|---|---|---|---|---|---|---|---|---|
| Year | Peak level (cm) | Intermittent period (year) | Intermittent period, record breaking floods (year) | Year | Peak level (cm) | Intermittent period (year) | Intermittent period, record breaking floods (year) | Year | Peak level (cm) | Intermittent period (year) | Intermittent period, record breaking floods (year) | Year | Peak level (cm) | Intermittent period (year) | Intermittent period, record breaking floods (year) |
| 1888 | 900 | 1888 | 872 | 1888 | 818 | 1888 | 847 | ||||||||
| 1895 | 840 | 7 | 1895 | 815 | 7 | 1895 | 827 | 7 | 7 | 1889 | 805 | 1 | |||
| 1915 | 830 | 10 | 1915 | 825 | 20 | 1915 | 808 | 20 | 1895 | 884 | 6 | 7 | |||
| 1919 | 850 | 4 | 1919 | 860 | 4 | 1919 | 884 | 4 | 24 | 1913 | 802 | 8 | |||
| 1932 | 848 | 13 | 1924 | 802 | 5 | 1924 | 846 | 5 | 1919 | 916 | 6 | 20 | |||
| 1940 | 802 | 8 | 1932 | 856 | 8 | 1932 | 894 | 8 | 13 | 1924 | 872 | 5 | |||
| 1947 | 885 | 7 | 1940 | 818 | 8 | 1940 | 880 | 8 | 1932 | 923 | 8 | 13 | |||
| 1962 | 816 | 15 | 1941 | 800 | 1 | 1941 | 856 | 0 | 1940 | 847 | 8 | ||||
| 1964 | 850 | 2 | 1964 | 857 | 23 | 1953 | 801 | 12 | 1941 | 855 | 1 | ||||
| 1968 | 800 | 4 | 1967 | 831 | 3 | 1962 | 836 | 9 | 1962 | 820 | 21 | ||||
| 1970 | 912 | 2 | 82 | 1970 | 858 | 3 | 1964 | 853 | 2 | 1970 | 960 | 8 | 38 | ||
| 1974 | 848 | 4 | 1979 | 880 | 9 | 91 | 1966 | 855 | 2 | 1974 | 804 | 4 | |||
| 1978 | 870 | 4 | 1980 | 837 | 1 | 1967 | 881 | 1 | 1979 | 842 | 5 | ||||
| 1979 | 853 | 1 | 1981 | 805 | 1 | 1970 | 909 | 3 | 38 | 1981 | 873 | 2 | |||
| 1981 | 834 | 2 | 1998 | 872 | 17 | 1974 | 840 | 0 | 1999 | 817 | 18 | ||||
| 1985 | 831 | 4 | 1999 | 894 | 1 | 20 | 1977 | 880 | 3 | 2000 | 930 | 1 | |||
| 1993 | 876 | 8 | 2000 | 928 | 1 | 1 | 1979 | 904 | 2 | ||||||
| 1995 | 843 | 2 | 2001 | 847 | 1 | 1980 | 873 | 1 | |||||||
| 1998 | 923 | 3 | 28 | 1981 | 885 | 1 | |||||||||
| 1999 | 830 | 1 | 1998 | 897 | 17 | ||||||||||
| 2000 | 882 | 1 | 1999 | 974 | 1 | 29 | |||||||||
| 2001 | 941 | 1 | 3 | 2000 | 1041 | 1 | 1 | ||||||||
| 2001 | 836 | 1 | |||||||||||||
The 1885 flood is of exceptional importance, not only for its volume, but for the fact it was the last extreme flood before regulation works along the Tisza River commenced. Meander cutoffs and restriction of the river by levees increased the peaks of successive floods. The 1879 flood destroyed more than 93% of buildings in Szeged and claimed 151 lives. The flood peak in 1888 was the absolute maximum until 1919, while it is still not overpassed at Dombrad. Following the accomplishment of the regulation works, the 1895 flood—even though moderate compared to the earlier ones—caused significant damage. The 1919 flood was distinctive in sense of threatening public security all along the river. Following the 1932 flood the practice of watercourse-restricting measures in flood control was abandoned. The flood in 1940 was associated with ice. In 1941 three floods occurred, one in January-February, the second in March-April, and the third in September-October. More moderate floods were characteristics of 1942. The following significant flood happened in 1964. The biggest flood ever—in terms of both peak discharge and duration—happened in 1970. It lasted 125 days, 65 settlements have been evacuated, and 43000 people have been engaged in flood defense. The following flood in 1979 produced peak level at Szolnok just 5 cm below the earlier maximum. In 1991 and in 2000 the earlier highest level (detected in 1970) was exceeded by 1.5 m, an increment not experienced for about a century. Proceeded by an early spring flood significant flood happened in fall 1998. The flood in 1999 was triggered by snowmelt and by the changes in the river bed during the last three decades. This flood was extraordinary in terms of peak level, velocity, and duration, exceeding the corresponding values of the 1970 flood. Leaking of dikes in 1100 locations was discovered (and treated), intervention in cases of 127 boils was needed, and creeping of embankment face in 26 cases has been registered. 2001 was not easier at all. 2005 and 2006 produced a flood lasting through the winter to the spring, supported by snowmelt and intensive rainfall in April. The 2010 flood was triggered by extraordinary rains, bringing six times more precipitation than average to the watershed.
Not only are the main parameters of the flood events informative; looking at the details of their genesis is even more instructive. In case of the Tisza River, in general, floods occur mostly at spring in the period of March–May. Floods are least probable in September. In addition to the extreme meteorological conditions, excessive floods are triggered by late snowmelts accompanied with heavy spring rainfalls, or by coincidence of tributary peak discharges, and by restricting the flood plain by embankments.
2.2. The Modeled Stream Network of the Tisza River
- (i)
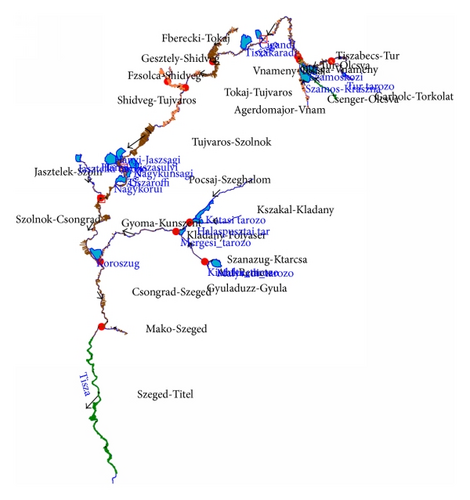
Five on the Tisza River: the Beregi, Cigandi, Nagykunsagi, Hanyi-Tiszasulyi, and Tiszaroffi.
- (ii)
One on the Szamos: the Szamos-Krasznai.
- (iii)
One on the Fekete-Koros: the Malyvadi.
- (iv)
One in the junction of the Fekete Koros and the Feher-Koros: the Kisdelta detention pond.
2.3. The HEC-RAS Model
Computer aided analysis of well-documented, reliable, historical flood data is the most instructive and straightforward way of learning about floods and predicting the most likely consequences [6]. The River Analysis System software—known by acronym as HEC-RAS—developed in the Hydrologic Engineering Center by the US Army Corps of Engineers has been adopted for this study by the authors [10, 11]. The HEC-RAS software is capable of simulating 1D steady and unsteady flow in a system of natural and constructed channels, producing as a result the corresponding water surface profiles and the related data.
The general principles of modeling unsteady flow in systems of open channels in the HEC-RAS environment are given in [3, 5, 12, 13]. Unsteady flow routing using HEC-RAS is provided by numerical solution of the continuity and momentum equations. The derivation of the governing equations is presented in [10] by Liggett. The most successful and accepted procedure for solving the one-dimensional unsteady flow equations is the four-point implicit scheme, also known as the box scheme. The software package can handle hydraulic structures like bridges, barrages, culverts, overflow weirs, floodgates, bottom stages, bottom sills, side overflows and gates, static reservoirs, pump stations, and water intakes. Example of application in a complex flood control project is given by [7]. Extended description of the software is given in [11].
2.4. Calibration and Verification of the Model
Calibration is feasible by adjusting the global parameters of the model—in most of the cases Manning’s coefficient of friction, eventually the loss coefficients of expansion/contraction [2, 8, 9]—providing successful reproduction of a well-documented past real flood event. Initial values of friction coefficient were estimated by digital aerial orthophotography and in situ surveys, while the final values—separately for the main channel and for the flood plain—were determined by calibration using historical flow data. Calibration is a straightforward procedure in cases of rather frequent floods. However, detailed data for extreme floods are seldom available, making them valued.
Flow measurements during flood recession in 1998 were carried out from bridges and boats. Comparison of the 1998 measurement with an earlier one in 1979 produced results shown in Table 2.
| Year | Main channel | Flood plain |
|---|---|---|
| 1979 | 0,0286 | 0,0309 |
| 1998 | 0,0285 | 0,0420 |
The data show almost unchanged characteristics in case of the main channel; however, flow conditions in the flood plain are significantly deteriorated during the corresponding two decades causing reduction in flow capacity up to 300 m3/s.
Successive measurements in 1998, 1999, 2000, and 2001 produced results shown in Figures 2 and 3 for the main bed and for the flood plain, respectively. The graphs reveal change in friction depending on the time of observation and on the actual water level. Variation of friction coefficient from 0.026 to 0.032 is observed in the main bed and from 0.025 to 0.048 in the flood plain. Increase in friction is due to the development of plant cover in the watercourse. Passing a flood wave often triggers decrease in friction as cutting a passage through an upsilted river section cleans the waterway.
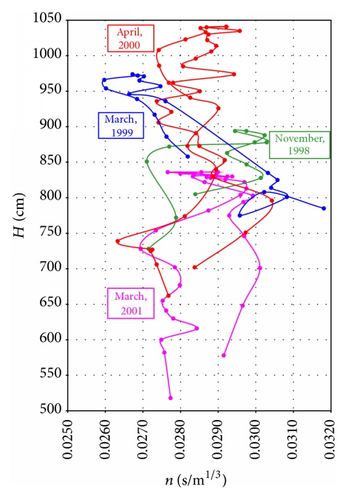
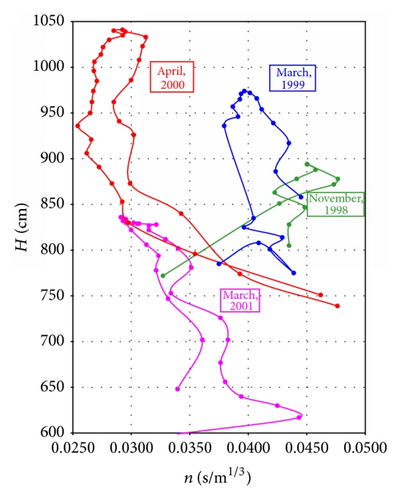
Calibration of the Tisza River model was achieved making use of almost 50 time series comprising of hourly detected water levels at standard measuring posts, and water level readings of dam keepers. In the calibration process default values, 0.3 and 0.1, have been adopted for the expansion and contraction coefficients, respectively. Manning’s coefficients for the main channel and for the flood plain were determined separately in each cross section. Figures 2 and 3 demonstrate an attempt to establish water level dependant Manning’s coefficient; however, it could be achieved for short river sections only.
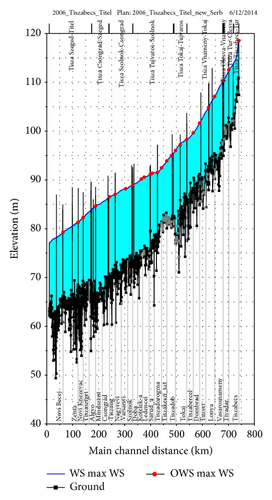
The blue line in Figure 4 represents the calculated peak water levels, while the red dots are the observed maximum water levels corresponding to the 2006 flood. The maximum difference between the calculated and observed water levels in the river section between Tiszabecs and Titel was 5 cm, which may be considered as very good agreement.
3. Application of the Model
Along the Hungarian section of the Tisza River, peak flow levels have overpassed the Base Flood Elevation during the 2000 flood, at some locations even by 80 cm. Flood protection by endless increasing in the height of the dikes is unfeasible. Alternative solution is reaching the goal by flood plain interventions and by employing detention storages along the river to reduce the peak water levels. Six detention ponds—the Szamos-Krasznakoz, Cigand, Hany-Tiszasuly, Nagykoru, Nagykunsag, and Tiszaroff—have been assigned for this purpose. The first case study is aimed at checking the expected efficiency of flood plain maintenance and activation of detention storages in flood defense.
The second case study investigates if the 1888 extreme flood applied to the current condition of the watercourse could pass nowadays without causing disaster.
At last, flood superposition scenarios have been studied in the third case study by the means of the calibrated model.
3.1. Flood Plain Maintenance, Detention Storages
- (a)
with flood plain maintenance, without detention ponds activated,
- (b)
with detention ponds activated, without flood plain maintenance,
- (c)
with flood plain maintenance, with detention ponds activated
| Year | TIVA-DAR | VASAROS-NAMENY | ZAHONY | DOMBRAD | TOKAJ | TISZA-FURED | TISZABO | SZOLNOK | CSONG-RAD | SZEGED |
|---|---|---|---|---|---|---|---|---|---|---|
| 1888 | 753 | 900 | 751 | 890 | 872 | 742 | 818 | 834 | 847 | |
| 1895 | 866 | 827 | 867 | 884 | ||||||
| 1912 | 790 | |||||||||
| 1919 | 919 | 882 | 929 | 916 | ||||||
| 1925 | ||||||||||
| 1932 | 750 | 921 | 894 | 923 | ||||||
| 1933 | ||||||||||
| 1947 | 848 | |||||||||
| 1967 | 765 | |||||||||
| 1970 | 865 | 912 | 773 | 935 | 909 | 935 | 961 | |||
| 1979 | 880 | 788 | 949 | |||||||
| 1998 | 964 | 923 | ||||||||
| 1999 | 894 | 835 | 1023 | 974 | ||||||
| 2000 | 928 | 881 | 1080 | 1041 | 994 | |||||
| 2001 | 1014 | 941 | 758 | |||||||
| 2006 | 1033 | 1009 | ||||||||
| Number of record-breaking peaks following the 1888 flood | 6 | 4 | 2 | 1 | 4 | 7 | 7 | 7 | 6 | 6 |
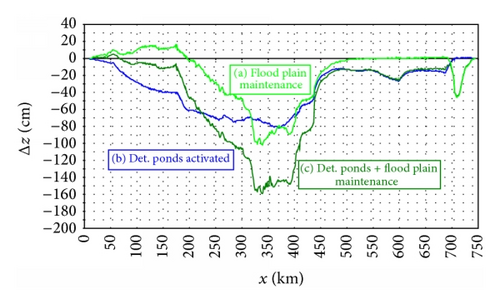
The results are shown in Figure 5, where Δz (cm) denotes water level difference due to a particular intervention, compared to the peak water levels expected for the current condition of the river bed; x is river station (km). The light green line represents case (a), the blue line corresponds to case (b), and the dark green line shows the joint effect of both interventions, case (c). The increase of peak water levels in the downstream section (x < 220 km) caused by flood plain maintenance is successfully compensated by the effect of detention ponds. With both measures applied, the maximum water levels could be reduced up to 160 cm. Further improvement in terms of maximum water levels might be achieved using more sophisticated techniques in activation of the eight gate-controlled detention ponds [14]. Calculation results are similar for the 2006 flood as well.
3.2. Application of the 1888 Flood to the Current Condition of the Watercourse
The 1888 flood was so severe that the corresponding maximum water level detected at Dombrad is still not overpassed. In addition, it has occurred in case of watercourse unrestricted by dikes. Even more, extreme water levels over 800 cm lasted more than 14 days in the Vasarosnameny region. For the sake of comparison it is interesting to note that none of the recent floods (1998, 2001) exhibited peak water levels lasting longer than 3.5 days.
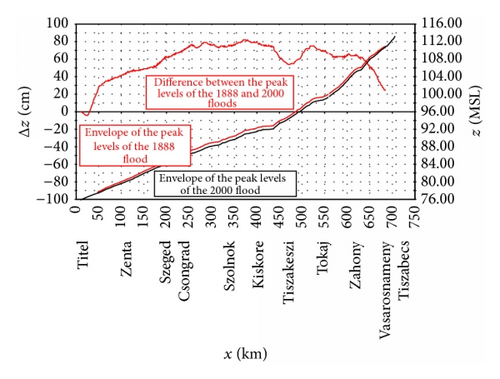
This simulation is meant to check if the 1888 flood could pass nowadays without causing trouble. The observed stage hydrograph of the 1888 flood has been set as upstream boundary condition. Stage hydrograph of the 2000 flood has been applied to the outlets of the tributaries and to the most downstream cross section of the Tisza River. The results of simulation compared to the consequences of the 2000 flood are shown in Figure 6. It clearly demonstrates that if the 1888 flood happened nowadays, it would have caused up to 80 cm higher peak levels than the 2000 flood did. Between Tiszalok and Tiszaug peak water levels would over pass the BFE up to 180 cm and they would last over 25 days! It is interesting to notice that, with flood plain maintenance carried out and all planned detention storages accomplished, most of the Hungarian section of the Tisza River could pass the 1888 extreme historical flood.
4. Superposition of Floods
- (i)
intensity and duration of floods corresponding to each tributary,
- (ii)
timing of flood waves of tributaries in relation to the flood wave of the Tisza River.
- (a)
Orange curve in Figure 7: the 2000 year flood is applied to the Danube, the 2006 flood to the Tisza, and the 1970 flood to the Maros.
- (b)
Purple curve in Figure 7: The 2006 year flood is applied to the Danube and to the Tisza, and the 1970 flood to the Maros.
- (c)
Blue curve in Figure 7: The 2006 year flood is applied to the Danube, the 2000 flood to the Tisza, and the 2006 flow hydrograph to the Maros.
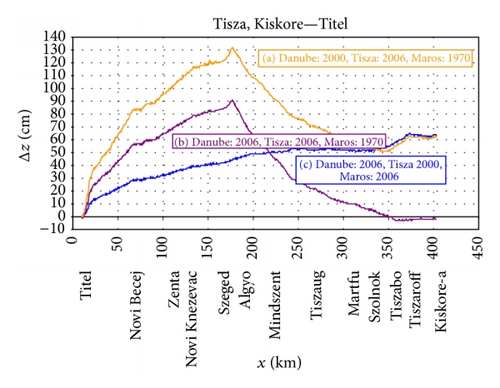
Since the 2006 hydrograph of the Maros was not excessive, peaking at Szeged did not happen, case (c). As the 1970 flood of the Maros was extreme if it happened again, it would have caused excessive peak water levels, at Szeged, up to 130 cm higher than the reference peak level produced by the 2006 flood, cases (a) and (b).
This example highlights the need for stochastic approach in flood analysis in order to get insight into the probability of extreme flood scenarios. In combination with a well calibrated, reliable model, powerful tool in search for the most effective solutions in flood defense could be established.
5. Conclusions
Flood routing is a multidisciplinary complex task. In addition, conditions in a specific catchment are continuously changing partly due to anthropological influences, partly due to natural processes. Numerical models seem to be the only tool which can tackle the problem. If they are to be used for simulation of extreme floods, their calibration with well documented, historical flood data is inevitable. This approach ensures that all particular conditions specific to extreme floods (stochastic character of the event, significant flood plain flow, and inundation storage) reveal themselves.
Modeling different scenarios is currently the most suitable approach to investigate the effects of different flood control approaches; in this paper the influence of flood plain maintenance and exploitation of detention storages have been investigated with good results. Possible superposition of different flood-augmenting influences requires probabilistic approach to flood analysis. Therefore, numerical models combined with statistical hydrology seem to be the most suitable tool for flood prognosis.
The Base Flood Elevation corresponding to the design flood of a given recurrence interval may not be once and forever established, since the bathymetry of the reaches is continuously changing due to the erosion/deposition processes. In addition, seasonal variations are caused by cyclical changes in vegetation. Furthermore, hydrological events are of stochastic character. For that, a design flood of a chosen probability may come about in huge number of scenarios, each producing particular BFE at the location of interest. Therefore, BFE ensuring identical safety over the whole catchment is achievable by establishing the envelope of maximum BFEs coming from different flood scenarios. The envelope of BFEs is attainable by computer aided simulations only, combined with statistical hydrology or by exploiting data of extreme historical floods.
Conflict of Interests
The authors declare that there is no conflict of interests regarding the publication of this paper.
Acknowledgments
This work has been carried out using data provided by the Directorate for Water Management of Lower Tisza District, Szolnok, and by the Directorate for Water Management of Middle Tisza District, Szeged.


