An Empirical Method of Estimating Soil Thermal Inertia
Abstract
A method of estimating soil thermal inertia (STI), which uses midday soil heat flux (Gm) and diurnal surface temperature amplitude as the inputs, is presented in the paper. Gm is achieved from an empirical relationship between net radiation (Rn) and soil heat flux (G). To validate the STI method, a method proposed by Verhoef, which requires STI and a Fourier series analysis on surface temperature, is used to estimate diurnal G. By comparing diurnal G estimates and diurnal G measurements, the STI method is evaluated indirectly. The results show that the diurnal curve of G estimates can coincide with that of G measurements for bare soil, with the correlation coefficient (R2) of 0.64, bias of 10.1 W·m−2, and root mean squared errors (RMSE) of 40.9 W·m−2. For the vegetated surface, R2 is 0.56, bias is −11.9 W·m−2, and RMSE is 49.2 W·m−2. The large uncertainty in the estimation of Gm resulting from the wider variation of the empirical relationship between Rn and G and the difference between mixed surface temperature and soil surface temperature may be the two primary factors for the larger deviation of the diurnal shape and the magnitude between G estimates and G measurements for the vegetated surface.
1. Introduction
So far, developing STI estimation methods is still an ongoing progress. Many methods have been proposed. Xue and Cracknell [15] proposed a real thermal inertia analytical model by taking into consideration the phase information of surface temperature changes and ΔT. Murray and Verhoef [16] proposed a method to calculate STI based upon the normalized theory of soil thermal conductivity. On the basis of this method, Lu et al. [17] developed this method further by improving the Kersten function and the estimation of STI at saturation. Ma et al. [18] derived a STI method based on the heat conduction equation and an approximated energy budget equation. However, the above methods require the information on soil properties, which limit their applications of remote sensing methods to a certain degree. Using multitemporal land surface temperatures retrieved from satellite data, some other STI estimation methods were presented. Sobrino and El Kharraz [19] presented a method which uses satellite data at four moments (2:30, 7:30, 14:30, and 20:30 in local time). Cai [20] modified Sobrino’s method for MODIS (Moderate Resolution Imaging Spectroradiometer) data. Nearing et al. [21] developed a method with two daily measurements of surface temperature. The limitation of these methods is that they are restricted to the availability of satellite overpasses or field measured data [22]. Geostationary satellite data may provide a good alternative input for these methods.
According to the soil conductive heat transfer, soil heat flux is the real driving force of T [23, 24]. However, because G is difficult to acquire accurately at a regional scale by remote sensing method, G is usually replaced by S or Rn when estimating STI, as used in (3) and (4). When the alternative driving energy is close to G, the estimated STI would be close to the real STI [25]. Otherwise, the estimated STI would deviate greatly.
The objective of this paper is to present a STI estimation method which uses midday G (Gm) and ΔT as the inputs. Here, Gm is acquired from the empirical relationship between G and Rn. Another purpose of this paper is to investigate whether the empirical function about G, respectively, for bare soil and for vegetated surfaces can be used to estimate soil thermal inertia in combination with ΔT. Due to the large uncertainties in the estimation of STI for vegetated surface, STI method is limited in a variety of applications, such as soil moisture retrieval. If the method proposed in the paper is applicable, it will provide a feasible way to estimate STI for vegetated surface and thereby expand the applications of STI. The major difference between the method proposed in this paper and the previous methods is that the combination of Gm is used to estimate STI, which could be better than Rn or solar radiation according to the soil conductive heat transfer. The relationship between G and Rn is a simple method for acquiring Gm. For an area with relatively uniform soil properties and meteorological conditions (namely, there is a reliable relationship between G and Rn), STI could be estimated conveniently using the proposed method.
In the paper, a method of estimating soil thermal inertia, which uses Gm and ΔT as the inputs, is described in Section 2. Study site, data description, and the evaluation method are also illustrated in Section 2. Section 3 presents the results. Conclusions are given in Section 4.
2. Materials and Methods
2.1. Site Description
Measurement data used in the study are from the Yucheng (YC) Agro-Ecosystem Station, Chinese Academy of Sciences (CAS). The station is located in an irrigated agricultural field (36.8570N, 116.8360E) in the North China Plain characterized by a semihumid and monsoon climate. Mean annual precipitation, temperature, and global solar radiation at the station are 528 mm, 13.1°C, and 5225 MJ m−2, respectively. The dominant soil type is sandy loam with an average bulk density of 1.43 (g cm−3), soil wilting point of 0.07 (v/v), and saturated soil moisture of 0.462 (v/v). The groundwater table varies from 1.5 to 3.5 m with an average of 2.5 m. This site is a typical representative of the agricultural area of winter wheat and summer maize production in the North China Plain. According to the traditional tillage practice, winter wheat is sown in middle October and harvested in early or mid-June of the next year, and summer maize is planted in mid- to late June and harvested at the end of September. It is almost a bare soil surface in the nongrowing season (Jan, Feb, mid- and late Oct, Nov, and Dec). In the growing season, winter wheat and summer maize are the dominant vegetation types, respectively, in the periods from March to June and from July to September.
2.2. Soil Thermal Inertia Method
In the study, Gm is determined by the empirical function between Rn and G, like (5) and (6). The relationship between Rn and G is established on the basis of in situ measurements of Rn and G in 2003 at YC Station. Under the condition that there is only a small annual variation of surface conditions at YC Station in a few years, the relationship between Rn and G can be assumed to be almost constant; namely, the empirical coefficients of a, b, and c in (5) and (6) are constant. In this case, Gm in other years can be estimated on the basis of the established function of Rn and G. With the midday Rn (Rnm) as the input, Gm of 2004 was estimated and used to estimate STI of 2004 in the study. Note that Rnm, ΔT, and Δt all can be estimated from remotely sensed data, for example, MODIS. Therefore, as long as the empirical function between Rn and G is determined, STI can be estimated by (7).
2.3. Diurnal Soil Heat Flux Estimation
Because there are no data of in situ soil thermal inertia measurements, an indirect validation for the STI method was used. Firstly, diurnal G in 2004 at YC Station was estimated based on the method proposed by Verhoef [9]. By comparing diurnal G estimates with G measurements, the STI method was then evaluated indirectly.
With (8) and (10), diurnal G in 2004 is estimated based on the measurements of T and STI estimated from (7). Diurnal G measurements in 2004 are then compared with the measurements of G of 2004 at YC Station.
2.4. Data Description
Data in the rainy days were not considered in the study due to the large variation of soil moisture, which would have great effect on the determination of the empirical coefficients between Rn and G. Rainfall was monitored with a rain gauge (52203, RM Young, Inc.).
Three steps were used to perform the data quality control: (1) checking for null values for G, Ts, and Rn data for the same day, which is mainly caused by the broken electricity problem (if one null value was found, the data for the day were eliminated); (2) eliminating data on rainy and snowy days based on the rain and snow observations; (3) checking whether there were diurnal variations for G, Ts, and Rn for the same day. Only data with obvious diurnal variations for all the three parameters were kept. After this screening, 96 days and 128 days of observations for bare soil and vegetated surfaces, respectively, in 2003 were used to establish the regression function between Rn and G. In 2004, 100 days and 115 days of observations, respectively, for bare soil and for vegetated surface were used to validate the method.
The data of VI at YC Station are from the MODIS 16-day vegetation indices product (MOD13Q1) acquired from the Land Process Distributed Active Archive Center (LPDAAC) (https://lpdaac.usgs.gov/). Its spatial resolution is 250 m. A linear interpolation method is used to retrieve the Normalized Difference Vegetation Index (NDVI) of each day.
2.5. The Determination of the Coefficients of a, b, and c
In the study, the measurements of Rn and G in 2003 at YC Station in nongrowing season (Jan, Feb, mid- and late Oct, Nov, and Dec) were used to determine the empirical coefficient of c in (5), which is realized in two steps: First, c for each day is determined by the linear regression between the measurements of Rn and G, which is the slope of the regression. Then, the average of c is calculated by averaging c of each day and is used to calculate G of bare soil in 2004.
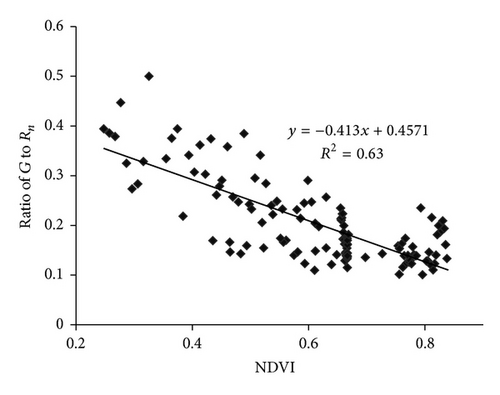
A regression function between Normalized Difference Vegetation Index (NDVI) and the ratio of G and Rn was established for the growing season using the field measurements of G and Rn in 2003, from which a and b in (6) are determined. Figure 1(a) shows the scatter plot of Rn and G in the nongrowing season. Figure 1(b) shows the scatter plot of NDVI and the ratio of G and Rn in the growing season.

3. Results and Discussions
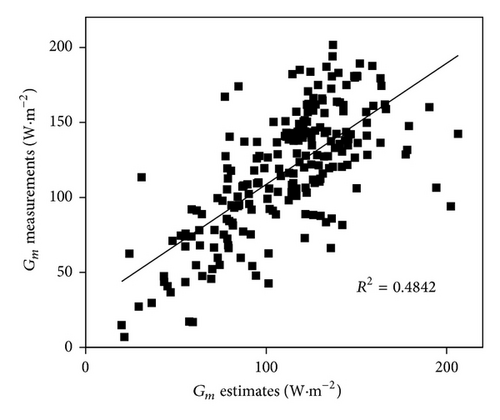
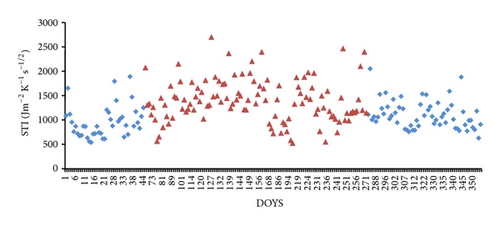
Figure 2 shows the scatter plot between Gm estimates calculated from (14) and Gm measurements at YC Station in 2004. It shows that their values are close to 1 : 1 line as a whole, with a bias of −6.5 W·m−2 and a RMSE (root mean squared error) of 30.7 W·m−2. Integrating Gm estimates and ΔT determined from T measurements into (7), STI was estimated. Figure 3 shows the annual variations of STI in 2004. It can be seen that STI ranges from 500 to 2500 (J m−2 K−1 s−1/2) and higher STI was found in the growing season, with average STI of 1061.2 (J m−2 K−1 s−1/2) in the nongrowing season and of 1370.6 (J m−2 K−1 s−1/2) in the growing season. Rainfall and frequent irrigation may be the primary reason for the higher STI in the growing season because high soil water content can usually produce high soil thermal inertia [17].
Integrating STI obtained above into (8) and on the basis of the Fourier series analysis on the surface temperature, diurnal G in 2004 was estimated. The comparisons between diurnal G estimates and G measurements during the growing season and during the nongrowing season are given in Figure 4. The scatter plots are given in Figure 5.


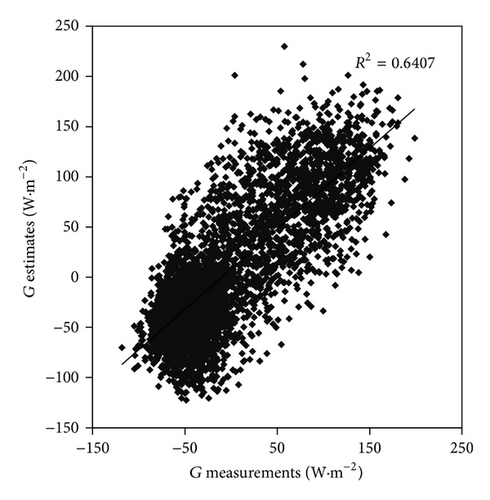
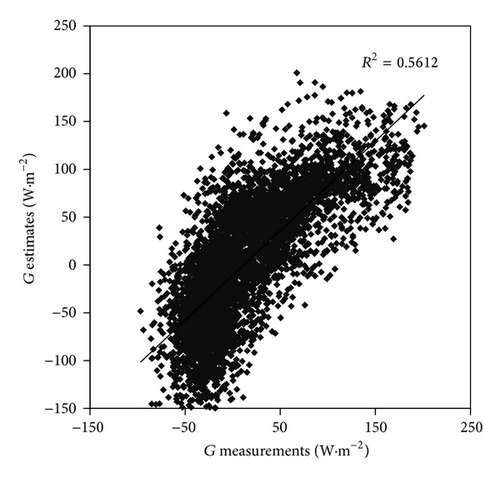
As a whole, G estimates can fit with G measurements, with correlation coefficient (R2) of 0.64 and 0.56 for the nongrowing season and the growing season, respectively. The biases and the RMSE for the nongrowing season and for the growing season are 10.1 W·m−2, 40.9 W·m−2 and −11.9 W·m−2, 49.2 W·m−2, respectively. G estimates for the bare soil are slightly better than that for the vegetated surface. The biases show that G is slightly overestimated in the nongrowing season and is underestimated in the growing season. It was also seen from Figure 4 that the discrepancies between G estimates and G measurements in the nighttime are larger than that in the daytime, which suggests that Gm estimates used in (8) deviate more greatly from the nighttime soil heat flux in comparison with the daytime soil heat flux.
As mentioned in Section 2.3, the diurnal variation of T determines the shape of the diurnal curve of G estimates by determining the summation of harmonic terms in (8) and STI determines the magnitude. Therefore, the larger errors in the STI estimates for the vegetated surface may be the main reason for the larger errors in G estimates. As described in Section 2, Gm for vegetated surface is obtained from the empirical function between NDVI and the ratio of G and Rn (see (14)). Vegetation conditions, irrigation activity, radiation conditions, and soil properties all influence the relationship between NDVI and the ratio of G and Rn. Therefore, there are wide variations in the empirical coefficients of the function, which leads to the uncertainties in the Gm estimation for the vegetated surface and thereby produces the errors in the STI estimation. Comparatively, the relationship between G and Rn for bare soil is relatively stable because soil properties play a dominant role in their relationship, which is relatively invariable in the same place. It seldom rains at YC Station and there is no irrigation activity in the nongrowing season, so soil moisture is relatively stable, which reduces the effects of the variation of soil moisture on the relationship between G and Rn.
To see the comparisons of G estimates and G measurements clearly, Figure 6 displays the 5-day results.
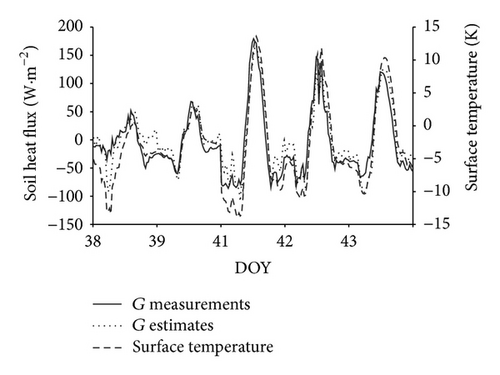
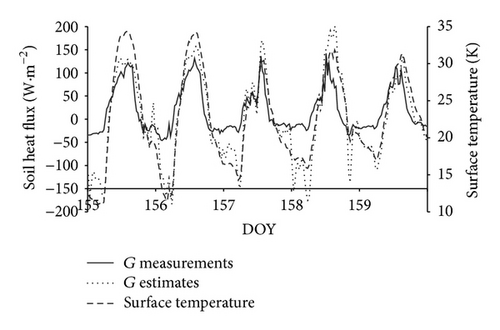
It is obvious that the diurnal curve of G estimates coincides with the diurnal shape of T, which illustrates that the diurnal variation of T determines the shape of the diurnal curve of G estimates by determining the summation of harmonic terms in (8). Compared with the in situ G, G estimates have a similar diurnal shape in the nongrowing season, while in the growing season, the fitness of the diurnal shape is worse. As mentioned above, the errors in the estimation of Gm are a primary reason for the discrepancy between G estimates and G measurements. For the vegetated surface, there is another reason. Surface temperature used to calculate diurnal G at vegetated surface is a mixed temperature which is composed of soil surface temperature and canopy temperature. However, the fact is that G only has relationship with soil temperature. For vegetated surface, soil temperature for soils under vegetation is usually not available from the conventional observation and remotely sensed data. Therefore, the difference between mixed surface temperature and soil temperature would produce the difference in the diurnal shape of G estimates and G measurements in the growing season. An underestimation of G was found during nighttime periods (G estimates are lower than G measurements at nighttime). This underestimation arises from differences between canopy and soil temperatures, where temperatures at the top of the canopy fall below those of the soil due to the effect of the sheltering of the soil surface by the canopy coverage. In the study, canopy temperature calculated from the radiative measurements by a four-component radiometer was used to compute the summation of harmonic terms in (10). Thus, the influence of canopy temperature on the radiation measurements induces a lower estimate of the summation of harmonic terms at nighttime. The same phenomenon was found in the study of Murray and Verhoef [9]. They attributed this to the differences between canopy and soil temperatures.
The above results of the comparison between diurnal G and in situ G illustrate that (8) can be used to estimate soil thermal inertia correctly. However, there are larger uncertainties in the estimation of STI at vegetated surfaces than that at bare soil due to the larger uncertainties in the estimation of Gm caused by the wider variation of the relationship between Rn and G. Using mixed surface temperature to replace soil temperature is another uncertainty in the estimation of STI for the vegetated surface.
The method can be applied to map STI with remotely sensed data. As is known, Rn can be retrieved from remotely sensed albedo, surface temperature, and some auxiliary meteorological data, such as solar radiation and air temperature. On the basis of the regression function between Rn and G in the study area, Gm can be calculated according to Rn. ΔT in (7) can also be obtained from satellite data, such as MODIS. Therefore, STI at a regional scale can be estimated. By using the regression function between Rn and G for vegetated surfaces, STI at vegetated surface can be retrieved, which provide an opportunity to overcome the difficulty in acquiring STI at vegetated surface. The method is simpler than the physically based STI methods that usually require soil properties. It is difficult to acquire soil properties by remote sensing; as a result, STI at a regional scale usually is not dependent on the physically based STI methods.
The limitation of the method presented in the paper is that the estimation of Gm depends on the empirical relationship between Rn and G. Actually, the relationship between Rn and G is not constant. It varies with soil properties, meteorological condition, and vegetation condition. Therefore, if the surface condition changes, errors will be produced in the estimation of Gm and thereby in the estimation of STI. In the application of the method, it is recommended that the regression function between Rn and G for the study area is established first, which would make Gm estimation more accurate and thereby make the STI estimation more reliable. The investigation of the accuracy of the G estimation method at a regional scale will be one of the future researches, which is expected to reduce the limitation of the empirical method of the determination of Gm. Applying the method to retrieve soil water content for both bare soil surface and vegetated surface is another implication of this research.
4. Conclusions
On the basis of the fact that soil thermal inertia (STI) can be estimated by the combinations of the driving force of the variation of surface temperature and the diurnal amplitude of surface temperature, a STI method, using midday soil heat flux (Gm) and ΔT as the inputs, is presented in the paper. Gm is achieved from an empirical method.
In the study, the measurements of net radiation and G in 2003 at the Yucheng (YC) Agro-Ecosystem Station, Chinese Academy of Sciences, were used to establish the empirical functions between Rn and G, respectively, for bare soil (nongrowing season) and for vegetated surface (growing season). According to the empirical functions, Gm of 2004 at YC Station is estimated and thereby STI of 2004 is estimated.
To validate the STI method, diurnal G of 2004 at YC Station is estimated with the method proposed by Verhoef [25], which requires STI and a Fourier series analysis on surface temperature. The comparisons of diurnal G estimates and the diurnal G measurements show that (1) G estimates agree well with G measurements, with correlation coefficient (R2) of 0.64 and 0.56 for the nongrowing season and the growing season, respectively. The biases and the root mean squared errors (RMSE) for the nongrowing season and for the growing season are 10.1 W·m−2, 40.9 W·m−2 and −11.9 W·m−2, 49.2 W·m−2, respectively. (2) The diurnal curve of G estimates coincides well with the diurnal curve of G measurements for bare soil. For the vegetated surface, the consistence between them is poorer than that for bare soil. The large uncertainties in the estimation of Gm resulting from the wider variation of the empirical relationship between Rn and G and the difference between mixed surface temperature and soil temperature may be the two primary reasons for the larger discrepancies in the diurnal shape and in the magnitude of G estimates and G measurements in the growing season. (3) The performance of G estimates in the daytime is better than that in the nighttime.
The comparison results between G estimates and in situ G illustrated that the STI method presented in the paper can be used to estimate soil thermal inertia reliably and the method can estimate STI more accurately for bare soil than for vegetated surface.
Conflict of Interests
The authors declare that there is no conflict of interests regarding the publication of this paper.
Acknowledgment
This work was supported by the National Natural Science Foundation of China (41271380, 41171286).


