Statistical and Physical Descriptions of Raindrop Size Distributions in Equatorial Malaysia from Disdrometer Observations
Abstract
This work investigates the physical characteristics of raindrop size distribution (DSD) in an equatorial heavy rain region based on three years of disdrometer observations carried out at Universiti Teknologi Malaysia’s (UTM’s) campus in Kuala Lumpur, Malaysia. The natural characteristics of DSD are deduced, and the statistical results are found to be in accordance with the findings obtained from others disdrometer measurements. Moreover, the parameters of the Gamma distribution and the normalized Gamma model are also derived by means of method of moment (MoM) and maximum likelihood estimation (MLE). Their performances are subsequently validated using the rain rate estimation accuracy: the normalized Gamma model with the MLE-generated shape parameter µ was found to provide better accuracy in terms of long-term rainfall rate statistics, which reflects the peculiarities of the local climatology in this heavy rain region. These results not only offer a better understanding of the microphysical nature of precipitation in this heavy rain region but also provide essential information that may be useful for the scientific community regarding remote sensing and radio propagation.
1. Introduction
Raindrop size distribution (DSD) has received much attention over the past few decades due to its shape of distribution, which reflects the fundamental microphysics of rain [1, 2]. In fact, the knowledge of DSD not only plays an important role in the atmospheric science/meteorology communities [3], which describe the processes that transform condensed water into rain, but is also important for the remote sensing of precipitation and radio-link propagation performance. Rainfall measurement via ground-based weather radar or space-borne satellite observation requires the characteristics of the raindrop spectra for the development of rainfall retrieval algorithms [4, 5], while in satellite communication links, DSD is the dominant parameter that causes attenuation, which leads to significant performance degradation for frequencies above 10 GHz [6, 7].
Nevertheless, based on the evidence from several DSD measurements carried out in various locations across different regions, it is generally accepted that DSD is best modeled via a Gamma distribution, as pointed out by Ulbrich [3]. Since then, extensive studies have been focused on identifying the best matching moments, such as 2nd, 3rd, 4th, (MM234), 4th, 5th, and 6th (MM456) or 3rd, 4th, and 6th (MM346), with which one can infer the Gamma distribution parameters. Due to the insensitivity of impact disdrometer in detecting smaller drop, most of the authors chose to employ central moments. Tokay and Short [10] and Kozu and Nakamura [11] used MM346 to model the Gamma DSD, while Timothy et al. [14] used the same moments to model lognormal DSD in the Singapore region. Other authors tend to use the MM234 [15] and MM246 [4] moments. Caracciolo et al. [16] prefer to work with higher-order moments, such as MM456, with the aim of reducing the dependency on small drops during heavy rain events. However, Smith and Kliche [17] highlighted the possibility of a strong bias with the use of higher-order moments. As a matter of fact, any of these moments can be used for DSD parameterization, and the choice usually depends on the desired rainfall parameter. For instance, higher-order moments should be used for the estimation of the rain rate R and the radar reflectivity factor Z because R is proportional to the 3.67th moment, whereas Z is the 6th moment of the drop spectrum. In addition, there are also some efforts focused on empirically relating any two of the Gamma parameters, with the aim of reducing the three-parameter function to a two-parameter function [18, 19].
In the past few years, the radar meteorology community and remote sensing researchers have tended to represent the DSD via a normalized model due to its clear physical representation of DSD parameters with respect to the Gamma model. The normalized concept was first introduced by Willis [20] and further adapted by Testud et al. and Illingworth and Blackman [21, 22] for the precipitation radar applications. As mentioned previously, the three Gamma parameters (No, μ, and Λ), are physically meaningless [21], and the concepts of the normalized model overcome such drawbacks by removing the dependence of No-Λ and representing the DSD parameters with physically meaningful parameters, such as the total liquid water content and the mean drop size.
One relevant issue for DSD modeling is the variability of natural DSD, which depends on the interaction between kinematic, microphysical, and dynamic processes [3, 23]. This intrinsic variability may even be noted across different climatologically conditions and geographical areas [24]. For this reason, many field studies were carried out at various locations throughout the world to observe the peculiar characteristics of DSD via ground or aircraft measurement. These observations cover a variety of climatic regions, from mid-latitude [25, 26], maritime, continental [27], and tropical [10, 28–32] to equatorial environments [33, 34]. In fact, findings from these studies are crucial for the modeling of DSD and the retrieval algorithms for remote sensing at different geographical areas. This is even more critical in the equatorial areas, where the precipitation mechanism exhibits localized features rather than regional features [35]. Indeed, additional findings or studies with respect to the natural DSD characteristics in equatorial areas should lead to a better understanding of DSD in these particular areas.
With the aim of improving the understanding of DSD in this extremely heavy rain area, this work presents the natural characteristics of DSD in equatorial Malaysia by exploiting three years of long-term measurements collected via disdrometer in Kuala Lumpur, Malaysia. In addition, the driving parameters of the Gamma and normalized Gamma models are also inferred from this dataset, and their statistical features are duly discussed, together with their empirical relationship. Eventually, the effectiveness of both models is evaluated through rainfall estimation.
The remainder of the paper is organized as follows. Section 2 describes the disdrometer measurement details. Afterwards, the unique characteristics of equatorial precipitation are briefly explained in Section 3. The core of the paper lies in Section 4, where the features of natural DSD in this area are first presented. In the same section, the statistical results of the DSD parameters from the Gamma and normalized Gamma models are demonstrated. The relationship between these parameters is subsequently derived from disdrometer observations and the performance of the Gamma and normalized Gamma models in estimating the rain rate for equatorial Malaysia is evaluated. Finally, a summary of the results and conclusions are given in Section 5.
2. Measurement Details
A Joss-Waldvogel disdrometer (JWD, RD-69) was installed on a roof of a 15 m building (at an altitude of 35 m above mean sea level) located on the Universiti Teknologi Malaysia (UTM) campus in Kuala Lumpur, Malaysia, situated at 3.08° N and 101.42° E. The measurements were taken from January 1992 to December 1994; the disdrometer recorded about 100,512 rainy minutes with a 1-minute integration time, which represented 30,960 mm of rainfall over 781 rain events. Each event was identified using a clear sky duration of at least 60 minutes between one event and the following one. The measurement system of the RD-69 is illustrated in Figure 1.
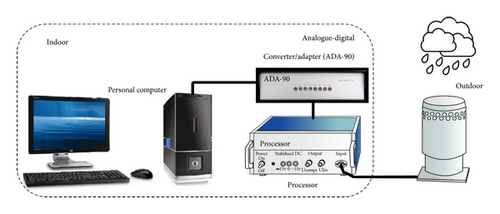
The RD-69 disdrometer measurement system mainly consists of three units, namely, the disdrometer (transducer), which is located outdoors and is connected to the processor and the analog-to-digital converter (ADA-90), which are indoors. This transducer of the disdrometer transforms the vertical momentum of a mechanical impulse into an electrical pulse whose amplitude is a function of the drop diameter. The processor unit then filters out the acoustic noise affecting the transducer and processes the electrical signal from the raindrops. The ADA-90 accepts the drop pulses from the transducer and converts them into a digital signal.
In order to obtain appreciable and reliable data for this work, each minute of raindrop spectra has been carefully processed, and to avoid sampling problems, each one-minute sample containing fewer than 10 drops or having a rain rate less than 0.1 mm/h has been excluded and disregarded as noise [10]. It is worth mentioning that these raindrop spectra are analyzed without considering their seasonal or diurnal variations, with the aim of preserving the overall characteristics of the raindrop spectra in this region and achieving reliable statistical results. In addition, the ratio between the number of minutes corresponding to the recorded rainfall rate and the total number of minutes in the observation period has been calculated as an index of data availability, which is referred to as recorded-to-total time, as shown in Table 1 on the yearly basis. For the complete three-year period, a recorded-to-time ratio of 99.4% has been achieved.
| Time period | Recorded-to-time ratio [%] |
|---|---|
| 1992 | 99.6 |
| 1993 | 99.3 |
| 1994 | 99.3 |
| 1992–1994 | 99.4 |
In addition, a well-known issue of the JWD RD-69 disdrometer in measuring the DSD is the reduced sensitivity at drops smaller than 1 mm under heavy rain conditions, due to the so-called “disdrometer dead time.” In the present study, dead time correction has been applied based on the empirical algorithm of an in-house software package proposed by Sheppard and Joe [38]. The algorithm aims to improve the accuracy by up to 10%. Moreover, environmental sources of error, such as acoustic noise and wind turbulence, are minimized via installing the instrument on the rooftop of a low building.
Based on the data processing and quality assessment procedures underlined above, the DSD database is now believed to be reliable and fully representative of real raindrop spectra in this region, making it useful for the characterization and modeling of the DSD.
3. Rainfall Characteristics in the Peninsula Malaysia
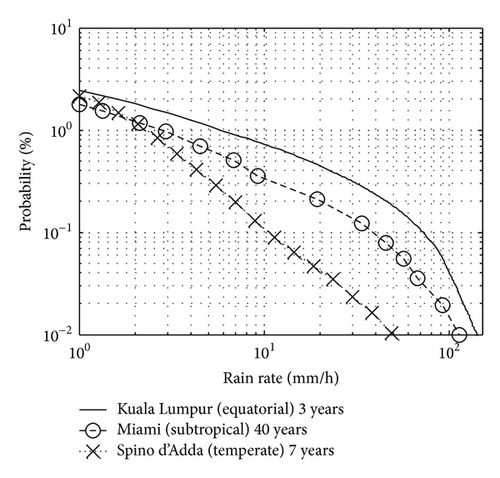
As previously mentioned, geographical area is one of the factors affecting the intrinsic variability of the DSD. This phenomenon is particularly significant in equatorial areas where the characteristics features of the DSD are influenced by the peculiarities of the local climatology and topography. Malaysia has such an equatorial climate; it is characterized by high humidity, a uniform temperature, and lavish rainfall as compared to temperate and subtropical regions, as evidenced by Figure 2. This figure compares the complementary cumulative distribution functions (CCDFs) of the rain rates from three climatological regions, namely, the equatorial (Kuala Lumpur), subtropical (Miami), and temperate regions (Milan, Italy). The figure depicts an extremely high rainfall amount for the equatorial region as compared to the other two regions.
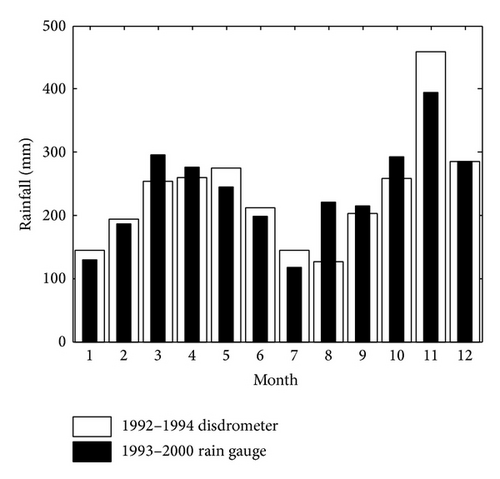
Even though there is no alternation of summer and winter, as in temperate regions, due to the uniform temperature throughout the year, the climate of Peninsula Malaysia has a seasonal rhythm caused by changes in airstream direction and speed across Peninsula Malaysia. The year can generally be categorized into two monsoonal and two transitional seasons: the north-east monsoon (December to March), the south-west monsoon (June to September), and two inter-monsoon seasons (April to May and October to November). Such features are clearly illustrated in Figure 3. The comparison of mean monthly rainfall accumulation between the long-term rain gauge measurements of the Malaysian Meteorological Department and that from the disdrometer database used in this work confirmed the seasonal pattern in this location.
Nevertheless, as far as the DSD is concerned, seasonal variations in this particular area are beyond the scope of this work because the main objective is to focus on the general features of the DSD. However, detailed work related to this topic can be found in [29].
4. Results and Discussion
This section presents the natural DSD characteristics in equatorial Kuala Lumpur, followed by the statistical properties of the Gamma and normalized Gamma model parameterizations in order to identify the most adequate distributions that can properly model the DSD’s main features in this particular region. Finally, the validity of those models has been assessed by means of a comparison of rain rates that were calculated directly from the disdrometer data and the models.
4.1. Disdrometer Observation
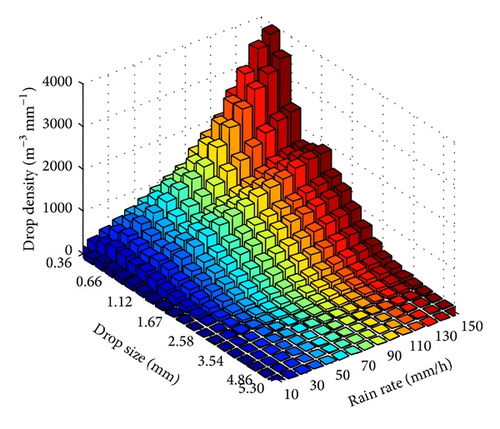
The summary of the average measured drop counts at different bins for rain rates ranging from 0.1 to 200 mm/h is listed, along with the thresholds for the drop size bins, in Table 2. As can be observed in this table, the rain drops tend to increase in number from the lower-drop-size bins to the higher-drop-size bins, which corresponds to the larger diameter of rain drops as the rain rate increases, as evidenced by Figure 4. In fact, the same characteristic has also been observed in results reported in Singapore [7]. Moreover, Ulbrich [3] also pointed out the rarity of small rain drops in tropical rainfall, which is not caused solely by the dead time problem of JWD or the insufficient natural correction for acoustic noise, as highlighted by Zawadzki and De Agostinho Antonio [32].
| Bin i | Lower bound Dil [mm] | Upper bound Diu [mm] | Mean value Di [mm] | Rain rate classification interval [mm/h] | ||||||||
|---|---|---|---|---|---|---|---|---|---|---|---|---|
| 0.1–1.0 | 1.0–5.0 | 5.0–10.0 | 10.0–20.0 | 20.0–40.0 | 40.0–60.0 | 60.0–80.0 | 80.0–100.0 | 100.0–200.0 | ||||
| Average rain rate [mm/h] (number of samples) | ||||||||||||
0.40 (25484) |
2.44 (19046) |
7.06 (5606) |
14.31 (4365) |
28.33 (3276) |
49.19 (1474) |
69.26 (890) |
89.87 (632) |
118.13 (600) |
||||
| 1 | 0.31 | 0.41 | 0.36 | 11 | 21 | 26 | 18 | 5 | ||||
| 2 | 0.41 | 0.51 | 0.46 | 17 | 30 | 43 | 41 | 20 | 4 | 1 | ||
| 3 | 0.51 | 0.60 | 0.55 | 17 | 29 | 42 | 51 | 43 | 16 | 8 | 2 | |
| 4 | 0.60 | 0.72 | 0.66 | 17 | 34 | 48 | 61 | 69 | 41 | 24 | 11 | 5 |
| 5 | 0.72 | 0.83 | 0.77 | 12 | 28 | 38 | 48 | 62 | 54 | 42 | 26 | 15 |
| 6 | 0.83 | 1.00 | 0.91 | 13 | 42 | 62 | 76 | 106 | 133 | 145 | 151 | 114 |
| 7 | 1.00 | 1.23 | 1.12 | 9 | 45 | 82 | 108 | 148 | 196 | 257 | 337 | 350 |
| 8 | 1.23 | 1.43 | 1.33 | 3 | 23 | 56 | 80 | 111 | 146 | 196 | 263 | 304 |
| 9 | 1.43 | 1.58 | 1.51 | 1 | 12 | 34 | 53 | 77 | 102 | 139 | 189 | 231 |
| 10 | 1.58 | 1.75 | 1.67 | 1 | 8 | 25 | 45 | 68 | 94 | 128 | 177 | 217 |
| 11 | 1.75 | 2.08 | 1.91 | 1 | 8 | 28 | 59 | 96 | 142 | 196 | 256 | 332 |
| 12 | 2.08 | 2.44 | 2.26 | 3 | 13 | 30 | 59 | 99 | 139 | 181 | 239 | |
| 13 | 2.44 | 2.73 | 2.58 | 4 | 11 | 26 | 49 | 69 | 90 | 126 | ||
| 14 | 2.73 | 3.01 | 2.87 | 2 | 6 | 15 | 31 | 46 | 57 | 83 | ||
| 15 | 3.01 | 3.39 | 3.20 | 4 | 11 | 25 | 37 | 48 | 70 | |||
| 16 | 3.39 | 3.70 | 3.54 | 2 | 5 | 12 | 18 | 26 | 35 | |||
| 17 | 3.70 | 4.13 | 3.92 | 1 | 4 | 9 | 13 | 17 | 24 | |||
| 18 | 4.13 | 4.57 | 4.35 | 2 | 4 | 6 | 7 | 9 | ||||
| 19 | 4.57 | 5.15 | 4.86 | 1 | 2 | 3 | 3 | 3 | ||||
| 20 | >5.15 | 5.30 | 1 | 1 | 1 | 1 | ||||||
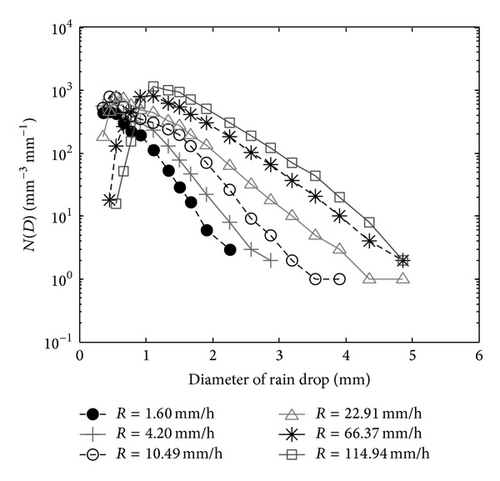
Figure 5 further illustrates an example of the average drop size density distribution as a function of the average rain rate.
4.2. DSD Models and the Statistical Properties of Their Parameters
The DSD model implies choosing a DSD profile that describes the distribution of drop size and thus rain intensity in a simple way. In this respect, the most widely used models are the Gamma model and the normalized Gamma model. In fact, a key feature of a DSD model is that it should be able to reproduce the statistical properties of local DSD parameters in order to assess the same parameters when they are inferred from remote sensing instruments, such as ground weather radar or space-borne radar. This subsection presents the results regarding the statistical properties of both model parameters derived from the Kuala Lumpur disdrometer as well as the relationships between these parameters.
4.2.1. Gamma Model
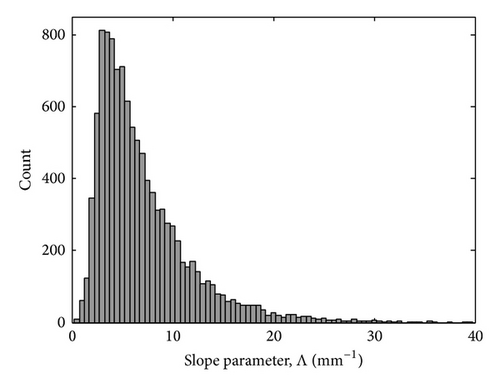
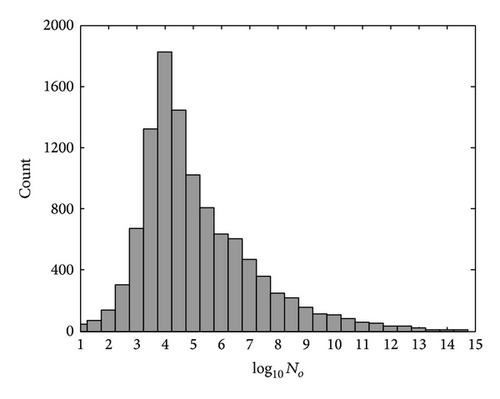
The slope parameter Λ (see Figure 7) and the intercept parameter log10No (see Figure 8) also follow the same trend of observation as observed in [39]. The mean value of Λ is 7.33, which is very similar to the result obtained in Japan, a value of 7.74 [39], but a slightly higher value was obtained in the tropical ocean of Kapingamarangi, a mean value of 10.6 mm−1 [10]. In addition, as shown in Figure 8, the intercept parameter log10No reported a mean value of 5.39 mm−1 m−3, which is also close to the mean value of 6.09 mm−1 m−3 obtained by Kozu [39].
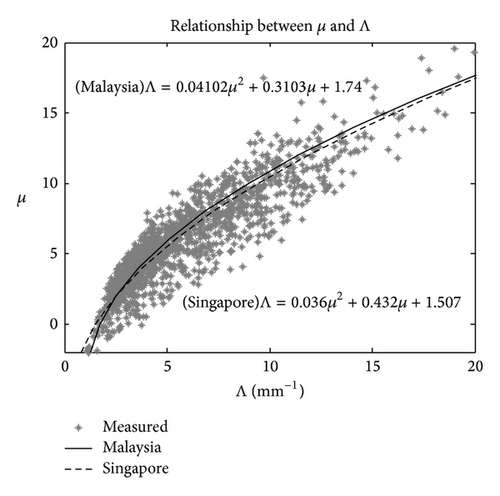
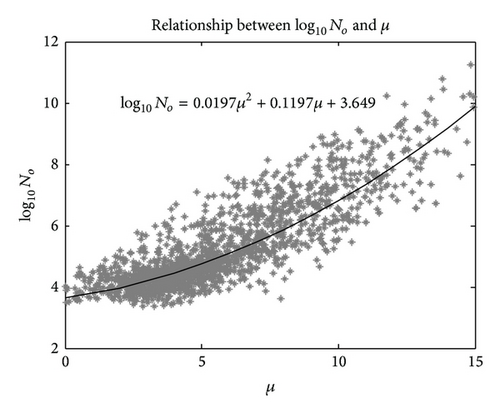
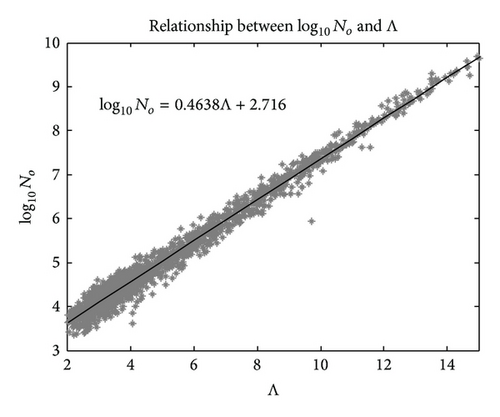
Apart from the statistical results, the relationships between the three parameters of Gamma DSD are also evaluated. Figures 9(a)–9(c) show the scatter plots of their relationships, together with the corresponding fitting. In the past, several studies have investigated the slope-shape relationship for Gamma DSD with the aim of changing it from a three-parameter to a two-parameter model [4, 18, 19].
4.2.2. Normalized Gamma Model
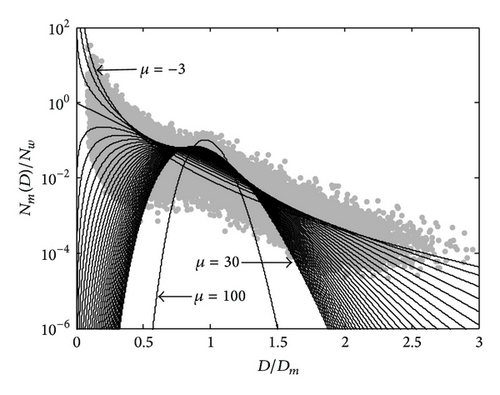
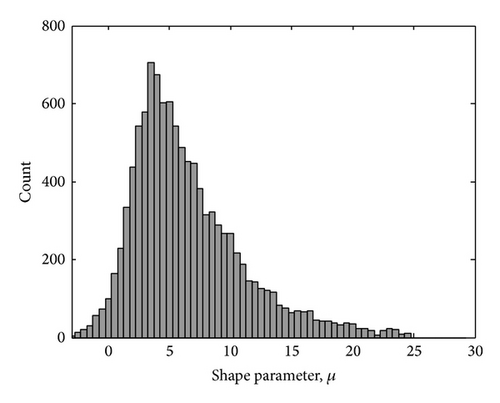
In order to have a clearer view of the range of μ, the histogram distribution of this parameter was obtained by means of the MoM and MLE methods and illustrated in Figures 11(a) and 11(b), respectively. It is worth noting that these plots tend to agree with each other fairly well, even though the distributions of MLE μ values have a slightly larger spread than the MoM μ values, with the mean and standard deviationσ values equal to 7.95 and 5.13, respectively, while for the MoM μ.
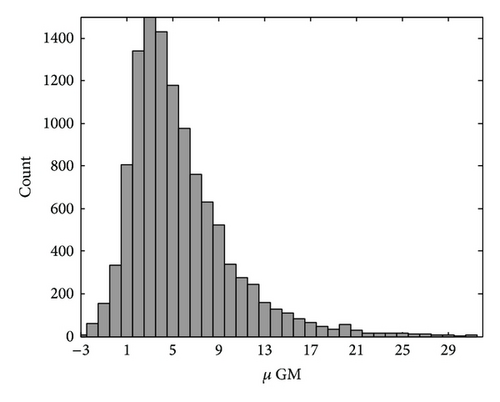
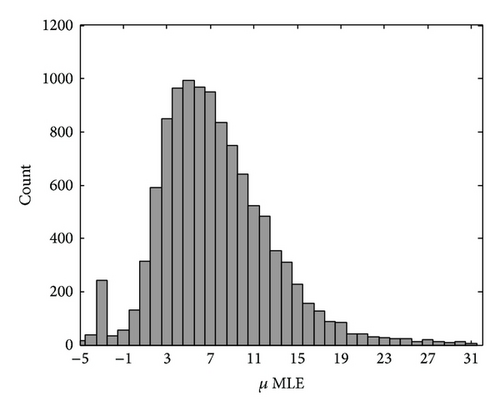
In addition to μ, Figures 12 and 13 show the histograms of the parameters Dm and log10Nw, which were estimated by the Gamma MoM from (16) and (17), respectively.
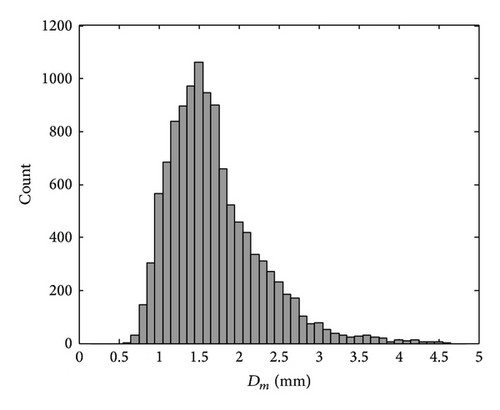
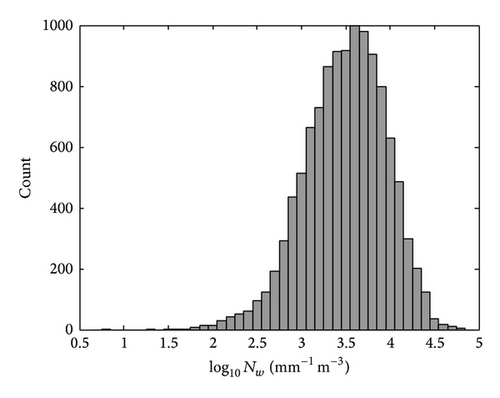
From the histogram of Dm, it is evident that the diameters of the drop spectra are dominated by a medium drop size, which was distributed from 1 mm to 2.5 mm with a mean of 1.74 mm and a σ of 0.59. This result is slightly larger than the observation made by Tokay and Short [10] in the tropical ocean = 1.41 mm).
In addition to the statistical distribution, to further understand the relationship between these normalized Gamma parameters, scatter plots of Dm versus log10Nw, Dm versus μ, and log10Nw versus μ are shown in Figures 14(a)–14(c), respectively. We noticed that the Dm values are somewhat inversely proportional to the log10Nw values, which seems to be in good agreement with scatter plots from the large set of disdrometer measurements collected in other parts of the world [40]. The other two scatter plots (Dm-μ and log10Nw-μ) show little correlation.
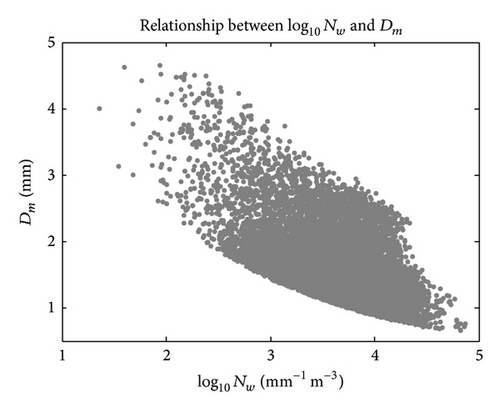
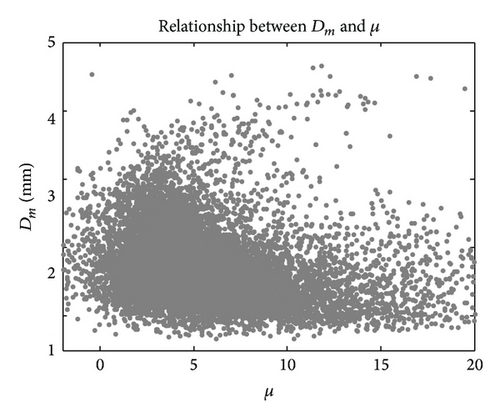
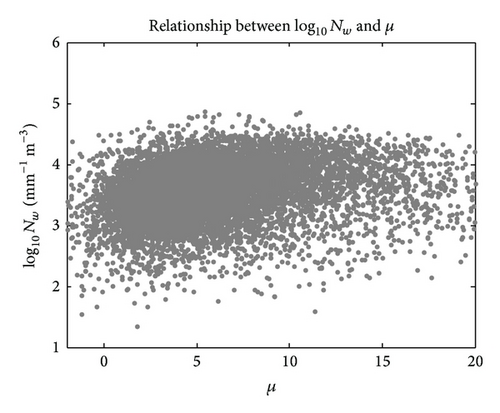
The summarized major statistical quantities of these two DSD models’ parameters are listed in Table 3 for the sake of clarity.
| Model | Parameter | Mean | SD | Min | Max | Kurtosis | Skewness |
|---|---|---|---|---|---|---|---|
| Gamma | logNo | 5.39 | 2.04 | 1.02 | 14.95 | 5.06 | 1.27 |
| Λ | 7.34 | 4.89 | 0.79 | 59.19 | 12.39 | 2.28 | |
| μ | 6.76 | 4.56 | −2.60 | 24.98 | 4.47 | 1.15 | |
| Normalized Gamma | logNw | 3.52 | 0.50 | 0.81 | 4.87 | 4.56 | −0.76 |
| Dm | 1.74 | 0.59 | 0.67 | 4.95 | 5.59 | 1.33 | |
| μ (GM) | 6.14 | 4.53 | −2.17 | 31.95 | 7.07 | 1.67 | |
| μ (MLE) | 7.95 | 5.13 | −4.91 | 31.75 | 4.63 | 0.80 | |
As can be seen from the statistics indicators in Table 3, low positive skewness values have been observed for all DSD parameters, which indicates that most of the parameter values tend to be distributed to the left of the mean values. On the other hand, the moderate kurtosis values for all model parameters confirmed that the datasets were aggregated near the mean, except for the shape parameter Λ in the Gamma model, which shows a higher kurtosis value, indicating the higher variability of this parameter.
In addition, it is worth noticing the values of the statistic indicators for the normalized Gamma model, which are consistent with those found by Montopoli et al. [41] (i.e., in their work, the mean of shape parameter μ is equal to 7.59, the mean of Dm is 1.76, the skewness Dm is 1.83, and the mean of log10Nw is 3.96, which are pretty close to the values found in this study).
4.3. Rain Rate Estimation
One of the main objectives in estimating and modeling the DSDs is to improve the estimation accuracy of meteorological quantities such as rain rate estimation and the radar reflectivity factor. In this subsection, the performances of the three-parameter Gamma and normalized Gamma models are assessed by means of comparing the estimated rain rate with the rain rate measured from the disdrometer.
| Model | εmean | εstd | εrms |
|---|---|---|---|
| Gamma | 0.65 | 12.19 | 12.21 |
| Normalized Gamma (Gamma moment) | 0.40 | 12.05 | 12.05 |
| Normalized Gamma (maximum likelihood) | 0.10 | 6.30 | 6.30 |
As expected, the results clearly show the excellent performance of the normalized Gamma model when the shape parameter μ is obtained by the MLE method. Indeed, the MLE method is a more accurate technique than the Gamma Moment method, which has already been proven by the analysis of the three years of disdrometer measurements from Chilbolton, UK [26]. The remaining models show comparable performance, with slight differences in terms of εrms. It should also be noted that the estimation of μ is critical as it depends on the dominant rainfall-generating mechanism associated with local climatologic features, as well as the quality of the data collected from the disdrometer.
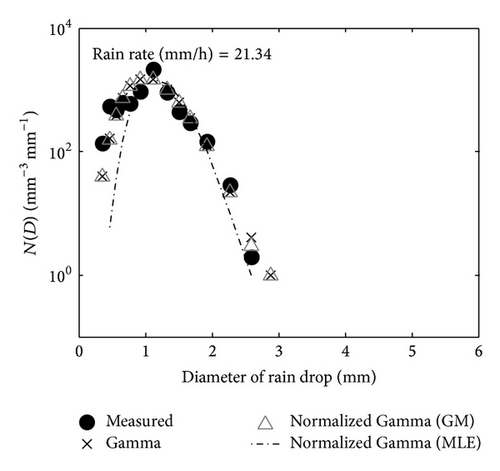
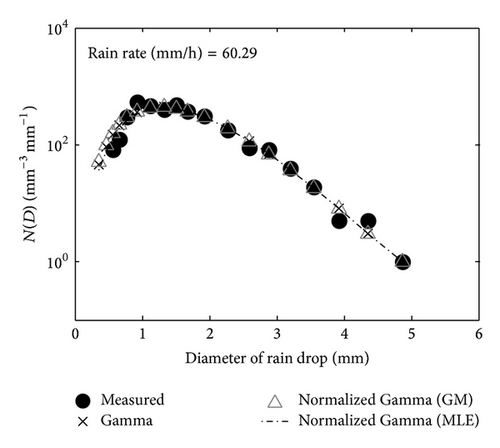
Examples of the model fitting of the disdrometer-measured DSD in Kuala Lumpur are shown in Figures 15(a) and 15(b) for two different rain rates.
5. Conclusions and Future Works
Three years of disdrometer measurements, collected in the equatorial region of Kuala Lumpur, Malaysia, have been analyzed to investigate the physical characteristics of natural DSD, and the governing parameters of the Gamma and normalized Gamma models have been estimated. In particular, the gamma DSD parameters have been derived by means of the MoM method using three higher-order moments (3rd, 4th, and 6th) whereas the parameters of the normalized Gamma distribution have been inferred through the MoM (μ, Nw, and Dm) and MLE methods (μ). The statistical properties of these parameters are then demonstrated, along with the relationships between them.
The empirical μ-Λ relationship derived from the observed DSD in Kuala Lumpur is very close to that inferred from the Singapore DSD, which clearly implies the typical characteristics of DSDs in this convective equatorial climate. In addition to this feature, our observations revealed that medium drops diameter dominated over the large sample of observed DSD data; the mean of the mass-weighted mean diameter is 1.74 mm, with a standard deviation of 0.59 mm, and this mass weighted mean diameter is found to have an inverse correlation with the log10Nw parameter.
Finally, the performances of the Gamma and the normalized Gamma models with two different shape parameters (μMoM and μMLE) have been evaluated in terms of rain rate estimation. The calculated rain rates from the models are compared with the rain rate derived directly from the measured DSD. As expected, the normalized Gamma model with μMLE clearly shows excellent performance as compared to the other models.
The results presented in this study are unique in the sense of the equatorial areas examined, and they could thus provide crucial information regarding the application of remote sensing or the propagation community in this particular area. In fact, it is worth mentioning that such results are of practical relevance to providing crucial assessment parameters for the Global Precipitation Measurement (GPM) ongoing mission [42]. This mission, which aims to provide quantification of precipitation on a global scale from the satellite/space-borne radar observation, required the knowledge of precipitation microphysics process at ground level specifically focusing on the spatial variability of DSD [43–46].
Beside this, ground based weather radars, such as single polarization radar, polarimetric radars, and dual-frequency precipitation radar onboard the GPM core satellites, also rely on parameterizations of DSD model [47–49]. Hence, the results provided in this work offer a clear physical interpretation of rain microphysics in this particular heavy rain region for the above purposes.
Conflict of Interests
The authors declare that there is no conflict of interests regarding the publication of this paper.
Acknowledgments
This work was supported by the Ministry of Higher Education (MOE) under FRGS Vote 4F320, Universiti Teknologi Malaysia (UTM) under Research University Grants 04H10 and 07H50, and Postdoctoral Fellowship and Universiti Tun Hussein Onn Malaysia (UTHM) scholarship.


