Analytical Model of Fluid Flow through Closed Structures for Vacuum Tube Systems
Abstract
An analytical model is developed to evaluate airtightness, which is one of the most important requirements of vacuum tube transportation systems. The main objective of the model is to anticipate the pressure inside a closed structure, which initially decreases and then rises with time owing to the inflow of the air outside. The model is formulated by using Darcy’s law and by solving the differential equations that consider the air permeability of the material and physical configuration of the tube. Equations are derived for a tube section in two cases: one with constant thickness and another with variable thickness. Although the developed model must be verified experimentally, results simulated by using the model with several assumed sections were consistent with the findings of a previous study. The mathematical model developed here to predict the behavior of the pressure inside a vacuum tube structure could be effectively used to evaluate the airtightness of vacuum tube transportation systems. Such data could provide background technical information for the practical design of the system.
1. Introduction
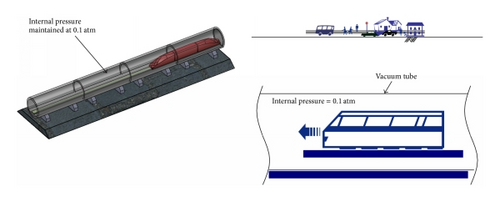
The air resistance that acts against a transportation vehicle increases with speed. Hence, minimizing air resistance could enhance vehicle speed without excessive consumption of propulsion energy. Vacuum tube systems, which constitute an innovative type of transportation mode where high speeds can be achieved for a vehicle by reducing the air pressure inside a tube structure to minimize air resistance (Figure 1), are increasingly attracting attention for their effectiveness and low emission levels. During the past several decades, transportation systems that use reduced air resistance such as the Vactrain system, Cargo Cap, and PCP (Pneumatic Capsule Pipeline) have been proposed [1–3]. Although these systems differ in their detailed characteristics, they share the basic idea of maintaining the pressure inside a tube structure at a low level. Although an actual vacuum tube system has not yet been realized, according to a recent study [4], the speed of the vehicle could reach up to 700 km/h provided that the pressure inside the tube is maintained at 0.1 atm. The system is therefore considered as a strong candidate that could provide an alternative to existing aviation systems.
One of the most important requirements that must be met by the infrastructure of a vacuum tube system is a sufficient level of airtightness. Otherwise, the capacity of the vacuum pumps would need to be inevitably increased, resulting in an increase in construction costs. In addition, the operation interval of the pumps would need to be reduced, increasing maintenance costs as well.
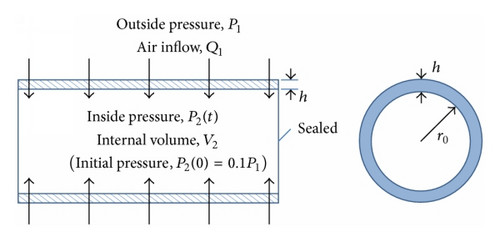
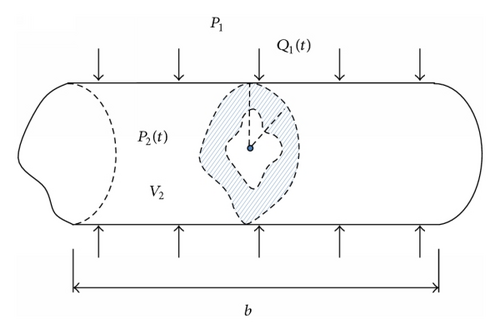
In a vacuum tube, the inside pressure is much lower than the atmospheric pressure outside. Air will then inflow into the vacuum tube structure from the outside unless the tube is completely airtight. The flow rate of air going through a porous medium can be calculated using Darcy’s law [5], given the pressure values on both sides. The pressure inside a vacuum tube, however, does not remain constant but increases with time because the tube is a closed hollow structure with finite volume; in contrast, the pressure outside the tube, that is, the atmospheric pressure, remains constant (Figure 2). The pressure inside the tube is therefore treated as a function of time formulated through a differential equation. Mathematical expressions that describe the pressure change inside a vacuum tube with variable thickness are formulated in this study. The differential equation is set up by applying Darcy’s law and considering the physical configuration of the tube structure and initial pressure condition.
2. Flow Model for Tube Structure with Constant Thickness
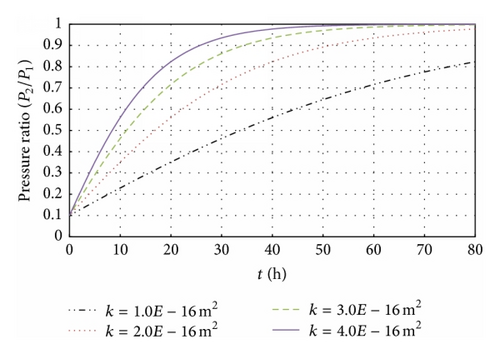
Using (5), the pressure change inside a vacuum tube structure with time can be anticipated. For example, Figure 3 shows the relation between time and the pressure inside a tube with a physical configuration of r0 = 1.0 m and h = 0.15 m for several different values of intrinsic permeability using (5).
3. Flow Model for Tube Structure with Variable Thickness
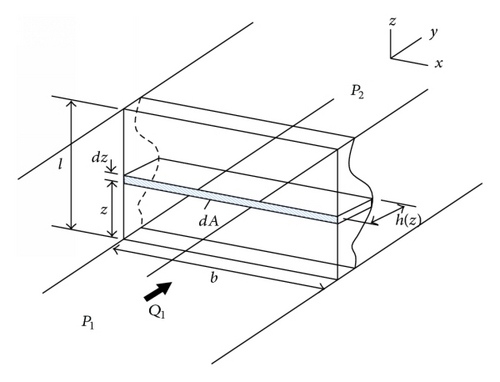
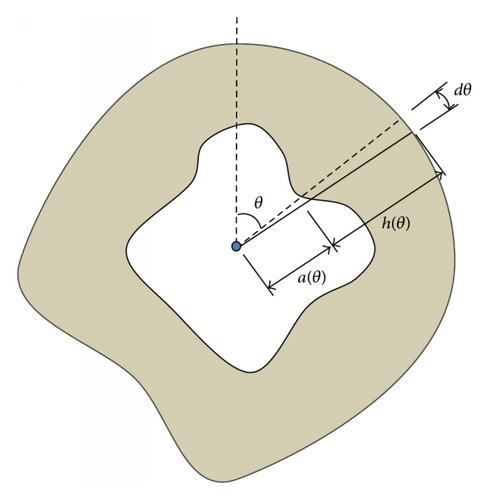
The mathematical model described in the previous section was established for the special case where the thickness of the tube section was constant. The actual thickness of a vacuum structure, however, may not always be constant; instead, it may vary along the radial direction because a tube section of a structural member is designed in consideration of various loads (e.g., dead, live, and special loads), in addition to cost and constructability (see Figure 4 for examples).

4. Illustrative Example
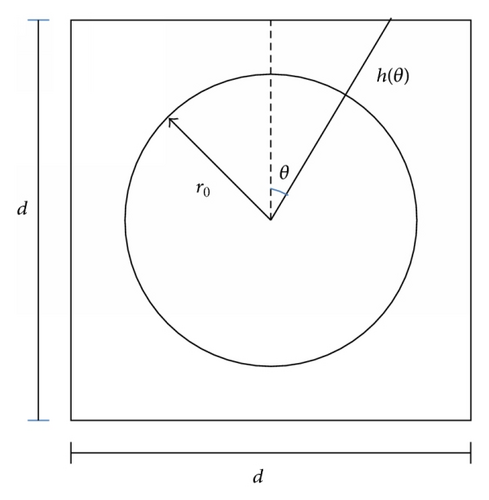
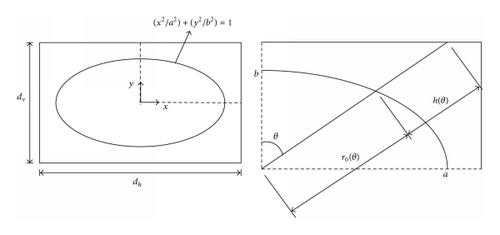
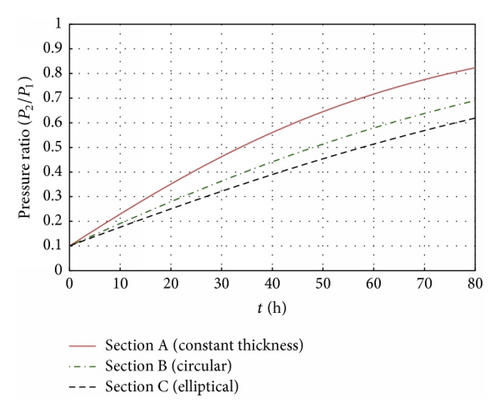
Figure 10 shows the pressure change as a function of time for tube structures with three different sections when the intrinsic air permeability is k = 1.0 × 10⁻¹⁶ m2. Section A was a circular section with constant thickness as in Figure 2, with a diameter of 2.0 m and a thickness of 0.15 m. Section B had a square outer section with a length of d = 2.3 m on each side and a circular inner section with a radius of r0 = 1.0 m. Section C had a rectangular outer section and an elliptical inner section with parameters a = 1.2 m, b = 1.0 m, dv = 2.3 m, and dh = 2.7 m (Figure 9). The pressure change plots shown in Figure 10 are for the case where the initial pressure inside the tubes was 10% of the atmospheric pressure. A comparison of the plots shows that the pressure inside the tube rose most rapidly for the tube with Section A and most slowly for the tube with Section C. This indicates that Sections C and A are the most and least airtight, respectively, among the three sections. Note that the average thickness of Section A is smaller than that of the other two sections and that the volume of the space inside the tube is the greatest for Section C. The trend in Figure 10 is therefore consistent with the results of a previous study [6] showing that an increase in the volume or thickness of the tube enhances its airtightness.
Although further experimental verification is needed, the mathematical model developed here to predict the behavior of the pressure inside a vacuum tube structure could be effectively used to evaluate the airtightness of vacuum tube transportation systems. The data thus obtained would provide background technical information for the practical design of the system.
5. Conclusions
An analytical model is developed to evaluate airtightness, which is one of the most important requirements of vacuum tube structures. The model anticipates the pressure inside a closed structure, which initially decreases and then rises with time. This is achieved by using Darcy’s law and solving differential equations that consider the air permeability of the material and physical configuration of the tube. Equations for the pressure change are formulated for tube sections with uniform thickness and variable thickness. The mathematical model developed is applied to several tube structures with assumed sections. The results show that the tube structure with the largest internal volume is the most airtight. In addition, given the same internal volume, the tube with a section that has a greater average thickness is more airtight. Although further experimental verification is needed, the results simulated by using the developed model are consistent with previous results showing that an increase in the volume or thickness of the tube enhances its airtightness. The mathematical model developed here for predicting the behavior of the pressure inside a vacuum tube structure could be effectively used to evaluate the airtightness of vacuum tube transportation systems. The obtained data could provide background technical information for the practical design of the system.
Disclaimer
The opinions, findings, conclusions, and recommendations expressed in this paper are those of the authors and do not necessarily reflect those of the sponsor.
Conflict of Interests
The authors declare that there is no conflict of interests regarding the publication of this paper.
Acknowledgment
This work was supported by a grant from the International Cooperation R&D Program of the Korea Institute of Energy Technology Evaluation and Planning (KETEP), funded by the Ministry of Knowledge Economy of the Republic of Korea (2010T100100963).


