Stochastic Analysis of a Two-Unit Cold Standby System Wherein Both Units May Become Operative Depending upon the Demand
Abstract
The present paper analyzes a two-unit cold standby system wherein both units may become operative depending upon the demand. Initially, one of the units is operative while the other is kept as cold standby. If the operative unit fails or the demand increases to the extent that one operative unit is not capable of meeting the demand, the standby unit becomes operative instantaneously. Thus, both units may become operative simultaneously to meet the increased demand. Availability in three types of upstates is as follows: (i) when the demand is less than or equal to production manufactured by one unit; (ii) when the demand is greater than whatever produced by one unit but less than or equal to production made by two units; and (iii) when the demand is greater than the produces by two units. Other measures of the system effectiveness have also been obtained in general case as well as for a particular case. Techniques of semi-Markov processes and regenerative processes have been used to obtain various measures of the system effectiveness.
1. Introduction
In the literature of reliability, extensive studies have been made on different types of one-unit or two-unit standby redundant systems owing to their frequent use in modern business and industrial systems. There are two major types of redundancy—parallel and standby. In parallel redundancy, the redundant units form part of the system from the start, whereas in a standby system the redundant units do not form part of the system from the start (until they are needed). Standby units can be classified as cold, warm, or hot. A cold standby is completely inactive and since it is not hooked up, it cannot fail until it is replacing the primary unit. A warm standby has a diminished load because it is only partially energized. A hot standby is fully active in the system (although redundant).
A lot of work has been done on reliability and cost analysis of various systems by various researchers including [1–17] who have analyzed these systems by considering various concepts like the Erlangian repair time, operating and rest periods, hardware/software faults, congestion of calls, availability, two types of repair facility, human failure, regenerative point technique, priority repair discipline, instruction, accident, patience time, chances of nonavailability of expert repairman, one big unit and two small identical units with priority for operation/repair to big unit, patience time, partial failures, and optimized maintenance of the diesel system in locomotives. In all such studies, the demand was fixed. There may be situations where demand may vary and hence it affects the operability of the units of a system. The concept of variation in demand has been studied by [18, 19]. This concept of variation in demand was considered for single unit systems, where the system either is in working state on some demand or is put to shut down mode on no demand. However, the demand may be much more than whatever produced by a single unit system and hence there is need of having one additional unit to meet the demand. Study of the concept of variation in demand for the two-unit system thus becomes more important.
Keeping the above observations in view, we, in the present paper, develop a reliability model for a two-unit standby system working in a cable manufacturing plant wherein cold standby may become operative depending on demand. Information of such a system was gathered on visiting a cable manufacturing plant in H.P., India. It was observed that there were two units in the plant which were used to manufacture polyvinyl chloride (PVC) wires as per the demand in the market. If the demand is less than whatever produced by one unit, only one unit is kept operative, whereas if demand is greater than the production from a single unit, both units are put to operative mode. Various measures of the system effectiveness are analyzed by making use of semi-Markov processes and regenerative point techniques.
The rest of the paper is organized as follows. In Section 2, we develop the proposed semi-Markov model and presented its description. In Section 3, we find the steady-state probabilities and mean sojourn times. Section 4 deals with the computation of steady-state measures, such as mean time to system failure (MTSF), availability in three types of upstates (i.e., when demand is less than or equal to production made by one unit; when demand is greater than production made by one unit, but less than or equal to production made by two units; when demand is greater than production made by two units), busy period of the repairman for repair, and expected number of visits by the repairman. In Section 5, cost-benefit has been obtained as a general case. On the basis of the data/information estimated from the cable manufacturing plant, a particular case has been discussed in Section 6 and various graphs have been plotted in Section 7. Final conclusions along with some future directions are presented in Section 8.
2. Model Description and Assumptions
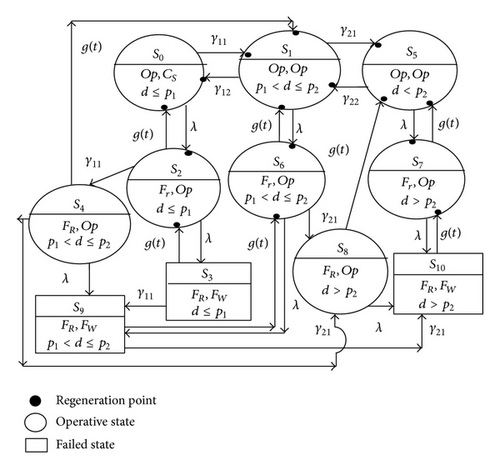
Figure 1 depicts the state transition model which we developed for a two-unit standby system working in a cable manufacturing plant wherein cold standby may become operative depending on demand. If one or both units are in working mode, then the system is in operative state. When both units are not working, that is, one is under repair and the other is waiting to be repaired, the system will stay in the failed state.
- (1)
The units are similar and statistically independent.
- (2)
Demand cannot be decreased further, when at the most one unit is operative.
- (3)
Each unit is new after repair.
- (4)
If a unit is failed, standby unit takes over automatically.
- (5)
The system becomes inoperable when both units fail in a two-unit system.
- (6)
All the random variables are independent.
- (7)
Switching is perfect and instantaneous.
- (8)
Failure and repair time follow exponential and general time distribution, respectively.
3. Transition Probabilities and Mean Sojourn Times
4. Measures of System Effectiveness
4.1. Mean Time to System Failure
4.2. Availability Analysis When Demand Is Less Than or Equal to Production Made by One Unit (d ≤ p1)
4.3. Availability Analysis When Demand Is Greater Than the Production Made by One Unit and Less Than or Equal to Production Made by Two Units (p1 < d ≤ p2)
4.4. Availability Analysis When Demand Is Greater Than Production Made by Two Units (d > p2)
4.5. Busy Period Analysis of the Repairman
4.6. Expected Number of Visits by the Repairman
5. Cost-Benefit Analysis
6. Particular Case
For the particular case, let us take g(t) = αe−αt and the values estimated from the system, that is, γ11 = 0.235/hr, γ12 = 0.07/hr, γ21 = 0.4213/hr, γ22 = 0.353/hr, α = 1/hr,λ = 0.003/hr, C0 = INR 7000, C1 = INR 1000, C2 = INR 200, C3 = INR 100, and C4 = INR 400 (all costs are in Indian rupees).
- (i)
mean time to system failure (MTSF) = 100534.2109 hrs;
- (ii)
steady-state availability when demand is less than or equal to production made by one unit (d ≤ p1) ;
- (iii)
steady-state availability when demand is greater than the production made by one unit and less than or equal to production made by two units (p1 < d ≤ p2) ;
- (iv)
steady-state availability when demand is greater than the production made by two units (d > p2) ;
- (v)
busy period of the repairman for repair (B0) = 0.004613;
- (vi)
expected number of visits by the repairman (V0) = 0.0157;
- (vii)
profit incurred to the system = INR 101.3576.
7. Graphical Analysis
- (i)
MTSF gets decreased with increase in the values of failure rate but increased with increase in the values of repair rate. The values of other parameters per hour are taken as
() - (ii)
The graph of availability () when demand is less than or equal to whatever production given by a single unit (d ≤ p1) versus failure rate (λ) for different values of repair rate (α) shows that it gets decreased monotonically with increase in the values of failure rate but increases with increase in the values of repair rate. Similar behavior has been shown for the availability () when demand is greater than the production by one unit but less than or equal to production made by two units (p1 < d ≤ p2) and also for the availability () when demand is greater than the production made by two units (d > p2). The graphs revealed that the availabilities in three types of the upstates (), (), () are different in magnitude for the same values of parameters λ, α, γ11, γ12, γ21, and γ22.
- (iii)
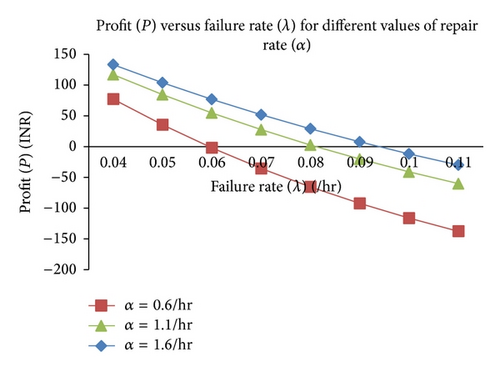
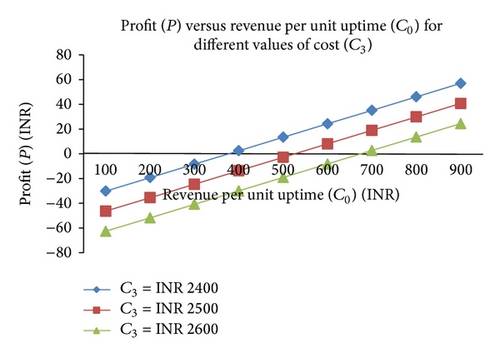
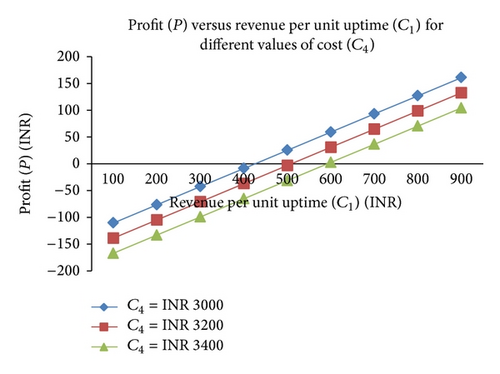
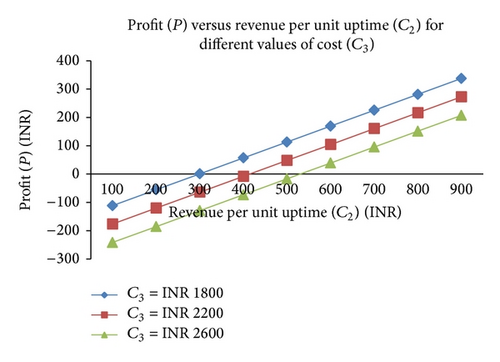
Behavior of the profit with respect to failure rate/revenue per unit uptime for different values of repair rate/cost of engaging the repairman has also been observed from the graphs. Some of these graphs are shown in Figures 2, 3, 4, and 5. The graphs depict that the profit gets decreased with increase in the values of failure rate and also with the increase in cost of engaging/visiting the repairman but increases with increase in the values of repair rate/revenue per unit uptime.
| Fixed parameter | Varied parameter | Profit | ||
|---|---|---|---|---|
| Positive | Negative | Zero (cut-off point) | ||
|
α = 0.6/hr | λ < 0.0598 | λ > 0.0598 | λ = 0.0598 |
| α = 1.1/hr, | λ < 0.0796 | λ > 0.0796 | λ = 0.0796 | |
| α = 1.6/hr | λ < 0.0943 | λ > 0.0943 | λ = 0.0943 | |
| γ11 = 0.235/hr, γ12 = 0.07/hr, γ21 = 0.4213/hr, γ22 = 0.353/hr, α = 1/hr, λ = 0.003/hr, C1 = INR 1000, C2 = INR 200, C4 = INR 400 | C3 = INR 2400 | C0 > 395.00 | C0 < 395.00 | C0 = 395.00 |
| C3 = INR 2500 | C0 > 530.00 | C0 < 580.02 | C0 = 530.00 | |
| C3 = INR 2600 | C0 > 690.00 | C0 < 690.00 | C0 = 690.00 | |
| γ11 = 0.235/hr, γ12 = 0.07/hr, γ21 = 0.4213/hr, γ22 = 0.353/hr, α = 1/hr, λ = 0.003/hr, C0 = INR 7000, C2 = INR 200, C4 = INR 400 | C3 = INR 1800 | C1 > 224.57 | C1 < 224.57 | C1 = 224.57 |
| C3 = INR 2200 | C1 > 387.34 | C1 < 387.34 | C1 = 387.34 | |
| C3 = INR 2600 | C1 > 597.31 | C1 < 597.31 | C1 = 597.31 | |
| γ11 = 0.235/hr, γ12 = 0.07/hr, γ21 = 0.4213/hr, γ22 = 0.353/hr, α = 1/hr, λ = 0.003/hr, C0 = INR 7000, C1 = INR 1000, C4 = INR 400 | C3 = INR 1800 | C2 > 298.12 | C2 < 298.12 | C2 = 298.12 |
| C3 = INR 2200 | C2 > 399.13 | C2 < 399.13 | C2 = 399.13 | |
| C3 = INR 2600 | C2 > 527.82 | C2 < 527.82 | C2 = 527.82 | |
| γ11 = 0.235/hr, γ12 = 0.07/hr, γ21 = 0.4213/hr, γ22 = 0.353/hr, α = 1/hr, λ = 0.003/hr, C1 = INR 1000, C2 = INR 200, C3 = INR 100 | C4 = INR 3000 | C0 > 495.63 | C0 < 495.63 | C0 = 495.63 |
| C4 = INR 3100 | C0 > 580.02 | C0 < 580.02 | C0 = 580.02 | |
| C4 = INR 3200 | C0 > 745.19 | C0 < 745.19 | C0 = 745.19 | |
| γ 11 = 0.235/hr, γ12 = 0.07/hr, γ21 = 0.4213/hr, γ22 = 0.353/hr, α = 1/hr, λ = .003/hr, C0 = INR 7000, C2 = INR 200, C3 = INR 100 | C4 = INR 3000 | C1 > 422.09 | C1 < 422.09 | C1 = 422.09 |
| C4 = INR 3200 | C1 > 498.12 | C1 < 498.12 | C1 = 498.12 | |
| C4 = INR 3400 | C1 > 599.02 | C1 < 599.02 | C1 = 599.02 | |
| γ11 = 0.235/hr, γ12 = 0.07/hr, γ21 = 0.4213/hr, γ22 = 0.353/hr, α = 1/hr, λ = 0.003/hr, C0 = INR 7000, C1 = INR 1000, C3 = INR 100 | C4 = INR 1800 | C2 > 298.79 | C2 < 298.79 | C2 = 298.79 |
| C4 = INR 2400 | C2 > 448.07 | C2 < 448.07 | C2 = 448.07 | |
| C4 = INR 3000 | C2 > 599.13 | C2 < 599.13 | C2 = 599.13 | |
8. Conclusion
- (i)
mean sojourn times;
- (ii)
steady-state probabilities;
- (iii)
mean time to system failure (MTSF);
- (iv)
availability in three types of upstates (i.e., when demand is less than or equal to production made by one unit; when demand is greater than production made by one unit, but less than or equal to production made by two units; when demand is greater than production made by two units) and other measures of the system effectiveness which have been obtained in general case as well as for a particular case; it can also be concluded that these steady-state availabilities have different values in magnitude for the same value of failure rate and repair rate;
- (v)
busy period of the repairman for repair;
- (vi)
expected number of visits by the repairman;
- (vii)
profit incurred to the system;
- (viii)
various graphs which are plotted to provide a better understanding of the behaviour of the system, help to refine its stochastic description, and lead to better estimates of the model parameters;
- (ix)
graphs from which the behavior of mean time to system failure, different types of availability, and the profit can be depicted with respect to failure rate/repair rate/cost for engaging repairman/revenue per unit up time/cost per visit of the repairman that have been plotted;
- (x)
various cut-off points for the profit of the system which help to decide about how much should be the maximum tolerable value of the failure rate of the system and how much the cost price of the product (cable wires) manufactured by the system should be sold to get at least that value of revenue per unit uptime so as to get positive profit;
- (xi)
the lower limits for the revenue per unit uptime for positive profit that have been obtained which may be quite useful for the system manufacturers, engineers, and the system analysts;
- (xii)
the upper limit for the cost per visit as well as for engaging the repairman which has been obtained.
Further, we are focusing on developing some more realistic models (e.g., hot standby system) related to the given system. Cost-benefit analysis for the system will be carried out to increase the uptime of the system and to reduce the cost involved in system.
Symbols for the Various States
-
- ◯:
-
- Operative state for the system
-
- ▭:
-
- Failed state for the system
-
- D:
-
- Symbol for demand
-
- p1:
-
- Symbol for production by single unit
-
- p2:
-
- Symbol for production by two units.
Notations
-
- λ:
-
- Failure rate of the operative unit
-
- γ11:
-
- Rate of increase of demand when demand is greater than the production made by one unit and less than or equal to production made by two units (p1 < d ≤ p2)
-
- γ12:
-
- Rate of decrease of demand so as to become less than or equal to production made by one unit (d ≤ p1)
-
- γ21:
-
- Rate of further increase of demand when demand is greater than the production made by two units (d > p2)
-
- γ22:
-
- Rate of decrease of demand when demand is greater than the production made by one unit and less than or equal to production made by two units (p1 < d ≤ p2)
-
- :
-
- Probability that the system is in upstate when demand is less than or equal to production made by one unit (d ≤ p1) at instant t given that it entered the state i at t = 0
-
- :
-
- Probability that the system is in upstate when demand is greater than the production made by one unit and less than or equal to production made by two units (p1 < d ≤ p2) at instant t given that it entered the state i at t = 0
-
- :
-
- Probability that the system is in upstate when demand is greater than production made by two units (d > p2) at instant t given that it entered the state i at t = 0
-
- Bi(t):
-
- Probability that the repairman is busy to repair the failed unit at instant t given that it entered the state i at t = 0
-
- Mi(t):
-
- Probability that the system, initially up in the regenerative state i, is up at time t without passing through any other regenerative state
-
- mij:
-
- Contribution to mean sojourn time in regenerative state i before transiting to regenerative state j without visiting any other state
-
- μi:
-
- Mean sojourn time in regenerative state i before transiting to any other state
-
- ′:
-
- Symbol for derivative
-
- *:
-
- Symbol for Laplace transforms
-
- Ls:
-
- Symbol for Laplace Stieltjes transforms
-
- Ⓒ:
-
- Symbol for Laplace convolution
-
- ⋆:
-
- Symbol for Stieltjes convolution
-
- qij(t), Qij(t):
-
- p.d.f. and c.d.f of the first passage time from a regenerative state i to a regenerative state j or to a failed state j without visiting any other regenerative state in (0, t]
-
- g(t), G(t):
-
- p.d.f. and c.d.f of repair rate at instant t.
States of System
-
- CS:
-
- Unit is in cold standby state
-
- Op (d ≤ p1):
-
- Unit is in operative state when demand is less than or equal to production made by one unit
-
- Op (p1 < d ≤ p2):
-
- Unit is in operative state when demand is greater than the production made by one unit and less than or equal to production made by two units
-
- Op (d > p2):
-
- Unit is in operative state when demand is greater than production made by two units
-
- Fr:
-
- Failed unit under repair
-
- FR:
-
- Repair of failed unit continuing from previous state
-
- Fw:
-
- Failed unit waiting for repair.
Conflict of Interests
The authors declare that there is no conflict of interests regarding the publication of this paper.


