Modelling Hepatotoxicity of Antiretroviral Therapy in the Liver during HIV Monoinfection
Abstract
Liver related complications are currently the leading cause of morbidity and mortality among human immunodeficiency virus (HIV) infected individuals. In HIV monoinfected individuals on therapy, liver injury has been associated with the use of antiretroviral agents as most of them exhibit some degree of toxicity. In this study we proposed a mathematical model with the aim of investigating hepatotoxicity of combinational therapy of antiretroviral drugs. Therapy efficacy and toxicity were incorporated in the model as dose-response functions. With the parameter values used in the study, protease inhibitors-based regimens were found to be more toxic than nonnucleoside reverse transcriptase inhibitors-based regimens. In both regimens, the combination of stavudine and zidovudine was the most toxic baseline nucleoside reverse transcriptase inhibitors followed by didanosine with stavudine. However, the least toxic combinations were zidovudine and lamivudine followed by didanosine and lamivudine. The study proposed that, under the same second line regimens, the most toxic first line combination gives the highest viral load and vice versa.
1. Introduction
Among people infected with human immunodeficiency virus (HIV), liver related complications have become the leading causes of morbidity and mortality [1]. There are a number of factors identified that are known to contribute to liver related mortality in HIV infected people. These are, for instance, coinfections with viral hepatitis B (HBV) and hepatitis C (HCV) as well as the use of antiretroviral therapy (ART) [2–6]. Although liver disease can occur solely due to HIV infection [7–10], the use of ART is highly associated with end stage liver disease in HIV infected people [6, 11].
A human body identifies every substance it absorbs, including drugs as a foreign substance. All substances that are identified as foreign are subjected to chemical processes, [12], to make them suitable for elimination. Although all tissues in the body have some ability to metabolise, the liver is the central metabolic clearing organ of all chemicals from a human body. This process is carried out by metabolising enzymes cytochrome P450 which are found in hepatocytes [12]. The role played by hepatocytes in handling toxic drug substances makes them vulnerable to drug induced injury (hepatotoxicity) and, consequently, cell death [12–14]. Drug-induced liver injury is responsible for 5% of all hospital admissions and 50% of all acute liver failures [5].
According to [15], generally all antiretroviral drugs exhibit some level of toxicity to the liver. Hepatocytes that are responsible for metabolizing toxic antiretroviral drugs [12, 13] also support all stages of HIV infection and replication [9, 10, 16, 17]. This double distress to hepatocytes would possibly partly explain the progression of liver disease in HIV infected people on ART. Using ART in combination makes it even more complicated to assess which drug leads to higher levels of hepatotoxicity than the other [18].
According to [8, 10, 19], HIV can directly infect human hepatocytes. Considering HIV infection and replication in hepatocytes [16, 17, 20] and CD4+ cells [21–23] as well as macrophages, [11, 19], this study used a mathematical model to analyse therapeutic and toxic effects of HIV antiretroviral therapy. Defining hepatotoxicity generally as liver damage, there are a number of conditions that would fall under hepatotoxicity, and they include hepatitis, hepatic necrosis, and hepatic steatosis [24, 25]. This study considered only hepatic necrosis, which is the death of liver cells.
Drugs studied include zidovudine (AZT), emtricitabine (FTC), didanosine (DDI), lamivudine (3TC), stavudine (d4T), efavirenz (EFV), atazanavir (ATV), and nelfinavir (NFV). Various drug combinations as recommended by World Health Organisation were considered. The study accounted for therapeutic and toxic effects of all classes of ART in form of dose-response functions [26, 27].
2. Material and Methods
2.1. Mathematical Model Development
Recent study by [26] as well as [28] asserts that all classes of ART exhibit dose-response curves. Finding a dose that gives 50% of maximal response is one method of determining how effective the drug is; therefore, [26] recommends that it would be of great contribution if efficacy of ART would be modelled as dose-response.
Much as antiretroviral drugs are taken in doses at specific time intervals and the effectiveness and toxicity of the drug are largely dependent on the pharmacokinetics of the drug taken, our study preferred to use the Hill equation as recommended by [26], to model drug efficacy as opposed to Michaelis-Menten kinetics [29]. Reactions involving a single substrate are often assumed to follow Michaelis-Menten kinetics, irrespective of the model′s underlying assumptions. Since we are dealing with possible multiple drug reactions, the use of Michaelis-Menten equation would thus be inappropriate. The study has also adopted the use of the Hill equation because we are investigating therapeutic and toxic effect of therapy at steady state.
| Medication | d [μM] | m | IC50 [μM] | TD50 [μM] | Reference |
|---|---|---|---|---|---|
| Zidovudine (AZT) | 37.4195 | 0.85 | 0.1823 | 127.7868 | [32] |
| Didanosine (DDI) | 28.2229 | 1.07 | 0.1794 | 275.3284 | [32] |
| Lamivudine (3TC) | 21.8103 | 1.15 | 0.0298 | 170.5277 | [33] |
| Stavudine (d4T) | 4.4603 | 1.13 | 0.552 | 431.6235 | [32] |
| Efavirenz (EFV) | 31.6776 | 1.67 | 0.0054 | 53.8520 | [34] |
| Atazanavir (ATV) | 7.0932 | 2.69 | 0.0136 | 85.1185 | [32] |
| Nelfinavir (NFV) | 62.81 | 1.81 | 0.1668 | 72.8875 | [35] |
In model formulation, we define eight variables as follows: uninfected CD4+ cells (Tc), infectious CD4+ cells (Ic), uninfected hepatocytes (Th), latently infected hepatocytes (Ihl), [9], productively infected hepatocytes (Iha), HIV-specific cytotoxic T lymphocytes (L), viral load (V), and the level of enzyme alanine aminotransferase in blood (A).
Model parameters are as follows: CD4+ cells and hepatocytes are produced from within the body at rates λ1 and λ2 and die naturally at rates d1 and d3, respectively. We assume that, among all cells in the liver, HIV has high affinity for CD4+ cells and hepatocytes [20]. Thus, from the free viral population in the liver, if a virus is to infect a cell, there is a probability q that it will infect a hepatocyte at rate β2 and a probability 1 − q that it infects a CD4+ T cell at rate β1. Infected CD4+cells die at rate d2, where d2 > d1, and are cleared by HIV-specific cytotoxic T-lymphocytes (CTLs) at a rate k1.
When a hepatocyte is infected, there is a probability p that it becomes productively infected (viral replication will take place after successful reverse transcription) and probability (1 − p) that the cell will become latently infected, such that there is no viral production until cell activation. Decay rates for productive hepatocytes and latently infected hepatocytes are, respectively, d5 and d4, where d5 > d4 [36]. Productively infected hepatocytes are killed by HIV-specific CTLs at rate k2 and until activated, latently infected hepatocytes will not trigger the action of CTLs. This study assumes that latently infected hepatocytes will either get activated to become infectious or die. There is no possibility that they will become uninfected again [37]. Latently infected hepatocytes are activated at rate μ, and it is assumed that this rate is reduced by the the efficacy of PIs. This is because our study assumed that reverse transcription has already taken place at this stage so reverse transcriptase inhibitors will have no effect.
With or without any pathogen in the body CTLs proliferate naturally at rate x and in the presence of HIV infection, they proliferate at rate k3 and are cleared at rate d6. Let s1 and s2 represent the rates of HIV production per infected CD4+ cells and productively infected hepatocytes, respectively. In addition to CD4+ cells and hepatocytes, HIV productively infects other cells and macrophages like Kupffer cells in the liver [11, 19, 45]. These cells produce virions at rate m. The study assumed that the effect of medication is translated generally into minimal viral load. Thus, viral production from macrophages is also inhibited by both RTIs and PIs. As in [46], we assumed a synergy additivity of PIs and RTIs as Φ = (1 − ϕ1)(1 − ϕ2) [39]. Virions die at a per capita rate d7.
This study assumes that some infectious hepatocytes that die due to drug metabolism are able to release viral particles, provided that at the point of hepatocyte’s death all the stages of viral production have been attained. N is the per capita rate of virions production by each infectious hepatocyte that dies due to drug metabolism. Viral production due to hepatotoxicity was inhibited by resultant efficacy of both RTIs and PIs.
Equation (10) defines the level of enzyme alanine aminotransferase (ALT) in the blood system. Among other enzymes, hepatocytes contain enzyme ALT, and when the cells die by any means, ALT leaks into the blood where it is clinically detected. According to [3], when there is no infection, the level of ALT in the blood system is generated from naturally dying hepatocytes at rate r. As described in [42], k4 is the rate at which ALT is generated from hepatocytes that die due to HIV infection. (d5 + ψ + k2L) and (d4 + ψ) are the total death rate of productively infected hepatocytes and latently infected hepatocytes, respectively, attributed to HIV infection. The contribution to ALT by healthy hepatocytes is only due to drug metabolism. ALT is cleared from the blood naturally at rate d8.
2.2. Model Analysis
2.2.1. Positivity and Boundedness of Solutions
With initial conditions Th0 > 0, Ic0 > 0, Th0 > 0, Ihl0 ≥ 0, Iha0 ≥ 0, L0 > 0, V0 > 0, and A0 ≥ 0, the solutions for Th, Ic, Th, Ihl, Iha, L, V, and A, respectively, remain positive and bounded provided t > 0.
- (1)
consider
()the upper bound of Nh increases and approaches asymptotically the value λ2/(ψ + d3); - (2)
consider
()the upper bound of Nh decreases and approaches asymptotically the value λ2/(ψ + d3).
Similarly, it can also be shown that Nc(t) is bounded by λ1/d1.
If the total number of CD4+ cells (Nc) and hepatocytes (Nh) are bounded by λ1/d1 and λ2/(d3 + ψ), then the subclasses (Ic) and (Iha and Ihl) respectively are bounded. Thus, letting M1 = λ2/(d3 + ψ) and M2 = λ1/d1 then Tc < M2, Ic < M2, Th < M1, Ihl < M1, and Iha < M1.
Using the same argument as in (15), we can deduce that V is bounded by V0.
Equation (10) is defined by bounded functions; therefore, A is bounded by some M5, where M5 = max{M1, M3, M4}.
2.2.2. The Basic Reproductive Number
Using Theorem 2 of [47] we establish the following result that the disease-free equilibrium Ed is locally asymptotically stable when R0 < 1 and unstable when R0 > 1.
2.2.3. Effective Reproductive Number
Case 1. When a1 > 0, that is,
Case 2. When a1 < 0, that is,
2.2.4. Sensitivity Analysis
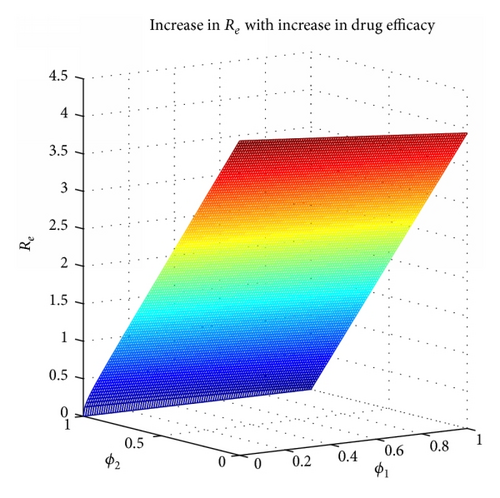
Since 0 ≤ p ≤ 1, the right hand side of (36) is greater than the left hand side provided (NψΦ + s2(1 − ϕ2)) < 1. This is not likely because of the values of N and s2 (100 and 1000, resp.). Therefore Δ < 0; this would imply that R0h < Reh, hence indicating that the toxic effect of medication speeds up the progression of infection.
2.2.5. Endemic Equilibrium
Due to the complexity of the model, mathematical analysis is rather cumbersome. We therefore assume a free virus spread of infection and no cell-to-cell transfer of HIV, [50], ruling out the interaction between CD4+ cells and hepatocytes. We therefore split the model into two subpopulations of either cell. We further consider virions produced from either type of cells as the viral production in that subpopulation. We assume a fraction ρ of the total viral population from macrophages to contribute to the viral population in hepatocytes subpopulation while the remainder would contribute to the viral population in CD4+ cells subpopulation. We subdivide the system of (3)–(10) into the following.
2.2.6. Reduced Model
We reduce the model for further analysis with assumption that RTIs and PIs have an overall drug efficacy given by Φ, where Φ = 1 − (1 − ϕ1)(1 − ϕ2) [52]. The combined efficacy Φ reduces the rate at which the virus infects CD4+ cells (β1) and hepatocytes (β2). We further assumed that much as macrophages act as reserve source for HIV production throughout HIV infection [53], the level of replication is low as compared to other cells. We therefore revised the model to exclude viral production from macrophages and subdivided it into CD4+ cells and hepatocytes subpopulation. The objective was to investigate the critical combined efficacy of antiretroviral therapy above which the infection would be managed as well as the optimal toxicity below which alanine aminotransferase level in the blood would be negligible.
3. Results
3.1. Numerical Simulation
In this section we present the numerical simulations of the model while both the therapeutic and toxic effects of the drugs are incorporated. Medications used in this study are listed in Table 1, while parameter values used in simulations are in Table 2. Parameter values used in calculation of therapeutic and toxic functions in (1) and (2) are shown in Table 1.
| Par. | Description | Value | Source |
|---|---|---|---|
| λ1 | Rate of creation of CD4+ cells from within the body |
|
[36] |
| d1 | Natural death rate of uninfected CD4+ cells | 0.01 | [37] |
| q | Probability that HIV infects hepatocytes | 0.2 | Estimate |
| p | Probability that hepatocyte becomes productively infected | 0.3 | Estimate |
| μ | Rate at which latently infected hepatocytes become productive | 0.006 | Estimate |
| β1 | Rate of transmission of HIV in CD4+ cells | 0.00015 (mL)−1 | [36] |
| x | Antigen-independent CTLs proliferation rate | 20 | [23] |
| k1 | Rate at which CTLs kill infectious CD4+ cells | 50 | [38] |
| k2 | Rate at which CTLs kill infectious hepatocytes | 1 | [21] |
| k3 | Antigen-dependent proliferation rate of CTLs | 0.2 | [39] |
| d2 | Death rate of infected CD4+ due to infection | 0.5 | [40] |
| λ2 | Rate of creation of hepatocytes from within the body | 27200 | [41] |
| d3 | Natural death rate of hepatocytes | 0.002 | [42] |
| β2 | Rate of transmission of HIV in hepatocytes | 0.000015 | Estimate |
| d4 | Death rate of latently infected hepatocytes | 0.01 | Estimate |
| d5 | Death rate of infectious hepatocytes | 0.5 | Estimate |
| d6 | Rate of clearance of CTLS by all means | 0.15 | [21] |
| s1 | Average rate of production of virions by an infected CD4+ cells | 50,000 | [43] |
| s2 | Average rate of production of virions by an infected hepatocyte | 1000 | Estimate |
| d7 | Death rate of HIV | 2 | [40] |
| m | Rate of production of virions from macrophages | 5 | [23] |
| N | Virions produced due to drug metabolism | 100 | Estimate |
| r | Natural enzyme elevation | 14 | [44] |
| d8 | Rate of clearance of ALT from blood system | 0.25 | [42] |
| k4 | Rate of generation of liver enzyme in the blood | 2000 | [42] |
Simulating the dynamics of HIV in the liver, three cases were considered: (1) no treatment, (2) with treatment but without toxic effect of the drugs, and (3) with treatment plus toxic effect. Figure 2 depicts the results. Clearly, therapy reduced viral load resulting in fewer number of latent and infectious cells. In case of CD4+ cells, the medication consequently resulted into increased number of uninfected cells. Healthy CD4+ cells were many when the toxic therapy was administered as opposed to when it was not used. However, the dynamics were different in hepatocytes. When the toxic medication was administered, the number of uninfected cells was much less than when medication was not applied at all. This suggested that much as HIV infects hepatocytes, the rate of progression is slower in these types of cells as compared to CD4+ cells [20]. However, hepatocytes seemed to be more affected by toxicity than HIV infection. This was consequently seen in the level of enzymes in the blood that was a lot higher in the case of drug toxicity included than when it was not considered. However, these findings are subject to parameter values and our results are based on parameters in Tables 1 and 2.

The World Health Organisation recommends that antiretroviral therapy be used in combination of NRTIs together with NNRTIs or PIs [55]. This study considered three drugs from NRTIs, one drug from NNRTIs and two drugs from PIs. All combinations from the sample drugs were studied. It is further recommended that atazanavir (ATV) should be used with another PI in a PI-based regimen [55], so it was combined with nelfinavir (NFV). Therapeutic effect of the drugs was modeled using a Hill function as shown in (1). In NNRTI-based regimen, Figure 3 shows that 3TC + DDI + EFV gave the minimal viral load while AZT + d4T + EFV gave the maximal viral load. In PI-based combinations, Figure 4 shows that DDI + 3TC + ATV + NFV gave the least viral load and AZT + d4T + ATV + NFV gave the most. This would suggest that, within the parameter values in Table 2, among the baseline NRTIs studied, DDI + 3TC is the most efficacious and AZT + d4T is the least.
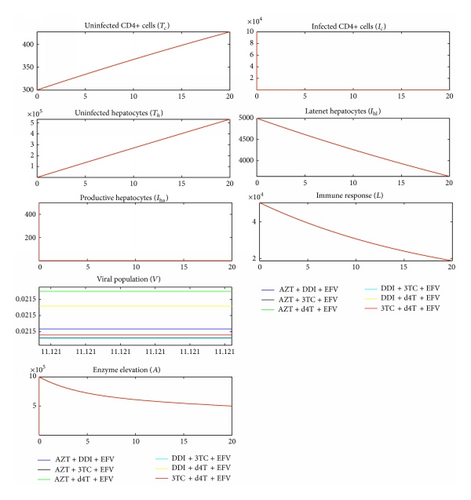
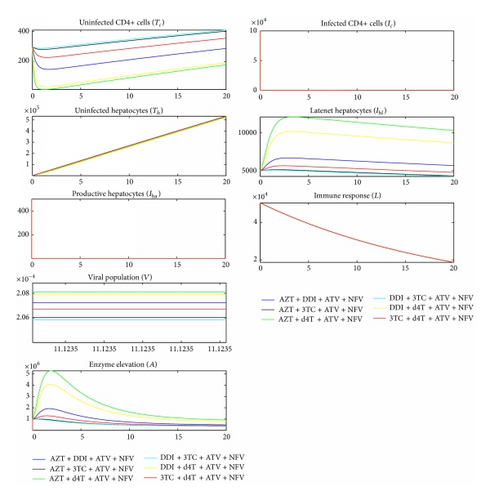
We compared Figures 2, 3, and 4 and established that the level of ALT in the blood when no medication was used was higher than the level of ALT when medication was used. This was contradicting with a number of researches [2–6], indicating that the use of ART increases the level of ALT in the blood stream.
All antiretrovirals are associated with some level of toxicity [5, 56]. During drug metabolism, the toxic nature of ART causes liver cells stress and consequently cell death. This study assumes that the lower the ALT level in the blood the less toxic the therapy. With toxic effect (2) incorporated in the model, simulation results are shown in Figure 5 for NNRTI-based regimen and Figure 6 for PI-based regimen.
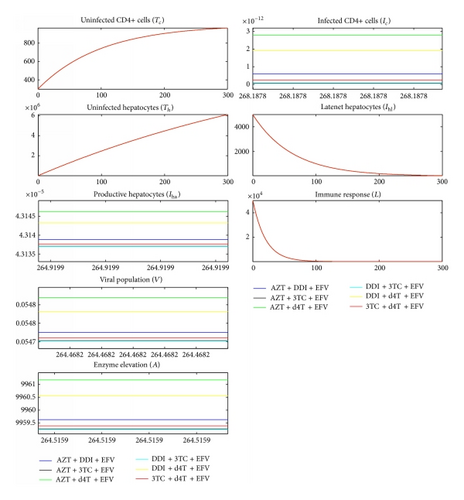
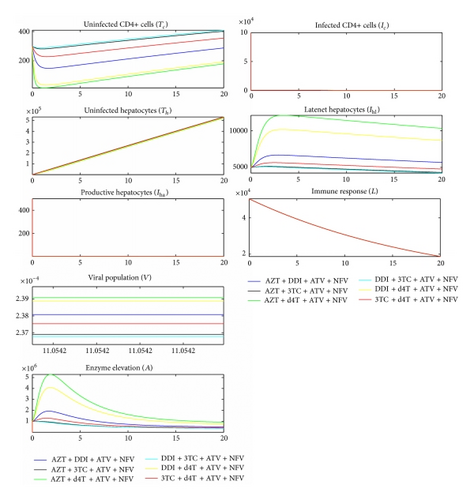
Comparing Figures 5 and 6 and their corresponding dynamics in toxic-free cases in Figures 3 and 4, respectively, it is noted that the level of ALT is highest in the former. It can also be noted that PI-based regimens are more toxic than NNRTI-based regimens among the studied drugs. In NNRT-based regimen, the least toxic combination was 3TC + DDI + EFV while AZT + d4T + EFV was the most toxic. In PI-based regimen, 3TC + DDI + ATV + NFV and AZT + d4T + ATV + NFV were the least and most toxic combinations, respectively. Combinations that contained 3TC were least toxic while combining d4T with either AZT or DDI made the combination toxic. This is consistent with a number of researches that assert that 3TC is the least toxic NRTI while d4T is the most toxic [18, 25, 48, 55, 57].
4. Discussion
Much as liver injury can occur solely due to HIV infection [7–10], liver related mortality and morbidity are being associated with the use of antiretroviral therapy, [2–6], because all antiretroviral therapy has some degree of toxicity, [15]. This study used a mathematical model with therapy efficacy as well as toxicity incorporated, to study various types of HIV drugs.
The study investigated for toxicity threshold between 0 and 1 inclusive, below which HIV infection in the liver can be controlled. Mathematical analysis showed that the critical toxicity threshold was a function of drug efficacy. The dependency of toxicity on efficacy would be due to the fact that both are dose-dependent [26, 28].
With parameter values as given in Table 2, without including the toxic effect of medication, in NNRTI-based regimen, the combination of DDI + 3TC that contained EFV gave the minimal viral load while the combination of AZT + d4T gave the maximum. In PI-based regimen, the combination of ATV + NFV + DDI + 3TC gave the least viral load while ATV + NFV + AZT + d4T gave the highest.
With toxicity incorporated and parameter values as in Table 2, in NNRTIs-based combinations, DDI + EFV + 3TC produced the minimal level of ALT, while including d4T + EFV + AZT gave maximal ALT level in the blood system. In PI-based regimen the most toxic combination was d4T + ATV + NFV + AZT while the least toxic was DDI + ATV + NFV + 3TC. Our findings are consistent with [24, 58], who recommend that d4T should not be combined with AZT because the combination is highly toxic. PI-based regimens were found to be the most toxic and at the same time the best in reducing viral load in the liver as compared to NNRTI-based regimens [24, 25, 58].
5. Conclusion
The findings regarding toxic and therapeutic effects of NRTI drugs were consistent with the already existing literature. We therefore deduce that, with the drugs studied and parameter values used, the most toxic combination gave the highest viral load in the liver and vice versa. It is important to note that there was no variability in NNRTIs and PIs as a single drug from NNRTIs and same combination from PIs was used. The same method could possibly be used with various drugs in NNRI-based and PI-based regimens to explore the most therapeutic and toxic combinations in HIV therapy.
Conflict of Interests
The authors declare that there is no conflict of interests regarding the publication of this paper.
Acknowledgments
The authors would like to acknowledge the Sida/SAREC bilateral research cooperation programme of Makerere University for funding this research. They also would like to thank the Center for International Mobility (CIMO), Finland, for funding research visits to Lappeenranta University of Technology.


