Optimum Time-Censored Constant-Stress PALTSP for the Burr Type XII Distribution Using Tampered Failure Rate Model
Abstract
This paper presents optimum design of time-censored constant-stress partially accelerated life test sampling plan (PALTSP) in which each item runs either at use or at accelerated conditions and product life follows Burr type XII. The optimal plan consists in finding out sample proportions allocated to both use and accelerated conditions by minimizing the asymptotic variance of test statistic for deciding on acceptance/rejection of the lot such that producer’s and consumer’s interests are safeguarded. The method developed has been illustrated using an example. Sensitivity analysis has also been carried out.
1. Introduction
Quality control methods are commonly used to determine the acceptability of a product with regard to its usefulness at the time it is put into the service. Reliability is related to the concept of quality of performance. Achieving desirable standards of reliability requires careful analysis in the product design phase. Analysis of data, obtained on a timely basis during product performance, keeps the design and production parameters updated and ensures that the product continues to perform in an acceptable manner. Reliability is built in through quality of design.
Acceptance sampling plans (ASPs) are commonly used to determine the acceptability of a product. If the sample data are related to the reliability of items (e.g., lifetimes or number of failures), then the corresponding ASP is called life test sampling plan or reliability acceptance sampling plan.
Many modern high reliability products are designed to operate without failure for a very long time. Life testing for these products under normal operating conditions is time consuming as it takes a lot of time to obtain reasonable failure information. Introducing ALT in life test sampling plan can be a good way to overcome such a difficulty. This has necessitated the formulation of ALTSPs. ALTSPs differ in the assumed life distribution, censoring schemes, failure monitoring method, test condition, and so forth.
Life test under accelerated environmental conditions may be fully accelerated or partially accelerated. In fully accelerated life testing all the test units are run at accelerated condition, while in partially accelerated life testing they are run at both normal and accelerated conditions. Commonly used stress loadings are constant-stress and step-stress (see Nelson [1]). Under constant-stress PALT each item is tested either at normal operating condition or at accelerated condition only. However, in step-stress PALT, a test item is first run at normal operating condition and, if it does not fail then, it is run at accelerated condition until failure occurs or the observation is censored. Accelerated test condition includes stresses in the form of temperature, voltage, pressure, vibration, cycling rate, humidity, and so forth.
Several authors have studied the problem of designing PALT under constant-stress loading. Yang [2] has indicated that constant-stress accelerated life tests are widely used to save time and money. DeGroot and Goel [3] have considered a PALT and estimated the parameters of the exponential distribution and the acceleration factor using the Bayesian approach. Bai et al. [4] have used the maximum likelihood method to estimate the scale parameter and the acceleration factor for the log normally distributed lifetime, using type I censoring data. Ismail [5] has used maximum likelihood and Bayesian methods for estimating the acceleration factor and the parameters of Pareto distribution of the second kind. Also, Bhattacharyya and Soejoeti [6] have estimated the parameters of the Weibull distribution and acceleration factor using maximum likelihood method. Bai and Chung [7] have considered optimal designs for both constant and step PALTs under type I censoring. Abdel-Hamid [8] has used the constant-stress PALT and estimated the parameters of the Burr type XII distribution and the acceleration factor under progressive type II censoring
However, no work seems to exist in the literature with PALT incorporated in acceptance sampling plan to facilitate formulation of decision rules for accepting or rejecting a lot of high reliability items satisfying producer’s and consumer’s requirements. In this paper optimum time-censored constant-stress PALT sampling plans have been designed using hazard acceleration and the Burr type XII life distribution. Single sample acceptance sampling plans by variables are used, and acceptance/rejection decision of a lot is based on Schneider’s [9] approach to k-method wherein sample mean and standard deviation are replaced by MLEs of location parameter and scale parameter of log life distribution, respectively. The asymptotic variance of the test statistic so obtained is used for deciding on lot disposition. The optimal plan consists in finding out sample proportions allocated to both use and accelerated conditions for the constant PALT by minimizing the asymptotic variance of test statistic for deciding on acceptance/rejection of the lot such that producer’s and consumer’s interests are safeguarded.
2. Model Assumptions and Test Procedure
2.1. Assumptions
- (a)
The lifetime of an item tested either at normal operating condition or at accelerated conditions follows Burr type XII distribution.
- (b)
The lifetimes of test units are independent and identically distributed random variables.
- (c)
Tampered failure rate (TFR) model is assumed (Bhattacharyya and Soejoeti [6]).
- (d)
The log-lifetimes Ti, i = 1,2, …, nϕ1, of items allocated to normal operating condition and the log-lifetimes T1j, j = 1,2, …, nϕ2, and T2j, j = 1,2, …, nϕ3, of items allocated to accelerated conditions are mutually independent.
2.2. Test Procedure
- (a)
The test is conducted with three test chambers, namely, one in which items are tested at normal operating condition, the second in which acceleration factor, A1, is applied to the test items, and the third in which acceleration factor, A2, is applied to the test items. Out of total “n” items, “nϕ1” items randomly chosen are allocated to normal operating condition, “nϕ2” items are allocated to first accelerated condition, A1, and the remaining “nϕ3” items are allocated to second accelerated condition, A2, ϕ1 + ϕ2 + ϕ3 = 1.
- (b)
The test is continued until
- (i)
failure of all test items, or
- (ii)
a prescribed censoring time η
- (i)
-
whichever occurs earlier, and the test condition should remain the same.
3. Burr Type XII Life Distribution
The Burr type XII distribution has a nonmonotone hazard function, which can accommodate many shapes of hazard function.
4. Tampered Failure Rate Model
Unlike fully accelerated life testing wherein a regression structure on the stress variable (e.g., temperature and voltage) is specified, the acceleration factor Ai, i = 1,2, …, m, is assumed to be a parameter of the model in PALT.
4.1. Life Distribution under TFR Model
5. Lot Acceptance Sampling Procedure
- (i)
Samples of n items are randomly selected from the lot and are tested according to the above test procedure.
- (ii)
Maximum likelihood estimators (MLEs) and , respectively, of location parameter μ and scale parameter σ at normal operating condition, respectively, of Burr type XII distribution are obtained from the test data.
- (iii)
Schneider’s [9] approach to k-method is used wherein sample mean and standard deviation are replaced by MLEs of location parameter and scale parameter of log life distribution, respectively. In this paper k1 instead of k has been used as acceptability constant. The value of test statistic is compared with L′; the lot is accepted if T′ ≥ L′ and rejected otherwise. The sample size n and acceptability constant k1 determined using variance optimality criterion subject to the constraints that the lots with fraction nonconforming are accepted with probability of at least and lots with are rejected with probability of at least .
6. Model Formulation
Maximum likelihood method has been used to estimate the model parameters α, c, and acceleration factors, A1 and A2, from the test data.
6.1. Likelihood Function
6.2. Fisher Information Matrix
6.3. Asymptotic Variance of Test Statistic T′
7. OC Curve
See Schneider [9] for reference.
8. Formulation of an Optimization Problem
9. A Numerical Example
In this section, a hypothetical constant-stress PALTSP experiment is considered to illustrate the methods described in this paper.
9.1. OC Curve
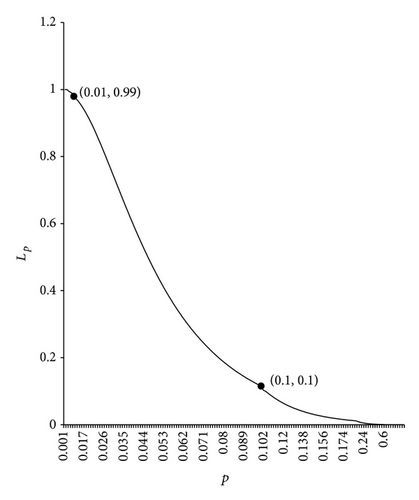
Choose two points and on the OC curve as (0.01, 0.99) and (0.10, 0.10), respectively.
9.2. Optimal Lot Acceptability Constant
Compute the acceptability constant k1, using (19).
Since , , , and , we have k1 = ((1.28155(−5.98519))−((−3.62346)(−2.32635)))/((−2.32635)−(1.28155)) = 4.46236.
9.3. Optimal Plan
| A1 | n* | |||
|---|---|---|---|---|
| 1.5 | 0.29387 | 0.33916 | 0.36697 | 37.2889 ≈ 37 |
| 1.6 | 0.23162 | 0.23576 | 0.53262 | 36.6683 ≈ 37 |
| 1.7 | 0.19098 | 0.21097 | 0.59805 | 35.8638 ≈ 36 |
| 1.8 | 0.1584 | 0.20729 | 0.63431 | 35.1254 ≈ 35 |
| 1.9 | 0.13196 | 0.21318 | 0.65486 | 34.5078 ≈ 35 |
| 2 | 0.11085 | 0.22402 | 0.66513 | 34.0173 ≈ 34 |
9.4. Optimal Acceptance Sampling Plan
Let us consider the lower specification limit of L as L′ (lnL) indicating that items with lifetime shorter than lnL are nonconforming. For given lower specification limit L′, lot is accepted if , lot is accepted and otherwise rejected.
Figure 1 depicts the OC curve obtained from uP, V, n* and the two points and .
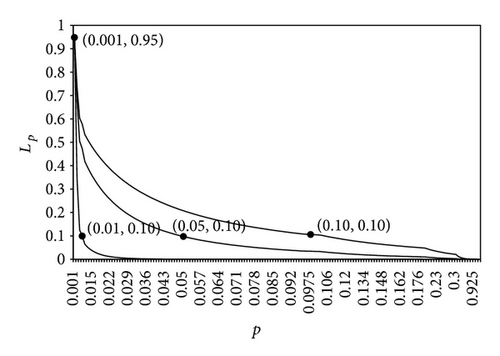
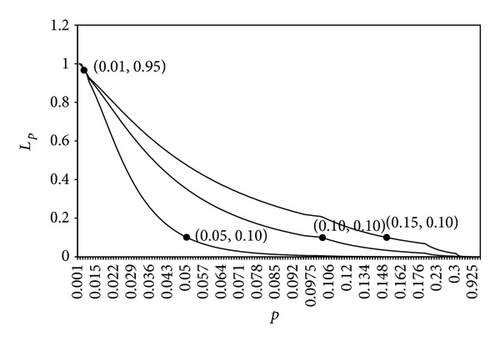
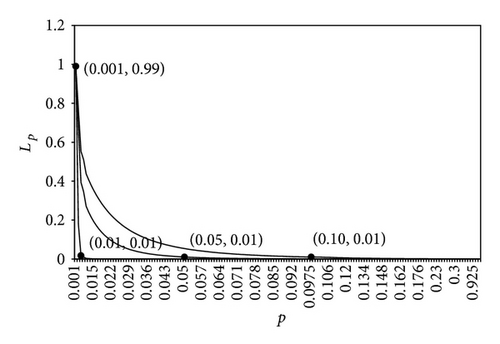
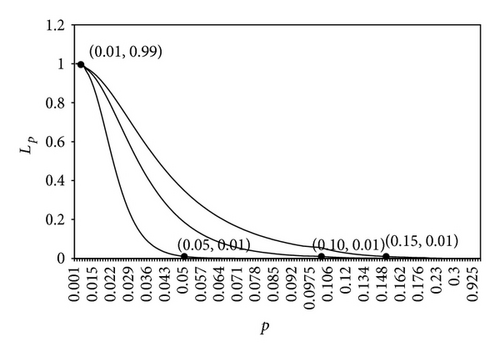
Tables 2 and 3 present optimum sampling plan for various values of and when ( and (0.99, 0.01). It is observed that for given as increases optimal “n*” decreases, optimal increases, and optimal and optimal decrease. Using the data in Table 2, Figures 2 and 3 depict the OC curve obtained from the two points as (0.001, 0.95), (0.01, 0.95) and as (0.01, 0.10), (0.05, 0.10), (0.10, 0.10); (0.05, 0.10), (0.01, 0.10), (0.15, 0.10), respectively. In a similar manner, data in Table 3 has been used in plotting OC curve in Figures 4 and 5 by taking as 0.99 and as 0.01.
| , | ||||||||
|---|---|---|---|---|---|---|---|---|
| k1 | k2 | V* | n* | |||||
| 0.001 | 0.01 | 6.99603 | 1.60734 | 3.27656 | 0.16048 | 0.40322 | 0.43630 | 65 |
| 0.05 | 6.07697 | 0.55073 | 2.45800 | 0.19573 | 0.38629 | 0.41798 | 17 | |
| 0.1 | 5.66856 | 0.39268 | 2.13194 | 0.21515 | 0.37697 | 0.40789 | 10 | |
| 0.01 | 0.05 | 5.06613 | 3.20311 | 1.69332 | 0.24966 | 0.36039 | 0.38995 | 66 |
| 0.1 | 4.65773 | 1.53536 | 1.42466 | 0.27827 | 0.34665 | 0.37508 | 27 | |
| 0.15 | 4.41008 | 1.09052 | 1.27305 | 0.29829 | 0.33703 | 0.36468 | 17 | |
| , | ||||||||
|---|---|---|---|---|---|---|---|---|
| k1 | k2 | V* | n* | |||||
| 0.001 | 0.01 | 7.13931 | 4.06301 | 3.41476 | 0.15582 | 0.40546 | 0.43872 | 170 |
| 0.05 | 6.32175 | 1.39212 | 2.66454 | 0.18532 | 0.39129 | 0.42339 | 45 | |
| 0.1 | 5.95844 | 0.99262 | 1.47615 | 0.27219 | 0.34957 | 0.37824 | 18 | |
| 0.01 | 0.05 | 5.16763 | 8.09678 | 1.76368 | 0.24326 | 0.36346 | 0.39328 | 175 |
| 0.1 | 4.80432 | 3.88106 | 1.51843 | 0.26743 | 0.35186 | 0.38072 | 72 | |
| 0.15 | 4.58403 | 2.75661 | 1.37865 | 0.28400 | 0.34390 | 0.37211 | 47 | |
10. Sensitivity Analysis
To formulate an optimum sampling plan, the information about acceleration factors A1 and parameters of the model α and c is needed as incorrect choice of these results in poor estimates of the parameters. The effects of incorrect preestimates of A1, A2, α, and c in terms of the relative increase in asymptotic variance of test statistic have been studied. The percentage deviations (PD) of the resulting optimal settings are measured by PD = (|V** − V* | /V*) × 100, where V* is the setting obtained with the given design parameters, and V** is the one obtained when the parameter is misspecified. Tables 4 and 5 show that irrespective of whether the incorrect variance is smaller or larger than the true variance, the proposed optimum plan is robust since the percentage deviation in variance is small.
| % change | Incorrect sample proportions | Incorrect variance | % deviation | |||
|---|---|---|---|---|---|---|
| α | V** | PD | ||||
| 1% | 0.909 | 0.36852 | 0.50889 | 0.12260 | 1.29050 | 1.06182 |
| −1% | 0.918 | 0.25565 | 0.28443 | 0.45992 | 1.30919 | 0.37156 |
| 2% | 0.927 | 0.37624 | 0.52376 | 0.10000 | 1.26266 | 3.19600 |
| −2% | 0.936 | 0.22676 | 0.25874 | 0.51449 | 1.31231 | 0.61030 |
| 3% | 0.945 | 0.37750 | 0.52250 | 0.10000 | 1.23615 | 5.22824 |
| −3% | 0.891 | 0.20252 | 0.24549 | 0.55199 | 1.31570 | 0.87059 |
| % change | Incorrect sample proportions | Incorrect variance | % deviation | |||
|---|---|---|---|---|---|---|
| c | V** | PD | ||||
| 1% | 3.535 | 0.23483 | 0.26473 | 0.50044 | 1.28556 | 1.44015 |
| −1% | 3.570 | 0.37585 | 0.52415 | 0.10000 | 1.29585 | 0.65107 |
| 2% | 3.605 | 0.19437 | 0.24250 | 0.56313 | 1.26608 | 2.93382 |
| −2% | 3.640 | 0.37800 | 0.52200 | 0.10000 | 1.27416 | 2.31434 |
| 3% | 3.675 | 0.16283 | 0.23735 | 0.59982 | 1.25043 | 4.13323 |
| −3% | 3.465 | 0.37927 | 0.52073 | 0.10000 | 1.25527 | 3.76273 |
11. Conclusion
In this paper we have formulated an optimum time-censored constant-stress PALTSP for the Burr type XII life distribution using hazard acceleration. Single sampling plan by variables has been used. The acceptance/rejection decision of the lot involves k-method in which Schneider’s [9] approach has been used with sample mean replaced by MLE of location parameter and standard deviation replaced by MLE of scale parameter of the log-lifetime distribution with lower specification limit specified. The optimum plan consists in finding optimum allocation at normal operating condition and accelerated conditions by minimizing the variance of the test statistic meant for deciding on lot acceptability. The sensitivity analysis has been carried out and it has been found that if the misspecified values of the parameters are not too far from the true values, the optimum plan is robust.
Acronyms
-
- ALT:
-
- Accelerated life test
-
- ALTSP:
-
- Accelerated life test sampling plan
-
- PALT:
-
- Partially accelerated life test
-
- PALTSP:
-
- Partially accelerated life test sampling plan
-
- Asvar:
-
- Asymptotic variance
-
- Ascov:
-
- Asymptotic covariance
-
- cdf:
-
- Cumulative distribution function
-
- pdf:
-
- Probability density function
-
- MLE:
-
- Maximum likelihood estimate.
Notations
-
- A1, A2:
-
- Acceleration factors (A2 > A1 > 1)
-
- :
-
- , i = 1,2
-
- ϕ1, ϕ2, ϕ3:
-
- Proportion of sample allocated to normal operating condition, accelerated condition , and accelerated condition , respectively, where
-
- :
-
- Optimum proportion of sample allocated to normal operating condition, accelerated condition A1, and accelerated condition A2, respectively, where
-
- n:
-
- Total number of test items in a PALTSP
-
- nϕi:
-
- Items allocated to normal operating condition, accelerated condition A1, and accelerated condition A2, respectively, i = 1,2, 3
-
- :
-
- Number of items failed at normal operating condition, accelerated condition A1, and accelerated condition , respectively
-
- :
-
- Number of censored items at normal operating condition, accelerated condition A1, and accelerated condition A2, respectively
-
- Y, X1 & X2:
-
- Lifetime of an item at normal operating condition, accelerated condition A1, and accelerated condition A2, respectively
-
- T:
-
- lnY
-
- ti:
-
- Observed log-lifetime of ith item tested at normal operating condition
-
- t1j:
-
- Observed log-lifetime of jth item tested at accelerated condition A1
-
- t2j:
-
- Observed log-lifetime of jth item tested at accelerated condition A2
-
- η:
-
- Censoring time
-
- η′:
-
- Log-censoring time
-
- α:
-
- Scale parameter (α > 0)
-
- c, k:
-
- Shape parameter (c > 0, k > 0)
-
- F(·):
-
- Cumulative distribution function
-
- f1(·):
-
- Probability density function at normal operating condition
-
- R1(·):
-
- Reliability function at normal operating condition
-
- h1(·):
-
- Hazard (failure) rate at normal operating condition
-
- fi(·):
-
- Probability density function at accelerated conditions Ai, i = 1,2
-
- Ri(·):
-
- Reliability function at accelerated conditions Ai, i = 1,2
-
- hi(·):
-
- Hazard (failure) rate at accelerated conditions Ai, i = 1,2
-
- ∧:
-
- A maximum likelihood estimate
-
- :
-
- Indicator functions: ; and .
-
- :
-
- Ordered log-lifetimes times at normal operating condition
-
- :
-
- Ordered log-lifetimes at accelerated condition A1
-
- :
-
- Ordered log-lifetimes at accelerated condition A2.
Conflict of Interests
The authors declare that there is no conflict of interests regarding the publication of this paper.
Acknowledgments
The authors are grateful to the referees for their valuable comments. This research work is supported by R&D Grant received from the University of Delhi, Delhi, India.
Appendices
A.
B.
Using delta method, V in (20) has been obtained.


