Context-Based Separation of Cell Clusters for the Automatic Biocompatibility Testing of Implant Materials
Abstract
This paper presents a new method to separate cells on microscopic surfaces joined together in cell clusters into individual cells. Important features of this method are that the remaining object geometry is preserved and few contour points are required for finding joints between neighboring cells. There are alternative methods such as morphological operations or the watershed transformation based on the inverse distance transformation but they have certain disadvantages compared to the method presented in this paper. The discussed method contains knowledge-based components in form of a decision function and exchangeable rules to avoid unwanted separations.
1. Introduction
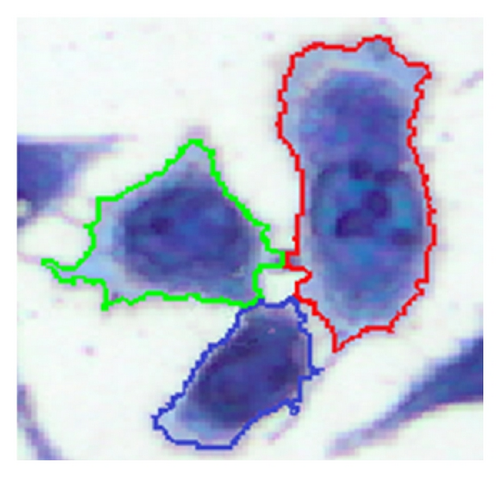
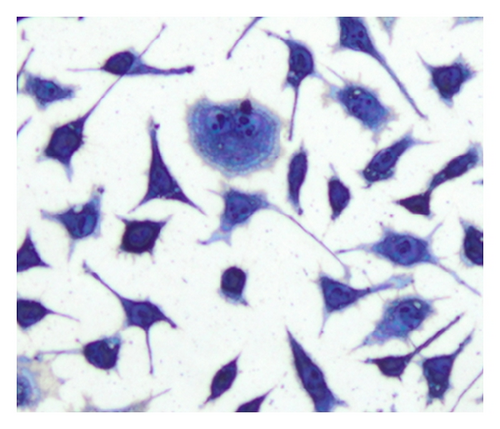
In the process of testing implant materials for biocompatibility, it is important to evaluate whether a material is suitable for use in human bodies. An important aspect of biocompatibility is the determination of the exact number of cells which are in contact with the surface of the material being tested. For the specimen preparation process, a suspension with a defined cell concentration reacts for a certain time with the substrate under test and allows the cells to settle on the contact surface. Afterwards, the cells are stained using the May-Grünwald suspension [1] to be easily identifiable amongst each other. Microscopic images (Figure 1) are used to evaluate the results. A major challenge is the separation of single cells in a cluster due to their very variable morphology. The examination of many samples shows that L929 cells often exhibit cell clusters at various positions. This paper is based on providing a method of identifying individual cells within these cell clusters.
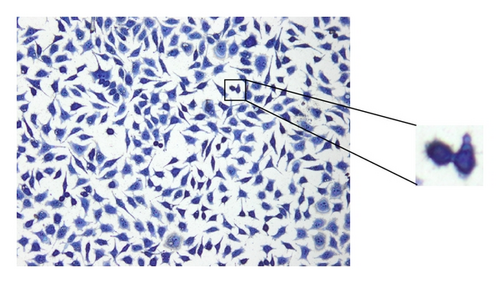
Several papers deal with different image processing methods for cell segmentation [2–7]. Depending on the image quality or the dyeing process, different segmentation methods may be the appropriate choice. If, for example, a noisy image has to be analyzed, the use of active contours could be advisable [3, 5–7].
The separation of connected cells is still a great challenge. Several papers provide different approaches to separate cells of a specific type [8–11]. Due to the often simple morphology of the analyzed cell types, a separation of clusters with simple rules is possible.
An iterative erosion method may create a separation of cells or objects at joining points between cells. After each iteration, it has to be checked whether separated objects have been created. The algorithm is not able to separate the cells without altering the cell contours. Therefore, a reconstruction of the cell area is required. A big disadvantage of this method is that it also removes or separates cell extensions, which is not acceptable in our case. An improved method for separating cells is described in [12] that leaves the cell contour unchanged. This method is known as opening by reconstruction. Compared to the method presented in the next section, this approach partially results in unwanted separation processes and requires about five times more computing time. If the local joining regions are considered to be objects which are being traced, the use of a hit-and-miss transformation [13] or a model-based method [14] is potential solution. But the morphological variation of the cells also leads to a variation of the joining shapes. Thus, a method is required which considers these circumstances.
Another common procedure to separate connected cells is the watershed transformation based on the inverse distance transformation [15]. The method works well for cell types with a simple morphology, for example, peripheral blood and bone marrow samples. For biocompatibility testing, often cells of type L929 are used (Figure 1) but they are characterized by a strong varying morphology. Some cells are also creating cell extensions which are not allowed to be separated. These aspects have a negative impact on the segmentation result using the watershed transformation (Figure 12(e)).
The method for the separation of connected cells described in [16] turns out to be suitable. This algorithm first detects the nuclei with the Histogram Backprojection method [17]; then the shortest paths between the nuclei are calculated by means of the A* algorithm [18]. The contact points of connected cells usually have local joints between cells, which are determined by calculating the so-called dominant contour points (DCPs) [19]. With the help of these DCPs, the separation of the cells can be carried out. The disadvantage of the method described in [16] is the high computing time for the separation process due to the high complexity of the algorithm (Table 3). A further disadvantage of the above-mentioned algorithm is the inability to separate cells which are in a biological cell division process (Figure 1) since they contain no visible nucleus regions. The method presented in this paper increases the separation performance and reduces significantly the computing time for the process in [16]. The method is not restricted to cell structures; it can also be applied to general objects which have to be separated.
2. Materials and Methods
2.1. Cell Segmentation
The images were created by the Olympus XC10 camera, which is installed on an Olympus Bx51 M microscope with 100x magnification. The size of the images is 1376 × 1032 pixel. The segmentation of the cell areas is carried out by a standard threshold procedure for all three color channels. The thresholds depend on the used staining method. In the case of the present May-Grünwald staining, the thresholds TR = 128, TG = 150, and TB = 150 are used. To determine suitable thresholds, an expert draws the contours of 20 different cells in the image. The same cells are also automatically segmented by using the default threshold values TR = TG = TB = 128. With the help of the Jaccard coefficient, the similarity of the automatically generated cell areas compared to the reference areas can be measured. The automatic cell segmentation with subsequent calculation of the Jaccard coefficient is now iteratively performed with different threshold values. Finally the parameter set with the maximum Jaccard coefficient is used for cell segmentation. Due to a reliable staining process, the chosen parameters are robust for different images of one or more test samples.

Figure 2 shows the process of the presented method to segment the cell regions (Section 2.1) and then separating the clusters with help of the context-based separation method (Section 2.2).
2.2. Context-Based Separation
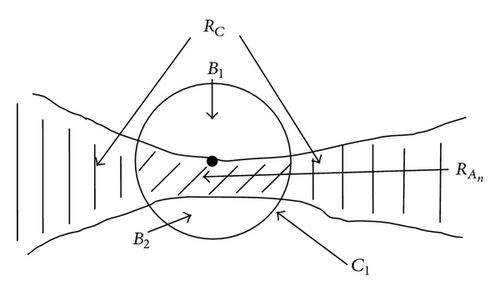
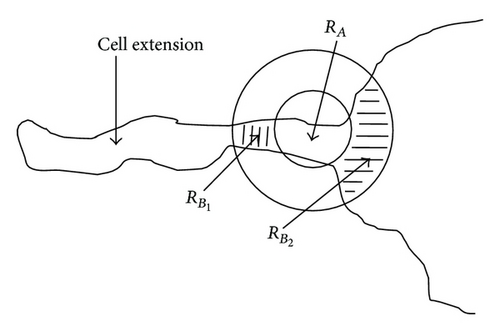
The new method presented in this paper is called the context-based separation (CBS). This method performs splitting operations on cells or other objects. This splitting is restricted to narrow joints between cells or objects. In an image m clusters are contained. Each cluster consists of several cells which have to be separated for further analysis. The approach of this method is shown by one cluster RC. For purposes of clarity, RC is defined as a representative of a cluster. Therefore, the cluster index can be ignored. This method is performed only at narrow joints with n = 1, 2, … , x (Figure 5) where a separation process is carried out. For this purpose, the contour of the object RC is sampled with a circular structural element C1 with radius r1 (Figure 3).
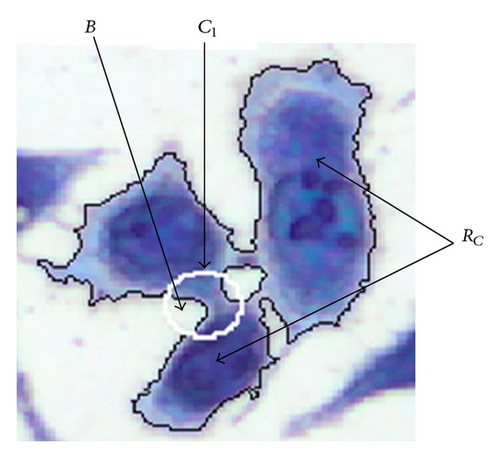
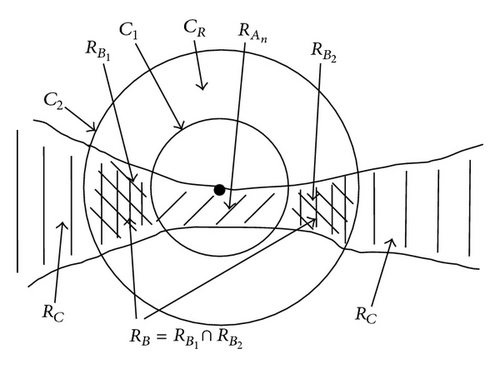
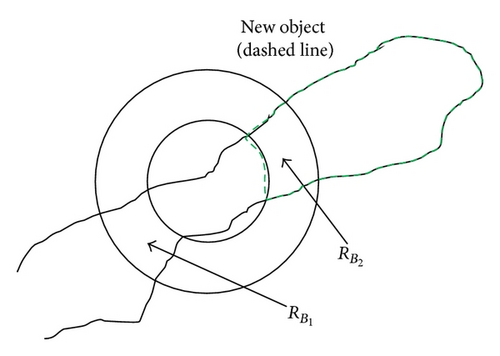
For each nth (step width) contour point it is checked whether the background area B enclosed by C1 consists of two separated subsets B1 and B2. B1 and B2 must be separated by the cell area enclosed by C1 with (Figure 4). This is a necessary condition for a local joining of the object. A join is characterized by a dilatation at the ends. This is determined by creating a circular mask C2 with radius r2 = a•r1 which is generated concentrically around C1. The parameter a is adjusted to this cell type. In our case a = 2 is suitable. If values smaller than 1.5 are chosen, not all local joints are found. In contrast, if the value of a is set higher than 2.75, the circular mask gets much bigger than most of the local joints and the failure rate increases (Table 1).
| a = 1.25 | a = 1.5 | a = 2.0 | a = 2.5 | a = 3.0 | |
|---|---|---|---|---|---|
| Relative deviation | 8.6% | 4.6% | 2.7% | 3.1% | 5.4% |
| x = 1.25 | x = 1.5 | x = 2.0 | x = 2.5 | x = 3.0 | |
|---|---|---|---|---|---|
| Relative deviation | 5.8% | 2.7% | 2.9% | 3.8% | 7.4% |
| y = 1.5 | y = 2 | y = 3 | y = 4 | y = 5 | |
|---|---|---|---|---|---|
| Relative deviation | 26.7% | 5.3% | 2.7% | 4.2% | 8.1% |
| Schema | Description | |
|---|---|---|
| Case 1 |  |
|
| Case 2 |  |
There are two separated cell regions within C1. For further processing only the cell area is selected which contains the center of C1 in its point set. As a result of this processing, this case is case type 3 from now on. |
| Case 3 |  |
There is a separated cell area within CR which does not enter the region of C1. This cell region will be ignored for further processing. As a result the case is type 1 from this point forward. |
| Case 4 |  |
CR contains a separated cell area, which is connected to , but not with other object areas. For all three subsets contained in RB, it is checked whether f(x, y) returns true and the conditions 1 and 2 are fulfilled. If at least two subsets remain in RB which fulfill the above-mentioned criteria; the separation takes place at this point. All subsets in RB, which do not satisfy the above-mentioned criteria, will be added as elements in RBD so that the cell regions separated in error can be reunited with the neighboring object. |
| Case 5 |  |
Compared to case 4, there are one or more separate cell areas located within CR, which are connected to and other parts of RC in this case. It is determined for all subsets in RB whether f(x, y) returns true and conditions 1 and 2 are met. If at least two subsets in RB remain which fulfill the above-mentioned criteria, the separation takes place at this point. All subsets in RB which do not satisfy the above-mentioned criteria are stored as elements in RBD similarly to Case 4 so that the cell regions separated in error can be reunited with the neighboring object. |
Applying the region labeling after the separation process of the cluster shown in Figure 6 results in 3 cells , , and . In the context of the 3 separation processes , , and are subtracted from RC and the results are reassigned to RC afterwards. The object regions stored in RA_Ges are subsets of the original object region RC_Copy and have to be assigned to the neighboring regions. For this purpose, each region is separated into two regions using erosion. Each of the two separated regions is then assigned to the closest neighboring cell. Afterwards the assigned regions are enlarged to their original sizes using dilation. The dilation process stops if the two regions collide.
There may be situations in which object separations do not make sense, for example, at contact points between cell extensions and cell body, even though f1(x) delivers true. For this reason, the decision function f1(x) has to be expanded for a cell separation. The experience shows that a division should be avoided if one of the two regions or (Figure 7) is y-times greater than the other region. As in the earlier cases, y is a parameter adjusted to the situation. In our case y = 3 is chosen. If the parameter y is set too high, then cell extensions are partially separated from the cell. For the case that the value of y is set too small, the algorithm partially prevents the separation of connected cells (Table 3).
Condition 1. All object regions in Rn, generated by the separation process, must have a minimum size Amin; otherwise they are not separated.
Condition 2. The compactness of all object regions in Rn must be K ≤ a up to a maximum object size Amax, with a = 10 in our case.
Figure 9 shows a simple flow-diagram of the CBS.
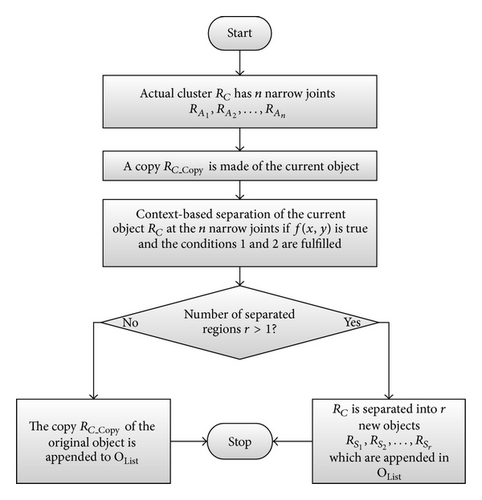
The agglomerate RC has n different narrowing joints . These are processed sequentially in a loop with the CBS, shown with a thick border in Figure 9. The separation process of RC results in r new object regions from RC, which are stored as elements of OList. The mentioned procedure is valid for every segmented cluster. The detailed CBS algorithm is presented in the flow-diagram in Figure 10.
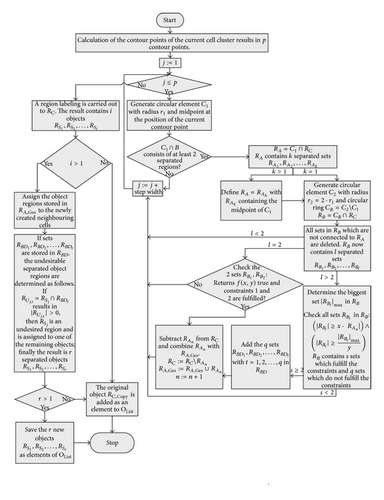
Figure 10 shows a decision-based structure of the algorithm, with which the possible geometric variations of the objects are processed.
If contain at least two sets, which fulfill the previously mentioned conditions, the separation process is initiated. If q sets exist in which do not fulfill the conditions, they are added as elements in RBD, . After the object separation, the undesirably separated object regions are determined with the help of the elements in RBD. A separated object region with j = 1, 2, …, i is considered to be undesirable if (with t = 1,2, …, q) results in . An undesired object region is assigned randomly to one of the remaining objects. In this way, an object separation can be done even in cases where several object regions come together but not all of them must be separated (Table 4, case 5). The possible cases that can occur in context of a separation process are listed in Table 4. Figure 11 is used as a legend for Table 4.
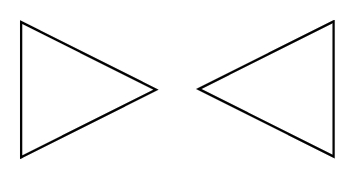
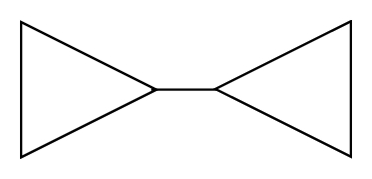
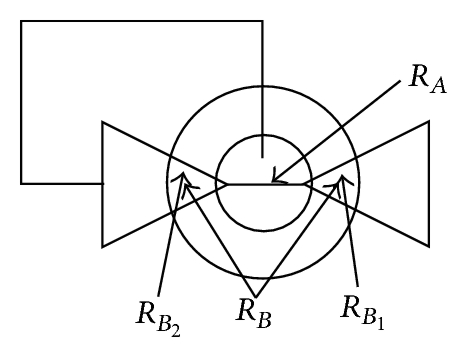
The number of cell areas within C1 and CR can vary but this was not considered in Table 4 for reasons of clarity. Mixed forms of the illustrated cases are also possible, although this would not cause a problem for the algorithm.
3. Results and Discussion
In the context of biocompatibility testing of implant materials, the determination of the proliferation rate (cell count) and the evaluation of the cell morphology are important features. Therefore, an accurate determination of the cell borders within the clusters is necessary. The cytotoxicity of an implant material is classified in 4 levels depending on the proliferation rate (Table 5).
| Cytotoxicity level | Proliferation rate (%) | Interpretation |
|---|---|---|
| 0 | 100–81 | Not cytotoxic |
| 1 | 80–71 | Low cytotoxicity |
| 2 | 70–61 | Moderate cytotoxicity |
| 3 | 60–0 | Strong cytotoxicity |
Table 5 shows that the minimum classification interval of the proliferation rate is 10% (Low cytotoxicity (80%–71%) and Moderate cytotoxicity (70%–61%)). If the automated cell count was to deviate by more than 10% from the reference cell count, it would not be possible to reliably classify the cytotoxicity level of implant materials. Therefore, the automated counting of cells in the field of biocompatibility is only feasible if a counting accuracy of more than 95% is attainable.
To evaluate the efficiency of the presented method, first the number of cells for 10 samples (2409 cells) of the cell type L929 on the substrates steel as well as titanium is determined and compared to the number of cells specified by an expert (reference cell count). The part of L929 cells which are connected to clusters is in average 23.3%. Table 6 shows the cell counting for the method presented in this paper compared to two other separation methods [15, 20]. The algorithm in [20] is old but cell separation with the help of morphological operations is still a common procedure. The method introduced in [15] is based on the watershed transformation applied to the inverse distance transformation of the segmented cell areas. This is a state-of-the-art procedure to separate connected nuclei or cells in microscopic images.
| Sample | ACC | FP | FN | PC | REF | RFP (%) | RFP (%) | ERR (%) |
|---|---|---|---|---|---|---|---|---|
| CBS Algorithm | ||||||||
| 1 | 234 | 4 | 2 | 230 | 232 | 1.7 | 0.9 | 0.9 |
| 2 | 350 | 3 | 22 | 347 | 369 | 0.8 | 6.0 | 5.1 |
| 3 | 240 | 2 | 12 | 238 | 250 | 0.8 | 4.8 | 4.0 |
| 4 | 193 | 3 | 9 | 190 | 199 | 1.5 | 4.5 | 3.0 |
| 5 | 232 | 4 | 12 | 228 | 240 | 1.7 | 5.0 | 3.3 |
| 6 | 205 | 9 | 3 | 196 | 199 | 4.5 | 1.5 | 3.0 |
| 7 | 217 | 3 | 1 | 214 | 215 | 1.4 | 0.5 | 0.9 |
| 8 | 208 | 5 | 7 | 203 | 210 | 2.4 | 3.3 | 1.0 |
| 9 | 220 | 6 | 1 | 214 | 215 | 2.8 | 0.5 | 2.3 |
| 10 | 270 | 6 | 16 | 264 | 280 | 2.1 | 5.7 | 3.6 |
| Ø Err | 2.0 | 3.3 | 2.7 | |||||
| Method described in [20] | ||||||||
| 1 | 255 | 24 | 1 | 231 | 232 | 10.3 | 0.4 | 9.9 |
| 2 | 380 | 16 | 5 | 364 | 369 | 4.3 | 1.4 | 3.0 |
| 3 | 269 | 21 | 2 | 248 | 250 | 8.4 | 0.8 | 7.6 |
| 4 | 223 | 25 | 1 | 198 | 199 | 12.6 | 0.5 | 12.1 |
| 5 | 260 | 23 | 3 | 237 | 240 | 9.6 | 1.3 | 8.3 |
| 6 | 222 | 25 | 2 | 197 | 199 | 12.6 | 1.0 | 11.6 |
| 7 | 247 | 36 | 4 | 211 | 215 | 16.7 | 1.9 | 14.9 |
| 8 | 231 | 23 | 2 | 208 | 210 | 11.0 | 1.0 | 10.0 |
| 9 | 236 | 22 | 1 | 214 | 215 | 10.2 | 0.5 | 9.8 |
| 10 | 296 | 20 | 4 | 276 | 280 | 7.1 | 1.4 | 5.7 |
| Ø Err | 10.3 | 1.0 | 9.3 | |||||
| Method described in [15] | ||||||||
| 1 | 245 | 14 | 1 | 231 | 232 | 6.0 | 0.4 | 5.6 |
| 2 | 391 | 25 | 3 | 366 | 369 | 6.8 | 0.8 | 6.0 |
| 3 | 258 | 8 | 0 | 250 | 250 | 3.2 | 0.0 | 3.2 |
| 4 | 211 | 14 | 2 | 197 | 199 | 7.0 | 1.0 | 6.0 |
| 5 | 252 | 13 | 1 | 239 | 240 | 5.4 | 0.4 | 5.0 |
| 6 | 208 | 10 | 1 | 198 | 199 | 5.0 | 0.5 | 4.5 |
| 7 | 226 | 13 | 2 | 213 | 215 | 6.0 | 0.9 | 5.1 |
| 8 | 219 | 10 | 1 | 209 | 210 | 4.8 | 0.5 | 4.3 |
| 9 | 230 | 16 | 1 | 214 | 215 | 7.4 | 0.5 | 7.0 |
| 10 | 292 | 14 | 2 | 278 | 280 | 5.0 | 0.7 | 4.3 |
| Ø Err | 5.7 | 0.6 | 5.1 | |||||
- ACC: automatic cell count; FP: false positive detection; FN: false negative (missed) detection; PC: positive correct detection (ACC − FP); REF: reference cell count; RFP: relative false positive detection (FP/REF * 100); RFN: relative false negative detection (FN/REF * 100); ERR: relative error (((REF − ACC)/REF) * 100).
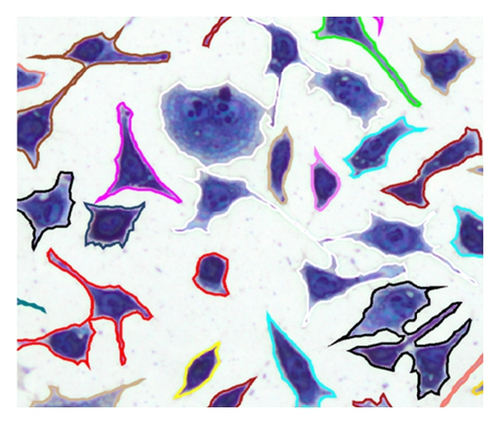
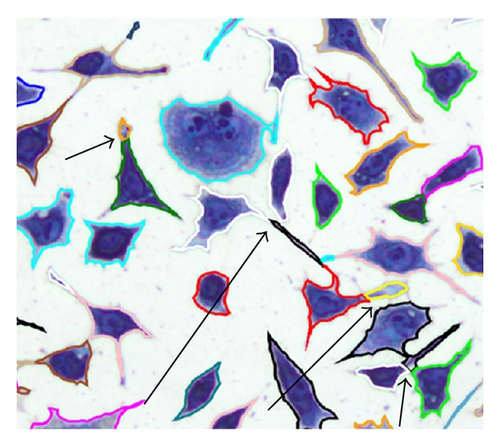
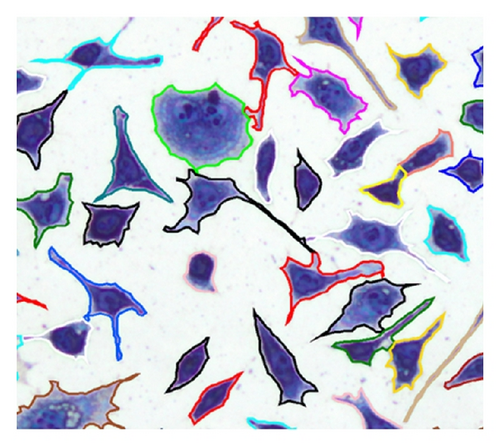
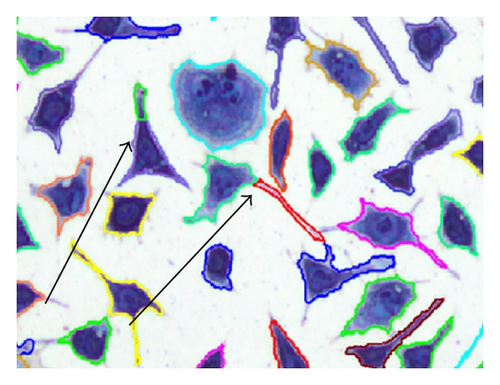
Separating the cells with the CBS method results in a mean cell count error of 2.7%. In comparison, using the methods described in [15, 20], an average cell count error of 9.3% and 5.1% results. Table 6 shows that the algorithms described in [15, 20] have a high false positive detection rate (10.3% and 5.7%). The main reason is that that these methods are not able to detect the cell extensions as part of the cell and therefore separate them incorrectly. On the other hand, these methods provide a very small false negative detection rate (1.0% and 0.6%) yet due to the high false positive detection rate the overall error is higher in comparison to the CBS algorithm. Thus, the method described in this paper is more suitable for the determination of the L929 cell number as the methods described in [15, 20]. Figure 12 shows the cell separation results for the investigated methods.
The used algorithms described in [15, 20] lead to a partial splitting of one cell or cell extensions indicated by the arrows in Figures 12(c) and 12(e). However, these cell extensions are part of the cell and thus they are not allowed to be separated from the rest of the cell area.
As mentioned the CBS can be used independently of other procedures or it can be combined with other methods, for example, the algorithm described in [16], to decrease the calculation time (Table 7) and to improve the cell count quality.
| Sample | Calculation time Algorithm excluding CBS (s) | Calculation time Algorithm including CBS (s) | Speed-Up |
|---|---|---|---|
| 1 | 12.4 | 1.9 | 6.53 |
| 2 | 5.8 | 2.1 | 2.76 |
| 3 | 4.4 | 0.9 | 4.89 |
| 4 | 11.8 | 1.9 | 6.21 |
| 5 | 2.1 | 0.6 | 3.50 |
| 6 | 4.1 | 1.1 | 3.73 |
| 7 | 1.1 | 0.4 | 2.75 |
| 8 | 2.0 | 0.5 | 4.00 |
| 9 | 6.2 | 0.5 | 12.40 |
| 10 | 15.1 | 0.4 | 37.75 |
| Ø Speed-up | 8.45 |
By using the CBS a speed-up factor of about 8 may be achieved, compared to the cell count algorithm without the use of CBS (Table 7). The calculation time is varying since the number of clusters is changing from image to image.
In comparison, the method described in [9] results in 3.9% deviation from the reference cell count for leukocyte cells. In contrast to type L929, the leukocyte cells morphology does not vary so much. Therefore, it can be assumed that the deviation gets worse for cells with stronger varying morphology than the leucocyte cells.
The evaluation of the cell morphology is an important aspect in the context of biocompatibility testing. Therefore, an accurate segmentation of the cell boundaries within the clusters is important in order to obtain a reliable result. To evaluate the methods precision concerning the cell area segmentation, 100 automatically segmented cell regions within clusters were compared with the cell regions evaluated manually by an expert. The Jaccard coefficient is a suitable method to determine the quality of the separation. If two objects are equal in shape and area, the Jaccard coefficient is 1. Table 8 shows the Jaccard coefficient of the CBS and four other separation algorithms.
Table 8 shows a Jaccard Coefficent of 0.84 for the CBS. In comparison, the other methods [15, 16, 20] provide with 0.76, 0.75 and 0.8 poorer results.
The methods [15, 20] partially split cellular extensions or even holes cells (Figures 12(c) and 12(e)). However, with the presented method and the algorithm introduced in [16], no cell extensions are separated and most cells are cut at reasonable places from a biological point of view. The method described in [16] is, in contrast to the CBS, not suitable for the separation of cells which are in a biological division process. Therefore, the Jaccard coefficient is slightly worse in comparison to the presented procedure.
The required parameters for the decision function f(x, y) for the cell type L929 were adjusted experimentally. With f(1.5,3), the smallest deviation of the automated cell count compared to the reference value is obtained. The cell-specific rules such as object size and compactness were set up specifically for this application and can, if necessary, be replaced by other rules without changing the method. In this case the method is used as a supplement to the existing separation algorithm [16] to reduce the calculation time and increase the accuracy of cell counting and cell area segmentation within the clusters. It is possible to apply the CBS to object joining situations independently of other algorithms. By doing so, the calculation time needed is milliseconds. The CBS algorithm can also be applied to other types of objects and is therefore suitable for other similar types of problems.
4. Conclusion
In this paper, a method for segmenting and separating cells in clusters is presented. The algorithm first segments histological stained cell regions in microscopic images with a standard threshold method applied to each color channel. The separation of connected cells at narrow joints is carried out by sampling the cluster contour with a circular structural element. Within the circular element, the cell geometry is analyzed and the result of a decision function indicates whether a local narrowing exists or not. An extension of the decision function with two exchangeable conditions avoids unwanted separation processes and improves the cell area segmentation. The method can be used to separate any segmented objects which have narrow joints at their contact areas. It has a very fast execution speed since not all contour points have to be processed. The procedure can be combined very well with other separation methods. This leads to better results and reduces the overall calculation time.
Conflict of Interests
The authors declare that there is no conflict of interests regarding the publication of this paper.
Acknowledgment
This work was supported by the “Bundesministerium für Forschung und Entwicklung,” Germany (no. 17033X10).


