Design for Reliability of Complex System: Case Study of Horizontal Drilling Equipment with Limited Failure Data
Abstract
Reliability is an important phase in durable system designs, specifically in the early phase of the product development. In this paper, a new methodology is proposed for complex systems’ design for reliability. Specific test and field failure data scarcity is evaluated here as a challenge to implement design for reliability of a new product. In the developed approach, modeling and simulation of the system are accomplished by using reliability block diagram (RBD) method. The generic data are corrected to account for the design and environment effects on the application. The integral methodology evaluates reliability of the system and assesses the importance of each component. In addition, the availability of the system was evaluated using Monte Carlo simulation. Available design alternatives with different components are analyzed for reliability optimization. Evaluating reliability of complex systems in competitive design attempts is one of the applications of this method. The advantage of this method is that it is applicable in early design phase where there is only limited failure data available. As a case study, horizontal drilling equipment is used for assessment of the proposed method. Benchmarking of the results with a system with more available failure and maintenance data verifies the effectiveness and performance quality of presented method.
1. Introduction
Today’s competitive world and increasing customer demand for highly reliable products makes reliability engineering more challenging task. Reliability analysis is one of the main tools to ensure agreed delivery deadlines which in turn maintain certainty in real tangible factors such as customer goodwill and company reputation [1]. Downtime often leads to both tangible and intangible losses. These losses may be due to some unreliable components; thus an effective strategy needs to be framed out for maintenance, replacement, and design changes related to those components [2–4].
The design for reliability is an important research area, specifically in the early design phase of the product development. In fact, reliability should be designed and built into products and the system at the earliest possible stages of product/system development. Reliability targeted design is the most economical approach to minimize the life-cycle costs of the product or system. One can achieve better product or system reliability at much lower costs by the utilization of these techniques. Otherwise, the majority of life-cycle costs are locked in phases other than design and development; one pays later on the product life for poor reliability consideration at the design stage. As an example, typical percentage costs in various life-cycle phases are given in Table 1. If reliability analysis is applied during the conceptual design phase, its impact will be more remarkable on the design process producing high quality items [5]. A structure reliable in concept is less expensive than a structure that is not reliable in concept, even with improvement in a later phase of the design process [6]. Also, reliability analysis in the conceptual design process leads to more optimal structures than application at the end of the design process [7].
| Life-cycle phases | Percentage costs |
|---|---|
| Concept/feasibility | 3 |
| Design/development | 12 |
| Manufacture | 35 |
| Operation/use | 50 |
In most of the recent designs for reliability researches, field and test data were used as the main source of the component reliability data; also a part of a system (e.g., electrical or mechanical part) was studied and hybrid electromechanical systems were not integrally analysed.
Literature Review. During the recent years, the requirement of modern technology, especially the complex systems used in the industry, leads to a growth in the amount of researches about the design for reliability. Avontuur and van der Werff [6] and Avontuur [7] emphasize the importance of reliability analysis in the conceptual design phase. It is demonstrated that it is possible to improve a design by applying reliability analysis techniques in the conceptual design phase. The aim is to quantify the cost of failure and unavailability and compare them with investment cost to improve the reliability. [9] developed a design for reliability approach by integrating the randomness of tillage forces into the design analysis of tillage machines, aiming at achieving reliable machines. The proposed approach was based on the uncertainty analysis of basic random variables and the failure probability of tillage machines. For this purpose, two reliability methods, namely, Monte Carlo simulation technique and the first-order reliability methods, were utilized. [10] presented a case study for the early design reliability prediction method (EDRPM) to calculate function and component failure rate distributions during the design process such that components and design alternatives can be selectively eliminated. The output of this method is a set of design alternatives that has a reliability value at or greater than a preset reliability goal. Table 2 summarizes the research articles and their main used methodology.
| Reference | Year | Used method for modeling and simulation of system |
|---|---|---|
| Avontuur and van der Werff [6] | 2001 | ETA, FTA, FMEA |
| Youn and Choi [11] | 2004 | FORM, RIA, PMA |
| Yadav et al. [12] | 2006 | FMEA |
| Kumar et al. [13] | 2007 | Replacement and design change |
| Carrarini [14] | 2007 | MC |
| Cho and Lee [15] | 2011 | MC, FORM, SORM |
| Abo Al-Kheer et al. [9] | 2011 | MC & FORM |
| Tarashioon et al. [16] | 2012 | FMMEA |
| O’Halloran et al. [10] | 2012 | RBD, EDRPM |
| Soleimani [17] | 2013 | RBD, MC |
| Morad et al. [18] | 2013 | RBD, MC |
This work examines a design for reliability methodology for complex systems at the early phase design. One of the main advantages of this method is to consider other significant factors for correction of collected generic failure rates for different components. Typical factors include temperature factor πT, power factor πp, power stress factor πS, quality factor πQ, and environmental factor πE, to adjust the base failure rate λb. In this research, depending on the components type and their working condition, some of these factors are considered in reliability data correction. Moreover, this correction is integrated in the methodology to more robust analysis of the complex systems. Reliability evaluation of complex systems in reverse engineering (competitive design) phase is one of the applications of the presented method.
The main aim of this research is (i) to present an integrated methodology for design for reliability of complex systems where enough experimental data is not available and (ii) to estimate the reliability parameters and reliability optimization of system with increasing the quality of components and changing its design (e.g., redundancy).
In Section 2, method structure is discussed and its steps are illustrated. Section 3 introduces the case study and demonstrates the reliability parameter results. The final section provides a conclusion for this research.
2. Methodology Structure
In this research, a methodology is developed for reliability evaluation of electromechanical systems. The proposed method’s flowchart is shown in Figure 1. This flowchart includes five main steps which are explained in the following section.
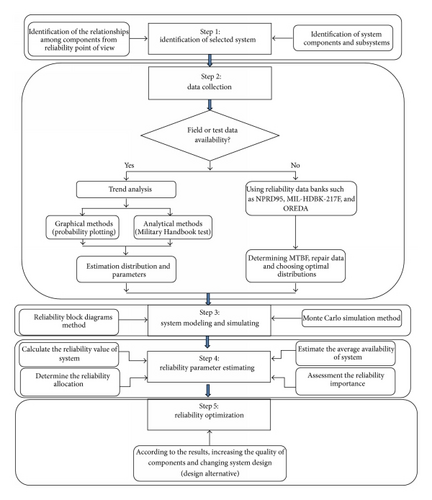
Step 1. Subsystems and components of a system are identified and their functional relationships are determined. There are some logical structures for arrangements of system items and components from reliability evaluation point of view. These structures include series, parallel, series-parallel, standby, load-sharing form, and complex system [19]. Each of these structures needs their own formulations for estimating the reliability and failure probabilities.
In this paper, generic data bases, for example, MIL-HDBK-217F, OREDA, and NPRD-95, are used as the primary source of components reliability data for the systems in the presence of inadequate specific reliability data. Expert judgment is used for specific components failure estimation, for which there is no generic failure data available.
2.1. Trend Analysis
Basically, trend testing is accomplished using either graphical method (i.e., probability plotting and time test on plot) or analytical method (i.e., Mann test, Laplace test, and Military Handbook test). Nonparametric methods are alternatives for the analysis of the failure and repair data trend [25]. Trend analysis provides a curve of the mean cumulative function for mean number of failures at specified time against service lifetime to illustrate the trend of failure data during total life span [25]. If the failure data plot results in a straight line, no trend is concluded. Based on this analysis, each unit is composed of a staircase function demonstrating cumulative number of failures for a particular event. Finally, regression of the generated points describes the trend procedure. Also, assembly of units generates a set of staircase curves of each unit in the population, so that the mean cumulative number of failures is estimated. The serial correlation test is used for studying the independence of the failure data. Serial correlation plot is based on ith lifetime failure against (i − 1)th lifetime failure. If only one cluster of points is generated, then no trend is observed. The trend exists if there are two or more clusters, or a straight line is generated [26]. Probability plot is used for estimating the statistical distribution parameters when the failure data follow IID condition, whereas the GRP method is used whenever the failure data demonstrate a trend (for more details about trend analysis, see [8, 17–19, 27, 28]).
Step 3. System is modelled with RBD and is simulated with Monte Carlo technique. Reliability block diagram (RBD) is used to determine the system or subsystem reliability of a design [8]. RBD based reliability evaluation is useful when requirements dictate the level of design reliability or during component selection when each component has a different reliability. For complex systems, these diagrams are useful as a visual tool to find out where failures occur [10].
2.2. Monte Carlo Simulation Method
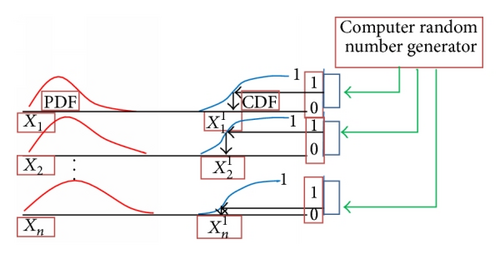
The Monte Carlo simulation method is an artificial sampling method which may be used for solving complicated problems in analytic formulation and for simulating purely statistical problems [29]. MC method procedure is composed of sampling from CDF of each xi parameter that is involved in availability estimation (reliability distribution functions and maintenance policies). Figure 2 illustrates this procedure.
Step 4. The estimation is done for the determination of reliability and availability value. Also reliability importance and reliability allocation are done.
2.3. Reliability Estimation
Reliability and availability are two suitable metrics for quantitative evaluation of system survival analysis. Reliability is defined as the probability of the system mission implementation without occurrence of failure at a specified time period [19]. In class of statistical methods, analyzing the reliability is based on the observed failure data and proper statistical techniques [30].
According to the system-level load-strength interference relationship [31], for the system composed of n independently identical distributed components, the cumulative distribution function and probability density function of the component strength are Fδ(δ) and fδ(δ), respectively, and the load probability density function is fs(s). The respective reliability models for different systems utilized in this research and embedded in numerical analysis are as follows.
Most practical systems are neither parallel nor series but exhibit some hybrid combination of the two. These systems are often referred to as parallel-series system. Another type of complex system is one that is neither series nor parallel alone, nor parallel-series. For the analysis of all types of complex systems, Shooman [32] describes several analytical methods for complex systems. These are the inspection method, event space method, path-tracing method, and decomposition. These methods are good only when there are not a lot of units in the system. For analysis of a large number of units, fault trees would be more appropriate.
Among the repairable systems, GRP is the attractive one for reliability analysis modelling, since it covers not only the RP and the NHPP, but also the intermediate “younger than old but older than new” repair assumption. GRP has been used in many applications, such as automobile industry [34] and oil industry [35].
Kijima et al. [37] point out that the numerical solution of the G-renewal equation is very difficult in the case of Weibull underlying distribution. This position is not valid in the situations where the Monte Carlo method is applied.
2.4. Availability Evaluation
Due to the application of both failures and maintenance downtime data, availability is generally used for measuring performance of the repairable items [38]. Generally, reliability analysis of the repairable systems is estimated by several assumptions including renewal process (RP), homogenous Poisson process (HPP), nonhomogenous Poisson process (NHPP) [27], and generalized renewal process (GRP) [28]. In this research, RP and GRP methods are used.
2.5. Importance Measure
The importance measure is a mean for identification of the most critical items. By ranking of the items, prioritizing policy is planned in a way that the weakest items are identified and improved [39]. In simple systems, it is easy to identify the weak components. However, in more complex systems, this becomes quite a difficult task. The value of the reliability importance depends on both the reliability of a component and its position in the system.
2.6. Reliability Allocation
The allocation process translates overall system performance into the sub-system and component level requirements. The process of assigning reliability requirements to individual components is called reliability allocation to attain the specified system reliability [41]. Reliability allocation is an important step in the system design. It allows the determination of the reliability of constituent subsystems and components in order to obtain an overall system reliability target. By this objective, the hardware and software subsystem goals are well-balanced among themselves.
By well-balanced usually refers to approximate relative equality of development time, difficulty, and risk or to the minimization of overall development cost.
From mathematical point of view, the reliability allocation problem is a nonlinear programming problem. It is shown as follows [8].
2.7. Uncertainty Analysis
Uncertainty ranges are derived for the problem for the demonstration of the confidence on the obtained results. There are various input and model uncertainty sources in the calculations and results. It includes approximations, assumptions, sampling errors, selecting probability distribution functions, and models for estimation of statistical parameters and simulation process. Methods for the estimation of input uncertainty include maximum likelihood estimation, Bayesian updating, maximum entropy. Propagation of uncertainty also affects the results. Several methods exist for uncertainty propagation including Monte Carlo simulation, response surface method, and method of moments and bootstrap sampling [27]. Monte Carlo simulation is used here for the propagation of uncertainties.
- (1)
reducing the complexity of the system;
- (2)
using highly reliable components through component improvement programs;
- (3)
using structural redundancy;
- (4)
putting in practice a planned maintenance, repair schedule, and replacement policy,
- (5)
decreasing the downtime by reducing delays in performing the repair. This can be achieved by optimal allocation of spares, choosing an optimal repair crew size and so forth.
In addition, use of burn-in procedures may also lead to an enhancement of system reliability to eliminate early failures in the field for components having high infant mortality [47].
In the final step and according to the estimated results, reliability of system is optimized with increasing the quality of critical components and design alternatives. The term design alternative is used interchangeably to refer to the combination of components (or candidate solutions) which form a design. In this method, design alternatives are utilized for reliability improvement with available component elimination and selecting optimal combination of components.
3. Case Study
Horizontal drilling equipment is considered in the reverse engineering stage, as a case study for evaluating the present method. There are limited failure and maintenance data available for this system for the design group. Horizontal drilling is a repairable complex system with more than 4000 components where only some of them are repairable. Also, this system has several configurations in the design such as series, parallel, load-sharing, and complex systems [48]. In this section, the steps of new presented method are illustrated for this system.
3.1. Data Selection
In the modelling of this system, Weibull and exponential distributions [46] are used because of their capability for modelling components reliability in different phases of life-cycle (especially Weibull distribution for wear-out phase).
3.2. Modelling and System Simulation
In the previous works [5, 17], the RBD models of horizontal drilling equipment are explained with ReliaSoft BlockSim 8 software [49].
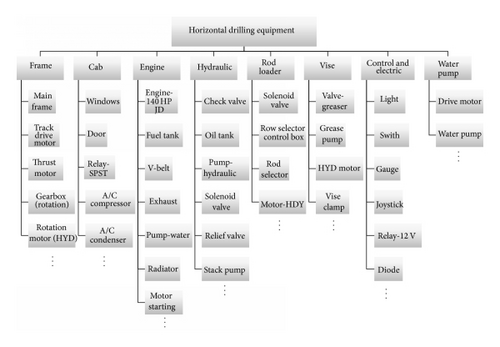
Figure 3 demonstrates the hierarchical decomposing of horizontal drilling system into the main subsystems and also further decomposition of each subsystem into its subsystems and components. See Soleimani [17] for further details. This decomposition is done in order to analyze the system reliability. In the case study, the failure of the selected components (even the headlight) is considered a system operation breakdown.
As mentioned earlier in the modelling of the system, Weibull and exponential distributions are used here because of their capability for modelling components reliability in different phases of life-cycle. Thus, all reliability parameters are calculated for these distributions.
3.3. Reliability Parameter Estimating
As shown in the process flowchart (Figure 1), reliability parameter estimation is one of main steps of this method.
3.3.1. Reliability Analysis
Horizontal drilling equipment has five types of RBD structures in its design including series, parallel, k-out-of-n, load-sharing, and complex systems.
The reliability of horizontal drilling system and its subsystems are estimated by the selection of Weibull distribution (Table 3) and exponential distribution (Table 4). Results show that in the earlier time the reliability value of system with exponential distribution is less than system reliability value with Weibull distribution. This estimation is done by assuming the value of the shape parameter (β) is equal to 2. It is done by expert assumption modelling and assumed that most components arrive in their wear-out phase.
| Subsystem/operational time (hr) | Frame | Cab | Engine | Hydraulic | Rod loader | Vise | Control and electrical | Water pump | The whole system |
|---|---|---|---|---|---|---|---|---|---|
| 50 | 0.999 | 0.999 | 0.998 | 0.998 | 0.999 | 0.999 | 0.999 | 0.999 | 0.996 |
| 100 | 0.999 | 0.999 | 0.993 | 0.995 | 0.998 | 0.999 | 0.999 | 0.999 | 0.985 |
| 200 | 0.998 | 0.999 | 0.974 | 0.980 | 0.995 | 0.999 | 0.999 | 0.996 | 0.944 |
| 500 | 0.988 | 0.999 | 0.848 | 0.885 | 0.971 | 0.997 | 0.995 | 0.978 | 0.699 |
| 1000 | 0.954 | 0.999 | 0.518 | 0.613 | 0.889 | 0.988 | 0.980 | 0.916 | 0.238 |
| 2000 | 0.830 | 0.996 | 0.071 | 0.142 | 0.625 | 0.954 | 0.923 | 0.704 | 0.003 |
| 5000 | 0.311 | 0.975 | ≈0 | ≈0 | 0.053 | 0.748 | 0.607 | 0.111 | ≈0 |
| Subsystem/operational time (hr) | Frame | Cab | Engine | Hydraulic | Rod loader | Vise | Control and electrical | Water pump | The whole system |
|---|---|---|---|---|---|---|---|---|---|
| 50 | 0.980 | 0.995 | 0.901 | 0.879 | 0.996 | 0.987 | 0.973 | 0.980 | 0.702 |
| 100 | 0.960 | 0.989 | 0.812 | 0.772 | 0.934 | 0.975 | 0.947 | 0.960 | 0.493 |
| 200 | 0.922 | 0.979 | 0.659 | 0.597 | 0.872 | 0.951 | 0.898 | 0.922 | 0.243 |
| 500 | 0.815 | 0.947 | 0.352 | 0.275 | 0.709 | 0.882 | 0.764 | 0.815 | 0.029 |
| 1000 | 0.662 | 0.898 | 0.124 | 0.076 | 0.503 | 0.788 | 0.584 | 0.665 | 0.001 |
| 2000 | 0.434 | 0.806 | 0.015 | 0.006 | 0.251 | 0.605 | 0.341 | 0.442 | 7E − 7 |
| 5000 | 0.116 | 0.584 | ≈0 | ≈0 | 0.031 | 0.285 | 0.067 | 0.130 | ≈0 |
According to Tables 3 and 4, the most unreliable subsystems are engine and hydraulic and the most reliable subsystems are identified as the cab during 5000 operation hours [17].
3.3.2. Importance Measure
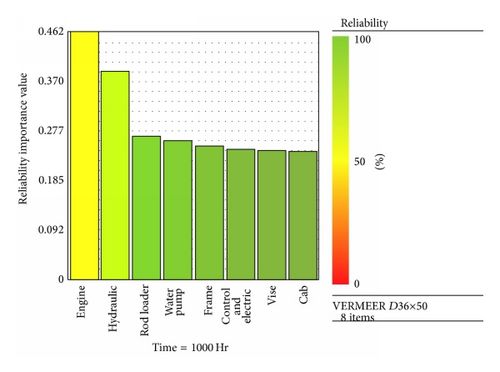
Figure 4 shows the importance measures of the case study subsystems. Engine subsystem has the highest reliability importance value, while the cab subsystem has the lowest. Therefore, occurrence of failure in motor subsystems is more susceptible. Furthermore, among all components of the system, motor starting has maximum failure rate and reliability importance. So, the reliability is improved with the improvement of the quality of component in the subsystems or change in the design (e.g., redundancy).
3.3.3. Reliability Allocation
In this research, ARINC technique is used to estimate the results of reliability allocation. Table 5 shows the results of reliability allocation for subsystems of drilling equipment with Weibull distribution. For this system, 0.95 is considered as target reliability for the duration of 2000 working hours (that is equal to 1.25 functioning years for drilling equipment). It should be noted that these results are obtained for 95% of confidence level.
| Subsystem | Reliability importance (2000 hours) |
Initial reliability (2000 hours) |
Weighting factors | Target reliability (2000 hours) |
|---|---|---|---|---|
| Frame | 0.004 | 0.830 | 0.032 | 0.998 |
| Cab | 0.003 | 0.996 | 0.001 | 0.999 |
| Engine | 0.045 | 0.071 | 0.461 | 0.976 |
| Hydraulic | 0.023 | 0.142 | 0.341 | 0.983 |
| Rod loader | 0.005 | 0.626 | 0.082 | 0.996 |
| Vise | 0.003 | 0.995 | 0.007 | 0.999 |
| Control and electrical | 0.004 | 0.923 | 0.014 | 0.999 |
| Water pump | 0.005 | 0.704 | 0.061 | 0.997 |
| The whole system | — | 0.003 | — | 0.95 |
3.3.4. Availability Assessment
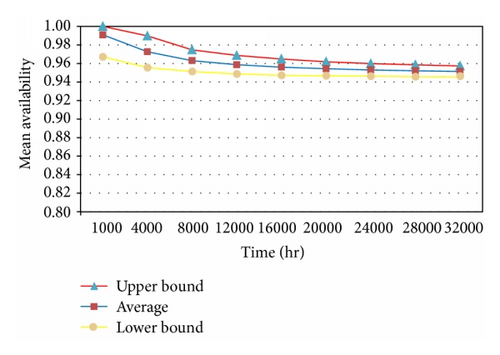
In a repairable system, because of renewal process in the components, the value of system reliability is not good metrics for decision making about the system life-cycle. Therefore, availability measure is used as a combination of reliability and maintainability parameters [38]. For horizontal drilling system, the mean availability time is estimated as 95.1% at 32000 operation hours (that is equal to 20 functioning years for drilling equipment) from simulation. Some of the simulation results are given in Table 6 (see Soleimani [17] for further details).
| Feature | Value |
|---|---|
| Mean availability time (all events) | 0.951408 |
| Point availability (all events) at 32000 | 0.938 |
| Expected number of failures | 211.498 |
| MTTFF (hr) | 766.550264 |
| Uptime (hr) | 30445.05127 |
| Total downtime (hr) | 1554.948732 |
3.3.5. Uncertainty Analysis
Figure 5 illustrates the average, upper bound, and lower bound for mean availability time of drilling equipment at 32000 operation hours by using Monte Carlo simulation. This result is obtained by 1000 iterations and confidence level of 95% [17].
3.4. Reliability Optimization
If additional reliability improvement is required, either higher quality components are selected or the design configuration is changed that is, adding redundancy to the weak reliability points. Design alternatives are used here for improving the reliability of drilling equipment. Figure 6 shows the water pump subsystem. There are some available and candidate components with different failure rates for these two items. Table 7 shows the candidate components and their failure rate values.
| Component | Failure rate (*10−6) | Component | Failure rate (*10−6) | Combined failure rates for final design (*10−6) |
|---|---|---|---|---|
| Inductive drive motor | 6.6 | Hydraulic pump | 34.1 | 226 |
| Electrical pump | 34.0 | 226 | ||
| Pneumatic pump | 25.8 | 171 | ||
| Vacuum pump | 45.4 | 301 | ||
| Diesel drive motor | 128.7 | Hydraulic pump | 34.1 | 4386 |
| Electrical pump | 34.0 | 4400 | ||
| Pneumatic pump | 25.8 | 3319 | ||
| Vacuum pump | 45.4 | 5848 | ||
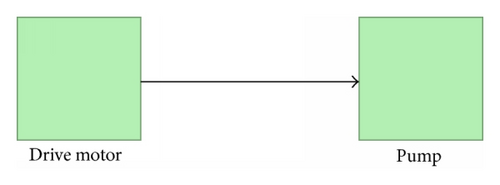
According to the results of Table 7, combination of diesel drive motor with all types of pump is not suitable. Also, failure rate is greater for final design in the combination of inductive drive motor and vacuum pump than other combinations. So, reliability of system is improved and the reliability goal is achieved with optimal combination of components in different subsystems (with the cost considered).
3.5. Benchmark Test
For the validation of the presented methodology, a benchmarking study was done by available results of similar project, copper mining dump trucks [50]. The similarity meant here is the work conditions of dump trucks and drilling equipment and many common subsystems and components. The reliability is very important for this equipment because of its hard working conditions, such as dusty environment, overloading, and working for long time.
The case study of dump truck had plenty of field reliability and maintenance data. Table 8 shows the drilling equipment estimated in this study and dump truck reliability values from [50] in different life-cycle time. The comparison of results indicates the approximate equal results for both systems. Also, the mean availability of dump trucks in 1200 operational hours is 91.8% and this value is 95.8% for drilling equipment at this time.
| Time (hours) | Reliability of drilling equipment | Reliability of dump truck |
|---|---|---|
| 0 | 1 | 1 |
| 50 | 0.7 | 0.55 |
| 100 | 0.49 | 0.26 |
| 200 | 0.24 | 0.07 |
| 500 | 0.029 | 0.001 |
| 1000 | 0.001 | ≈0 |
4. Conclusion
In this research, a design for reliability methodology was developed for electromechanical systems performance evaluation. It overcomes the drawbacks of other reliability evaluation approaches which are not suitable for complex systems with limited failure data available. This method is applicable in early design phase even when there is only limited failure data. Reliability of a complex system in reverse engineering design phase can be evaluated with this method. The main steps of this approach were presented and an application is demonstrated for the drilling equipment as a case study. The availability analysis indicates that the mean availability of the drilling equipment is 95.1% at 32000 operation hours. Reliability importance analysis illustrates that hydraulic and motor subsystems are critical elements from reliability point of view. In addition, among all components of the system, motor starter has the highest failure rate and reliability importance. With increasing the quality of components in the subsystems or changing the design (e.g., redundancy), reliability of system is improved. At the end, a benchmark study of the result of this research with similar projects shows the effectiveness of the presented method.
Abbreviations and Acronyms
-
- RBD:
-
- Reliability block diagram
-
- FORM:
-
- First-order reliability method
-
- SORM:
-
- Second-order reliability method
-
- FMMEA:
-
- Failure mode, mechanism, and effect analysis
-
- RIA:
-
- Reliability index approach
-
- PMA:
-
- Performance measure approach
-
- MCMC:
-
- Markov chain Monte Carlo
-
- CDF:
-
- Cumulative density function
-
- CIF:
-
- Cumulative intensity function
-
- PDF:
-
- Probability density function
-
- CDF:
-
- Cumulative distribution function
-
- TTFF:
-
- Time to first failure
-
- MTTF:
-
- Mean time to failure
-
- MTBM:
-
- Mean time between maintenance actions
-
- MDT:
-
- Mean downtime
-
- SPST:
-
- Single pole single throw
-
- IID:
-
- Identical and independent distribution
-
- GRP:
-
- Generalized renewal process
-
- NHPP:
-
- Nonhomogenous Poisson process
-
- HPP:
-
- Homogenous Poisson process
-
- RP:
-
- Renewal process
-
- FMEA:
-
- Failure mode and effect analysis
-
- ETA:
-
- Event tree analysis
-
- FTA:
-
- Fault tree analysis
-
- MC:
-
- Monte Carlo
-
- EDRPM:
-
- Early design reliability prediction method
-
- MCMC:
-
- Markov chain Monte Carlo.
Conflict of Interests
The authors declare that there is no conflict of interests regarding the publication of this paper.


