
Some Thiophene Derivatives as Corrosion Inhibitors for Carbon Steel in Hydrochloric Acid
Abstract
Corrosion inhibitive performance of some thiophene derivatives during the acidic corrosion of carbon steel surface in 1 M HCl was investigated by chemical technique (weight loss) and electrochemical techniques (potentiodynamic polarization, electrochemical frequency modulation, and electrochemical impedance spectroscopy). The effect of temperature on the corrosion rate was investigated by the weight loss method, and some thermodynamic parameters for corrosion and adsorption processes were determined and discussed. The results show that the inhibition efficiency increased with the increase in inhibitor concentration and temperature. The adsorption of thiophene derivatives on the carbon steel surface obeys Langmuir adsorption isotherm. The obtained results indicated that the investigated compounds are chemically adsorbed on the steel surface. Potentiodynamic polarization studies showed that these compounds are mixed-type inhibitors and the results obtained from the techniques are in good agreement.
1. Introduction
Carbon steel has remarkable economic and attractive materials for engineering applications owing to its low cost, easy availability, and high mechanical strength. The use of inhibitors is one of the most practical methods to protect metals against acid attack. The most widely used acid inhibitors are organic compounds containing oxygen, nitrogen, and/or sulfur [1–5]. Acid inhibitors have many important roles in the industrial field such as a component in pretreatment composition, cleaning solutions, and in acidification of oil wells. Heteroatoms as sulfur, nitrogen, and oxygen as well as aromatic rings in their structure are the major adsorption centers. Some works have studied the influence of organic compounds containing nitrogen on the corrosion resistance of steel in acidic media [6–18] most organic inhibitors decrease corrosion rate by adsorption on the metal surface. To be effective, an inhibitor must also displace water from the metals surface to block active corrosion sites and interact with the anodic or cathodic reaction sites to retard the oxidation and/or reduction of corrosion reaction. So, the inhibition efficiency of organic compounds depends on the structure of the inhibitor, the characteristics of the environment, and so forth. Several organic compounds have been evaluated as corrosion inhibitors for carbon steel in acidic media, so the aim of this work is to study the inhibition properties of some thiophene derivatives for the corrosion of 1018 carbon steel in 1 M HCl. The main techniques were employed: chemical (weight loss) and electrochemical ones (potentiodynamic, electrochemical frequency modulation, EFM, and electrochemical impedance spectroscopy, EIS). These techniques were performed in 1 M HCl without and with the presence of the investigated compounds in the concentration range (0 to 12 × 10−5 M).
2. Methods
2.1. Materials
Rectangular specimens with dimensions 2 × 2 × 0.2 cm of carbon steel that is chemical composition can be seen from Table 1. It was used for weight loss measurements. For electrochemical tests, the exposed surface area of metal was 1.00 cm2.
| Element | C | Mn | P | Si | Fe |
|---|---|---|---|---|---|
| Weight (%) | 0.2 | 0.35 | 0.024 | 0.003 | Rest |
2.2. Inhibitors
Thiophene derivatives were prepared as reported before [19]. Table 2 shows the structures, names, molecular weights, and molecular formulas of these compounds.
| Inhibitor | Structures | Names | Mol.Wt., Mol. formulas |
|---|---|---|---|
| A |  |
2-[(2Z)-2-(1-cyano-2-iminopropylidene)hydrazinyl]-4,5,6,7-tetrahydro-1-benzothiophene-3-carboxamide |
|
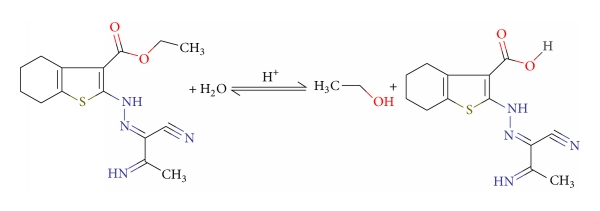
| B |  |
ethyl 2-[(2Z)-2-(1-cyano-2-iminopropylidene)hydrazinyl]-4,5,6,7-tetrahydro-1-benzothiophene-3-carboxylate |
|
| C |  |
2-[(2Z)-2-(1-cyano-2-iminopropylidene)hydrazinyl]-4,5,6,7-tetrahydro-1-benzothiophene-3-carbonitrile |
|
2.3. Solutions
Hydrochloric acid (37%), ethyl alcohol, and acetone were BDH grades and purchased from Algamhoria Co. (Egypt). Bidistilled water was used for preparing test solutions for all measurements.
2.4. Procedures Used for Corrosion Measurements
2.4.1. Weight Loss Tests
2.4.2. Potentiodynamic Polarization Measurements
Polarization experiments were carried out in a conventional three-electrode cell with platinum gauze as the auxiliary electrode and a saturated calomel electrode (SCE) coupled to a fine Luggin capillary as reference electrode. The working electrode was in the form of a square cut from copper sheet of equal composition embedded in epoxy resin of polytetrafluoroethylene so that the flat surface area was 1 cm2. Prior to each measurement, the electrode surface was pretreated in the same manner as the weight loss experiments. Before measurements, the electrode was immersed in solution for 30 min. until a steady state was reached. The potential was started from −600 to +400 mV versus open circuit potential (Eocp). All experiments were carried out in freshly prepared solutions at 25°C and results were always repeated at least three times to check the reproducibility.
2.4.3. Electrochemical Impedance Spectroscopy Measurements
Impedance measurements were carried out using AC signals of 5 mV peak to peak amplitude at the open circuit potential in the frequency range of 100 kHz to 0.1 Hz. All impedance data were fitted to appropriate equivalent circuit using the Gamry Echem Analyst software.
2.4.4. Electrochemical Frequency Modulation Technique
EFM experiments were performed with applying potential perturbation signal with amplitude 10 mV with two sine waves of 2 and 5 Hz. The choice for the frequencies of 2 and 5 Hz was based on three arguments [21–23]. The larger peaks were used to calculate the corrosion current density (icorr.), the Tafel slopes (βc and βa), and the causality factors CF-2 and CF-3 [24].
All electrochemical experiments were carried out using Gamry instrument PCI300/4 Potentiostat/Galvanostat/Zra analyzer, DC105 corrosion software, EIS300 electrochemical impedance spectroscopy software, EFM140 electrochemical frequency modulation software, and Echem Analyst 5.5 for results plotting, graphing, data fitting, and calculating.
3. Results and Discussion
3.1. Weight Loss Measurements
Weight loss of carbon steel was determined, at various time intervals, in the absence and presence of different concentrations of thiophene derivatives compounds (A, B, and C). The obtained weight loss time curves are represented in Figure 1 for inhibitor (A), the most effective one. Similar curves were obtained for other inhibitors (not shown). The inhibition efficiency of corrosion was found to be dependent on the inhibitor concentration. The curves obtained in the presence of inhibitors fall significantly below that of free acid. In all cases, the increase in the inhibitor concentration was accompanied by a decrease in weight loss and an increase in the percentage inhibition. These results lead to the conclusion that the compounds under investigation are fairly efficient as inhibitors for carbon steel dissolution in hydrochloric acid solution. Also, the degree of surface coverage (θ) by the inhibitor, calculated from (1), would increase by increasing the inhibitor concentration. In order to get a comparative view, the variation of the percentage inhibition (%IE) of the three inhibitors with their molar concentrations was calculated according to (2). The values obtained are summarized in Table 3. Careful inspection of these results showed that, at the same inhibitor concentration, the order of inhibition efficiencies is as follows: A > B > C.
| Cinh. × 10−5(M) | A | B | C | |||
|---|---|---|---|---|---|---|
| %IE | θ | %IE | θ | %IE | θ | |
| 2 | 46.1 | 0.461 | 35.6 | 0.356 | 23.9 | 0.239 |
| 4 | 54.3 | 0.543 | 47.9 | 0.479 | 33.8 | 0.338 |
| 6 | 58.9 | 0.589 | 54.3 | 0.543 | 41.7 | 0.417 |
| 8 | 64.3 | 0.643 | 60.8 | 0.608 | 50.2 | 0.502 |
| 10 | 66 | 0.66 | 62.5 | 0.625 | 56.7 | 0.567 |
| 12 | 72.5 | 0.725 | 66.6 | 0.666 | 64.9 | 0.649 |

3.1.1. Adsorption Isotherm
| Temperature (°C) | A | B | C | ||||||
|---|---|---|---|---|---|---|---|---|---|
| Kads× 10−3 (M−1) | Slope | R2 | Kads× 10−3 (M−1) | Slope | R2 | Kads× 10−3 (M−1) | Slope | R2 | |
| 25 | 42.82 | 1.24 | 0.988 | 30.01 | 1.24 | 0.988 | 13.37 | 1.00 | 0.943 |
| 35 | 36.87 | 1.13 | 0.985 | 43.23 | 1.19 | 0.985 | 14.87 | 1.02 | 0.957 |
| 45 | 57.13 | 1.04 | 0.987 | 58.75 | 1.12 | 0.997 | 16.46 | 1.03 | 0.964 |
| 55 | 139.41 | 1.05 | 0.999 | 57.13 | 1.00 | 0.999 | 45.99 | 1.08 | 0.995 |


Table 5 clearly shows a good dependence of on T, indicating the good correlation among thermodynamic parameters. The negative value of ensures the spontaneity of the adsorption process and stability of the adsorbed layer on the steel surface. Generally, values of around −20 kJ mol−1 or lower are consistent with the electrostatic interaction between the charged molecules and the charged metal (physisorption); those around −40 kJ mol−1 or higher involve charge sharing or transfer from organic molecules to the metal surface to form a coordinate type of bond (chemisorption) [25]. The calculated values are closer to −40 kJ mol−1 indicating that the adsorption mechanism of the inhibitors on steel in 1 M HCl solutions was typical of chemisorption. The unshared electron pairs in sulphur and nitrogen as well as in oxygen may interact with d-orbitals of steel to provide a protective chemisorbed film [26]. The values of thermodynamic parameter for the adsorption of inhibitors (Table 5) can provide valuable information about the mechanism of corrosion inhibition. While an endothermic adsorption process () is attributed unequivocally to chemisorption [27], an exothermic adsorption process () may involve either physisorption or chemisorption or mixture of both processes. The values in the presence of inhibitors in 1 M HCl are positive. This indicates that an increase in disorder takes places from reactants to the metal-adsorbed reaction complex [28].
| Inhibitor | Temperature (°C) | Kads.× 10−3 | |||
|---|---|---|---|---|---|
| (M−1) | (kJ mol−1) | (kJ mol−1) | (kJ mol−1) | ||
| A | 25 | 42.8 | 36.4 | 2.8 | 0.13 |
| 35 | 36.9 | 37.2 | 0.12 | ||
| 45 | 57.1 | 39.6 | 0.12 | ||
| 55 | 139.4 | 43.3 | 0.13 | ||
| B | 25 | 30 | 35.5 | 1.7 | 0.12 |
| 35 | 43.2 | 37.6 | 0.12 | ||
| 45 | 58.8 | 39.7 | 0.12 | ||
| 55 | 57.1 | 40.8 | 0.12 | ||
| C | 25 | 13.4 | 33.5 | 3 | 0.12 |
| 35 | 14.9 | 34.9 | 0.11 | ||
| 45 | 16.5 | 36.3 | 0.11 | ||
| 55 | 46 | 40.2 | 0.12 | ||
3.1.2. Effect of Temperature
The effect of temperature on the corrosion rate of carbon steel in 1 M HCl and in presence of different inhibitors concentrations was studied in the temperature range of 298–328 K using weight loss measurements. Similar curves were obtained for other inhibitors (not shown). As the temperature increases, the rate of corrosion increases; nevertheless, the inhibition efficiency of the additives increases as shown in Table 6 for inhibitor (A), the most effective one. Similar tables were obtained for other inhibitors (not shown). Table 6 illustrates that the adsorption is aided by increasing the temperature. This behavior proves that the adsorption of inhibitors on carbon steel surface occurs through chemical adsorption. Ivanov [29] considers the increase of %IE with increasing the temperature as the change in the nature of the adsorption mode; the inhibitor is being physically adsorbed at lower temperatures, while chemisorption is favored as temperature increases. Similar observations were reported by other authors [30–32].
| Concentration × 10−5 (M) | 298 K | 308 K | 318 K | 328 K | ||||||||
|---|---|---|---|---|---|---|---|---|---|---|---|---|
| θ | %IE | C.R. | θ | %IE | C.R. | θ | %IE | C.R. | θ | %IE | C.R. | |
| 2 | 0.461 | 46.1 | 0.008 | 0.454 | 45.4 | 0.014 | 0.589 | 58.9 | 0.03 | 0.732 | 73.2 | 0.03 |
| 4 | 0.543 | 54.3 | 0.007 | 0.549 | 54.9 | 0.012 | 0.675 | 67.5 | 0.02 | 0.813 | 81.3 | 0.02 |
| 6 | 0.589 | 58.9 | 0.006 | 0.593 | 59.3 | 0.011 | 0.69.1 | 69.1 | 0.02 | 0.835 | 83.5 | 0.02 |
| 8 | 0.643 | 64.3 | 0.005 | 0.67 | 66.66 | 0.009 | 0.801 | 80.1 | 0.01 | 0.882 | 88.2 | 0.01 |
| 10 | 0.66 | 66 | 0.005 | 0.712 | 71.2 | 0.008 | 0.83 | 83 | 0.01 | 0.889 | 88.9 | 0.01 |
| 12 | 0.725 | 72.5 | 0.004 | 0.761 | 76.1 | 0.006 | 0.86 | 86 | 0.01 | 0.905 | 90.5 | 0.01 |
3.1.3. Kinetic-Thermodynamic Corrosion Parameter
| Cinh.× 10−5 (M) | Activation parameters | ||
|---|---|---|---|
| (kJ mol−1) | ΔH* (kJ mol−1) | ΔS* (J mol−1K−1) | |
| Blank | 58.50 | 24274.22 | 5574.8599 |
| 2 | 39.39 | 15975.93 | 1.5162 |
| 4 | 34.38 | 13798.83 | 0.1738 |
| 6 | 34.30 | 13764.91 | 0.1532 |
| 8 | 27.54 | 10830.32 | 0.0086 |
| 10 | 27.20 | 10682.49 | 0.0068 |
| 12 | 25.41 | 8712.32 | 0.0048 |

Figure 7 shows a plot of (logk/T) against (1/T) in the case of inhibitor (A) in 1 M HCl. Similar behavior is observed in the case of inhibitors B and C (not shown). Straight lines are obtained with slopes equal to (ΔH*/2.303R) and intercepts are [log(R/Nh + ΔS*/2.303R)] calculated in Table 7.

The decrease in with the increase in inhibitor concentration (Table 7) is typical of chemisorption. The positive signs of the enthalpies (ΔH*) reflect the endothermic nature of the steel dissolution process. Value of entropies (ΔS*) implies that the activated complex at the rate determining step represents an association rather than a dissociation step, meaning that a decrease in disordering takes place form reactants toward the activated complex formation [30, 36]. However, the value of (ΔS*) decreases gradually with increasing the inhibitor concentrations in all the acid media.
3.2. Electrochemical Measurements
3.2.1. Electrochemical Frequency Modulation Technique (EFM)
EFM is a nondestructive corrosion measurement technique that can directly and quickly determine the corrosion current values without prior knowledge of Tafel slopes and with only a small polarizing signal. These advantages of EFM technique make it an ideal candidate for online corrosion monitoring [37]. The great strength of the EFM is the causality factors which serve as an internal check on the validity of EFM measurement. The causality factors CF-2 and CF-3 are calculated from the frequency spectrum of the current responses.
| Compound | Concentration × 10−5 (M) | icorr (μA cm−2) | βc (mV dec−1) | βa (mV dec−1) | kcorr. (mpy) | CF-2 | CF-3 | θ | %IE |
|---|---|---|---|---|---|---|---|---|---|
| Blank | 0 | 913.3 | 149 | 132 | 420.8 | 1.90 | 3.34 | — | — |
| A | 2 | 535.4 | 103 | 97 | 246.7 | 1.86 | 2.88 | 0.414 | 41.4 |
| 4 | 522.7 | 106 | 98 | 240.8 | 1.85 | 2.20 | 0.428 | 42.8 | |
| 6 | 408.0 | 59 | 50 | 188.0 | 2.01 | 2.19 | 0.553 | 55.3 | |
| 8 | 338.7 | 97 | 92 | 156.0 | 1.37 | 2.37 | 0.629 | 62.9 | |
| 10 | 222.7 | 100 | 97 | 102.6 | 1.88 | 2.60 | 0.756 | 75.6 | |
| 12 | 138.9 | 110 | 97 | 64.0 | 1.88 | 2.42 | 0.848 | 84.8 | |
| B | 2 | 529.9 | 92 | 106 | 242.1 | 1.88 | 3.08 | 0.420 | 42.0 |
| 4 | 375.1 | 103 | 92 | 171.4 | 2.25 | 1.73 | 0.589 | 58.9 | |
| 6 | 322.8 | 43 | 37 | 147.5 | 1.95 | 2.29 | 0.647 | 64.7 | |
| 8 | 314.9 | 101 | 93 | 143.9 | 2.10 | 2.88 | 0.655 | 65.5 | |
| 10 | 302.0 | 39 | 35 | 138.0 | 1.94 | 2.87 | 0.669 | 66.9 | |
| 12 | 204.9 | 102 | 93 | 93.6 | 1.98 | 2.45 | 0.776 | 77.6 | |
| C | 2 | 503.1 | 101 | 90 | 229.9 | 1.86 | 2.88 | 0.449 | 44.9 |
| 4 | 433.5 | 102 | 94 | 198.1 | 1.85 | 2.20 | 0.525 | 52.5 | |
| 6 | 341.1 | 98 | 88 | 155.9 | 2.01 | 2.19 | 0.627 | 62.7 | |
| 8 | 337.1 | 101 | 95 | 154.0 | 1.37 | 2.37 | 0.631 | 63.1 | |
| 10 | 307.5 | 54.0 | 78 | 140.5 | 1.88 | 2.60 | 0.663 | 66.3 | |
| 12 | 288.8 | 102.6 | 93 | 131.9 | 1.88 | 2.42 | 0.684 | 68.4 | |

3.2.2. Electrochemical Impedance Spectroscopy (EIS)
Impedance is a measure of the ability of a circle to resist the flow of electrical current. Electrochemical impedance is usually measured by applying an AC potential to an electrochemical cell and measuring the current through the cell. Surface properties, electrode kinetics, and mechanistic information can be obtained from impedance diagrams [39–43]. Figure 9 shows the Nyquist (a) and Bode (b) plots obtained at open-circuit potential both in the absence and presence of increasing concentrations of investigated compounds at 25°C. The increase in the size of the capacitive loop with the addition of investigated compounds shows that a barrier gradually forms on the carbon steel surface. The increase in the capacitive loop size (Figure 9(a)) is enhanced, at a fixed inhibitor concentration, following the order: (A) > (B) > (C), confirming the highest inhibitive influence of compound (A). Bode plots (Figure 9(b)) show that the total impedance increases with increasing inhibitor concentration (logZ versus logf). But logf versus phase also Bode plot shows the continuous increase in the phase angle shift, obviously correlating with the increase of inhibitor adsorbed on carbon steel surface. The Nyquist plots do not yield perfect semicircles as expected from the theory of EIS. The deviation from ideal semicircle was generally attributed to the frequency dispersion [44] as well as to the inhomogeneities of the surface.


| Inhibitor | Concentration × 10−5 (M) |
−Ecorr. (mV) | icorr. (μA cm−2) | βc (mV dec−1) | βa (mV dec−1) | kcorr. (mpy) | θ | %IEp |
|---|---|---|---|---|---|---|---|---|
| 1 M HCl | Blank | 511 | 2170 | 206.7 | 205.3 | 992.3 | — | — |
| A | 2 | 449 | 695 | 199 | 111 | 317.6 | 0.680 | 68.0 |
| 4 | 447 | 543 | 195 | 118 | 248.1 | 0.750 | 75.0 | |
| 6 | 438 | 458 | 183 | 99 | 209.1 | 0.789 | 78.9 | |
| 8 | 447 | 409 | 168 | 85 | 186.9 | 0.812 | 81.2 | |
| 10 | 422 | 278 | 157 | 79 | 127.0 | 0.872 | 87.2 | |
| 12 | 436 | 181 | 145 | 79 | 82.8 | 0.917 | 91.7 | |
| B | 2 | 507 | 1900 | 257 | 182 | 866.8 | 0.124 | 12.4 |
| 4 | 504 | 1130 | 188 | 136 | 516.3 | 0.479 | 47.9 | |
| 6 | 497 | 800 | 189 | 154 | 365.6 | 0.631 | 63.1 | |
| 8 | 486 | 453 | 188 | 133 | 207.1 | 0.791 | 79.1 | |
| 10 | 482 | 310 | 140 | 105 | 141.5 | 0.857 | 85.7 | |
| 12 | 472 | 205 | 162 | 108 | 93.9 | 0.906 | 90.6 | |
| C | 2 | 522 | 2050 | 211 | 188 | 936.6 | 0.055 | 5.5 |
| 4 | 526 | 1780 | 165 | 122 | 815.3 | 0.180 | 18.0 | |
| 6 | 516 | 1200 | 167 | 125 | 549.2 | 0.447 | 44.7 | |
| 8 | 474 | 455 | 171 | 119 | 196.9 | 0.790 | 79.0 | |
| 10 | 491 | 387 | 130 | 85 | 176.8 | 0.822 | 82.2 | |
| 12 | 478 | 310 | 140 | 97 | 141.7 | 0.857 | 85.7 | |


3.3. Potentiodynamic Polarization Measurements
- (1)
The cathodic and anodic curves obtained exhibit Tafel-type behavior. Addition of thiophene derivatives increased both the cathodic and anodic overvoltages and inhibited both the hydrogen evolution and the anodic dissolution processes that are mixed-type inhibitors.
- (2)
The corrosion current density (icorr.) decreases with increasing the concentration of the thiophene derivatives which indicates that these compounds act as inhibitors, and the degree of inhibition depends on the concentration and type of inhibitors present.
- (3)
The slopes of anodic and cathodic Tafel lines (βa and βc) were slightly changed by increasing the concentration of the tested compounds. This indicates that these inhibitors act as mixed-type inhibitors. Tafel lines are parallel, which indicates that there is no change of the mechanism of inhibition in the presence and absence of inhibitors.
- (4)
The orders of inhibition efficiency of all inhibitors at different concentrations as given by polarization measurements are listed in Table 9. The results are in good agreement with those obtained from weight loss measurements.


4. Mechanism
- (1)
electrostatic attraction between the charged molecules and the charged metal;
- (2)
interaction of unshared electron pairs in the molecule with the metal;
- (3)
interaction of π-electrons with the metal;
- (4)
combination of all the above.
The fact that the adsorption of inhibitors on C-steel surface proceeded via chemical adsorption indicates that the mechanism is consistent with the transferred electron from the inhibitor’s molecule to the empty orbital of Fe in C-steel. In acid solution, the protonation of the inhibitors may occur easily, so it is difficult for the protonated compound to approach the positively charged carbon steel surface (/metal interface) due to the electrostatic repulsion. Since chloride ions have a smaller degree of hydration; thus, they could bring excess negative charges in the vicinity of the interface and favour more adsorption of the positively charged inhibitor molecules and the protonated compounds adsorbed through electrostatic interactions between the positively charged molecules and the negatively charged metal surface. We hereby propose that the mechanism involves the protonation of the nitrogen to form by HCl solution. Therefore, the cationic form of the inhibitors immersed in the acidic medium can compete with hydrogen proton (H+) for the electrons on the metallic surface. Since the size of the inhibitor’s cation is much larger than that of hydrogen molecule (due to the presence of the heterocyclic structures in the inhibitors), after the release of H2, the inhibitor returns to its neutral form with the electronegative group having a free electron pair that can facilitate its adsorption on C-steel surface. The adsorbed inhibitor can form complex with iron surface and then protect the metal against further corrosion attack by blocking its active sites by functional groups as C–S, C–O, N–H, O–H, and C=O and heterocyclic rings in their molecular structures. These functional groups have been reported in other literature as effective corrosion inhibitors [54, 55].
The results show that compound (A) exhibits better performance because it has 7 centers of adsorption (5N, 1S, and 1O), so that it cover a wide area of the metal surface and protect it, also the presence of –CH3 group which acts as donating group increases the electron density on the active centers, that leads to increase coverage surface, thereby giving higher inhibition efficiency.
Compound (C) is less active than (A) and (B) because of its small molecular surface area (294.83), and t has 6 adsorption centers (5N and 1S). The presence of cyanide group (–CN) which acts as electron withdrawing group decreases the electron density on the active centers, which led to enhance the surface coverage, thereby giving lower inhibition efficiency.
5. Conclusions
- (I)
All the investigated compounds are good corrosion inhibitors for carbon steel in 1 M HCl solution. The effectiveness of these inhibitors depends on their structures. The variation in inhibitive efficiency depends on the type and the nature of the substituent present in the inhibitor molecule.
- (II)
Reasonably good agreement was observed between the values obtained by the weight loss and electrochemical measurements were in good agreement. The order of %IE of these investigated compounds is as follows: (A) > (B) > (C).
- (III)
Results obtained from potentiodynamic polarization indicated that the investigated derivatives are mixed-type inhibitors.
- (IV)
The thermodynamic parameters revealed that the inhibition of corrosion by investigated compounds is due to the formation of a chemisorbed film on the metal surface.
- (V)
The adsorption of all investigated compounds onto steel surface follows the Langmuir adsorption isotherm model.
Conflict of Interests
The authors declare that there is no conflict of interests regarding the publication of this paper.
Acknowledgments
The authors are thankful to the Head of Chemistry Department, Mansoura University, and the Head of East Delta Electricity Production Company, Damietta, for their encouragement and necessary laboratory facilities.