Pedestrian Guiding Signs Optimization for Airport Terminal
Abstract
The pedestrian guiding sign (PGS) is used to lead people within the transportation terminal to their directions efficiently and without boundaries. In this paper, we aim to optimize the guiding signs for people in the comprehensive transportation terminal with a mathematical model, which describes the pedestrian′s reaction, judgment, and perception of the outline about the guiding signs, as well as pedestrian′s moving status through self-organized characteristic behavior. Furthermore, the model also reflects the information intensity of the guiding signs within the pedestrian′s visual field which is taken as the influence level score of PGS. In order to solve the model, cellular automation (CA) is employed to simulate the characteristics of the pedestrians such as crowd moving and sign selection.
1. Introduction
The pedestrian guiding sign (PGS) plays an important role in planning and designing of an airport terminal (AT). Generally, an AT features a complicated interior structure, and therefore the possibilities of getting lost rise substantially when pedestrians have to pick a way from multiple routes. It was found that the pedestrian had to rely on guiding signs to reach the destination or to find the right direction inside a terminal. Inside of an AT, getting the proper direction, entrance, and exit should rely on the help of PGS, which could quickly lead the pedestrian to learn about the corresponding information then gain an optimum track. Consequently, current researches heavily focus on the study of the pedestrian behaviour within AT. Capacity based models are widely used to calculate waiting time, service time, or queue length at individual facilities within the airport terminal [1–5]. On the other hand, the layout-based models are used to depict the suitability or efficiency of the planning and design of an AT [5–11].
Assessing level of service (LOS) of AT is another hot research issue in recent years. Various models, such as the fuzzy logic model [11], the binary logit model [12], and the regression analysis model [13], were applied in numerous circumstances [14]. However, limited study has been developed to evaluate LOS within the AT according to the most critical facility [15–17], that is, the PGS.
In this research, an analysis of the characteristics of the PGS within the AT was conducted. The numerical simulation combining pedestrian features, terminal environment, and signs’ location was carried out. In the description of pedestrians’ herd behavior features, conditions that satisfy pedestrian self-organization behaviour are supplied. Considered for the efficiency, reliability, and the characteristics in airport terminal, the cellular automation (CA) model is used to realize the environmental condition in AT, based on which, the guiding signs location model is formulated according to the crowd conflict and congestion conditions determined via CA.
The rest of this paper is outlined as follows. Section 2 describes the issue of pedestrian guiding sign locating optimization and the application condition for the pedestrian simulation model. Section 3 builds the characteristic model of pedestrian guiding signs. Section 4 presents the self-organizing characteristic model for the pedestrian. Sections 5 and 6 discuss the influence of guiding signs on the pedestrian. Model applications are described in Section 7. Section 8 summarizes the research results and discusses future research directions.
2. Problem Description
As showed in Figure 1, the optimization framework for setting up guiding signs within an AT is divided into 3 parts: the initiation process, the model selection process, and finally the simulation and assessment process.
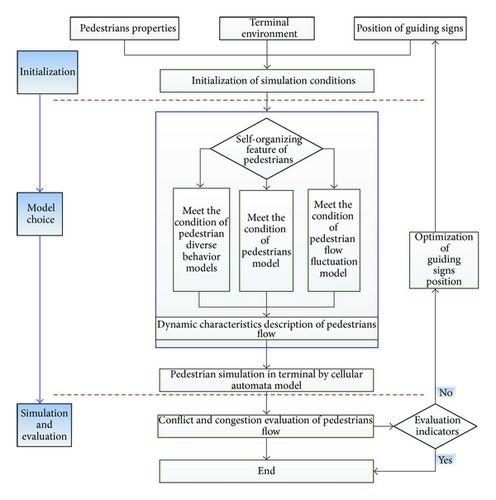
There are three parts in the optimization method of PGS: initialization, model choice, and simulation and evaluation. During the initiation process, we initiate the simulation conditions, terminal environment, and guiding signs locations as numerical models. In the description of the crowd situation, the corresponding crowd simulation model will be adopted through judging the condition satisfying pedestrian self-organizing characteristic embedded in CA. Finally through the assessment of the crowd conflicts congestion resulting from simulation, we optimize the guiding signs’ location.
3. Pedestrian Guiding Sign Characteristic Model
Generally, there are two main factors to affect the information perception of PGS: color features and contour perception. In order to describe the pedestrian cognitive behavior at PGS on color features in the simulation process, we extract significant characteristic through PGS’s color features (hue, saturation, and luminance) in terminal and get the weight of comprehensive salience by eye movement experiment and then add the perception features above to pedestrian agent.
3.1. Characteristic Extraction of the Outline Features of Pedestrian Guiding Sign
- (1)
Hue contrast: HP(x, y) represents the hue angle of the P coordinate of PGS images; thus the hue contrast of coordinates (x, y) could be represented as
()where NP denotes the pixels in the image P, that is, ∑x∈P,y∈PHP(x, y)/|NP| is the average hue angle of pedestrian boot logo images, and denotes pixel (x, y)’s hue contrast degrees, so . - (2)
Saturation contrast: SP(x, y) represents the saturation value of pedestrian boot logo image coordinates (x, y), so the saturation contrast of the coordinates (x, y) is
()where ∑x∈P,y∈PSP(x, y)/|NP| is the average saturation of the pedestrian boot logo image. is the saturation contrast degree of the pixel (x, y), so that . - (3)
Luminance contrast: VP(x, y) represents the luminance value of the PGS image coordinates (x, y), so that the luminance contrast of the coordinates (x, y) could be calculated as
()where ∑x∈P,y∈PVP(x, y)/|NP| is the average saturation of the PGS images and is the luminance contrast degree of pixel (x, y), and then we have .
3.2. PGS Contour Boundary Judgment
- (1)
initialization x = 0 and y = 0;
- (2)
x : = x + λX;
- (3)
if x > XP, then go to (5); otherwise continue;
- (4)
after working out the hue, saturation, and luminance contrast degree value of two positions of (x, y) and (x − λX, y), the contour boundary region could be easily determined. Meanwhile, we classify each position (x, y) into the contour boundary points set B, highlighting the significance degree in the region enclosed by four points (x − λX, y − λY), (x − λX, y), (x, y), and (x − λX, y), and then go to Step (2);
- (5)
y : = y + λY;
- (6)
if y > YP, end the process; otherwise x = 0, go to Step (2).
3.3. PGS Contour Feature Perception
- (1)
We sort the outermost points of the contour boundary points set according to the order of high to low in coordinate Y. In addition, we set the X coordinates under the same Y coordinate from low to high to obtain a new boundary points sequence B′ = (d1(x1, y1), d2(x2, y2), …, dn(xn, yn)), where di(xi, yi) i = 1,2, …, n represents the points in the sequence.
- (2)
Let ηb represent the boundary interference noise threshold of the landside guiding signs contour feature and scan the area within a radius around all points in the collection C; all the adjacent points into region are displayed in prominent significant degree.
- (3)
Use the Hough transform to identify the area after eliminating the interference above and detect the contour boundary in the image.
- (4)
Different shapes of figure, such as irregular figure, equilateral triangle, and circle and rectangle, are taken as the basis of the degree of influence of the PGS on the pedestrians.
4. Building Pedestrian Self-Organizing Characteristic Model
4.1. Pedestrian Distributary Behavior Model
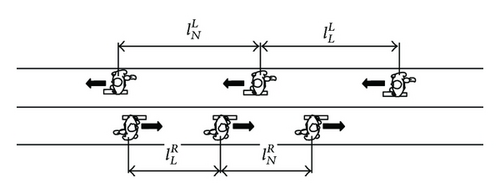
Crowd on the opposite direction will form an ordered stream which will not take much of the space in the opposite direction. Pedestrian behaviors in an AT mainly include decelerating and avoidance. With no distributary as well as communication with others, the pedestrian will automatically form the opposite marching stream. The number of the conflicting streams depends on the width and length of walking space, input, and output of the crowd and the waving and interference among the streams, which is the most typical example of self-organization. This kind of distributary reduces the resistance and conflicts from the contradictory stream, while the average speed and marching efficiency can be maximized. When two opposing streams meet, narrow paths could be formed at first. As time flows, pedestrian streams will become wider in order to reduce “friction” from the opposite direction which will get people on the same side to move faster and more fluently. The pedestrian stream distributary will also be autocanalized. Furthermore, the application condition for pedestrian distributary behavior model is that there are pedestrians walking oppositely in easily recognizable streams.
- (1)
If and , pedestrian flows cannot be formed both in the forward and reverse direction. Pedestrians will walk freely or in a turbulent state. denotes the lower threshold of the forward pedestrian flow. denotes the lower threshold of the reverse pedestrian flow.
- (2)
If and , orderly pedestrian flows will be formed in both forward and reverse direction, in which the mutual interference between the pedestrian is few. denotes the upper threshold of the forward pedestrian flow. denotes the upper threshold of the reverse pedestrian flow.
- (3)
If and , the orderly flow of the forward pedestrian flow expands with step λR. The orderly flow of the reverse pedestrian flow decreases in step λL.
- (4)
If and , the orderly flow of the reverse pedestrian flow expands with step λL. On the other hand, the orderly flow of the forward pedestrian flow decreases with step λR.
- (5)
If and , the orderly flow of the reverse pedestrian flow tends to expand. The orderly flow of the forward pedestrian flow tends to decrease. Moreover, if and , the orderly flow of the forward pedestrian flow tends to expand. The orderly flow of the reverse pedestrian flow tends to reduce. Whether the pedestrian flow expands or decreases depends on the parameters , , , and .
4.2. Model of the Pedestrian Flow Fluctuation
Let a(k, t) represent the accelerated velocity of the k-type pedestrian at the time t. The general acceleration formula of the kth type pedestrian at time t + 1 can be expressed as , where v(k, t) denotes the velocity of kth type pedestrian at time t. Δv(t) denotes the current velocity difference of the pedestrian and the front pedestrian. Δx(t) denotes the distance between the pedestrian and the front pedestrian. ω1(k, p) denotes the influence coefficient of the pedestrian’s position p ( = 1, 2, 3 denote the head, the middle, and the end, resp.) among the group of pedestrians. ω2(k) represents the influence coefficient of the pedestrian’s accelerated speed. ω3(k) represents the impact of speed difference between current pedestrian and the front pedestrian of his acceleration. ω4(k) represents the impact of the distance between current pedestrian and the front pedestrian of his acceleration. As a result, we can get the pedestrian’s speed at the time t + 1 as v(k, t + 1) = v(k, t) + a(k, t + 1), according to which, we can easily obtain the position of the pedestrian in the next moment.
4.3. Pedestrian Herd Behavior Model
Conformity is the act of matching attitudes, beliefs, and behaviors to group norms when an individual acts on his own. Even if a reasonable person knows that other people are in conformity, he would participate and take similar actions. If a pedestrian is unfamiliar with the terminal environment, unclear on the routing selection, he will lose confidence in his perception and judgment, taking the majority’s perception and judgment as his private grounds unconsciously, losing personal judging. In order to increase accuracy, people prefer to be with other people. Nevertheless, this kind of conformity will often cause congestion at the exit. This paper will build models on conformity in order to emulate the situation of dispersing the congestion at the exit.
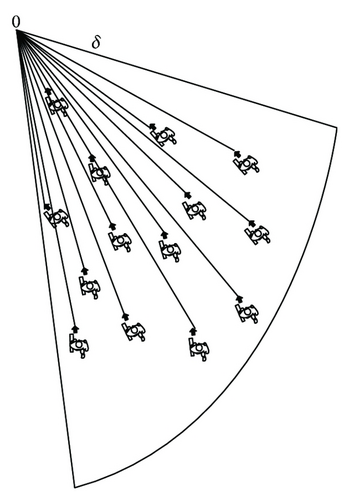
Herd Behavior Generation Condition. To generate herd behavior, certain conditions need to be achieved in the population size and the moving direction, in a certain view field within the threshold δ, as shown in Figure 3 the pedestrian density in the target direction of O is ρ, if ρ > ρc, and ∑k∈S(δ)v(k, t) · tanθo(k, t) > Vc that denotes that insiders walking in this region meet the herd behavior model conditions, in which ρc denotes the minimum pedestrian density when herd behavior occurs, S(δ) denotes the area of the field of view δ, and denotes the speed of the pedestrian k at time t, which denotes the angle between the speed direction and the target O.
4.3.1. The Speed of Herd Behavior
ve(k, t) represents the desired speed of the k class pedestrians at time t, then ve(k, t) = [1 − p(k, t)]vn(k, t) + p(k, t)vmax(k, t), vn(k, t) denotes the normal speed of the k class pedestrian at time t, vmax(k, t) denotes the possible maximum speed of the k class pedestrians at time t, and p(k, t) denotes the degree of urgency of the tasks of k class pedestrians at time t; it is between 0 and 1. Under the premise of getting the desired speed, we can obtain the speed at the next time based on the current and the desired speed; v(k, t + 1) = v(k, t) + ve(k, t). η, v(k, t) and v(k, t + 1) denote the speed of the k class pedestrians at time t and t + 1. η denotes the coefficient of acceleration and deceleration.
4.3.2. The Direction of Herd Behavior
- (1)
If π/2 < θo(k, t) ≤ 3π/2, the direction of pedestrian is free of the impact from the herd behavior patterns. That is, θo(k, t + 1) = θo(k, t) + ωr, where ωr is a smaller random number.
- (2)
If θo(k, t) ≤ π/2 or θo(k, t) > 3π/2, the direction of the pedestrian is in relation with both the walking speed and the density of pedestrians. The adopted rule is θo(k, t + 1) = θo(k, t) + ω(ρ(t), v(k, t)), where ρ(t) denotes the pedestrian density in the pedestrian’s vision range at time t. ω(ρ(t), v(k, t)) denote the adjusted coefficient of the pedestrian’s walking direction of the conditions of ρ(t) and v(k, t).
5. Influence of PGS on Pedestrians
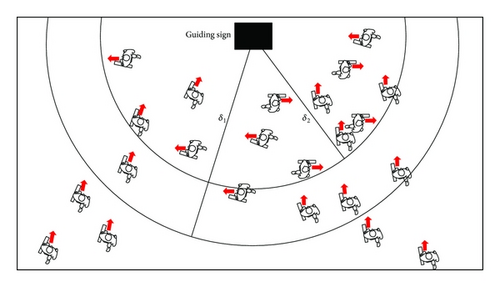
Guiding information intensity shows the impact level that guiding signs have on the pedestrian in the specific area. The influence level has a connection with the guiding distance, the guiding information, and the guiding destination. As it is shown in Figure 4, area δ1 refers to the area where guiding signs have effects on optical field. It means that, within the scope of δ1, people could see the guiding sign and probably approach their destination. On the other hand, δ2 shows the guiding effect area. It means that, in this area, people confirm whether the signs could guide.
6. Solution to Model Simulation
All the models above will be used in this part to describe the actual procedure in airport.
6.1. Checking-In Procedures Module
6.1.1. Choice of Cellular
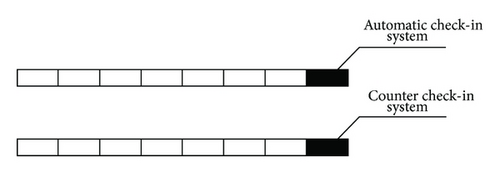
CA model was introduced here to describe the checking-in procedures. Every line in front of a checking-in will be represented by a line of cellular. The beginner of the list is the checking-in counter. Here, the counter includes the automatic machine and the checking-in counter, which are shown in Figure 5.
6.1.2. Construction of Cellular
As is shown in Figure 5, every cellular in the line represents a passenger walk-in. The front of the line is the checking-in counter. The automatic checking-in will cost a random amount of time, the average of which will be 30 s. The check-in counter will be used up a random amount of times too, the average of which will be 80 s.
6.1.3. The Running of Cellular Automation
The initial time for the simulation is set as t0. For each cellular, simulation length is 0.7 m, the length of the queuing region is 100 × 0.7 m, and the walking speed of the passenger is set to be distance of one cellular per second, that is, 0.7 m/s according to the given document. At the front of the queue, cellular is released every 30 s or 80 s to simulate the process of check-in formalities.
(1) Phase 1: Cellular Initialization. Initialize empty one-dimensional cellular. One-dimensional cellular queue produces the number of the tourists needing to register corresponding to each simulation step based on the module of the side lane, parking lot, public transportation, and the passenger capacity distributed over time which needs to register output by the module of side waiting lounge.
(2) Phase 2: The Running of Cellular Automation
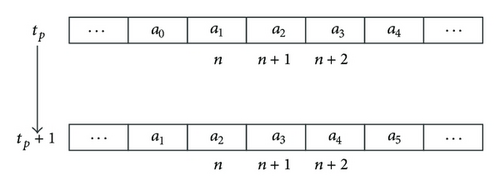
(a) Running Principle. Cellular Automation will be used to simulate the situation that passengers check in system. Each simulation moment is one step size; the cellular automata run at a constant speed v = 1, as showed in Figure 6.
(b) Rules for Passengers Changing a Line. When a passenger finds extra lines are shorter than the one that he is waiting in, the passenger will get into the line he prefers, as is shown in Figure 7.

6.2. Security Checking Module
6.2.1. Basic Procedures
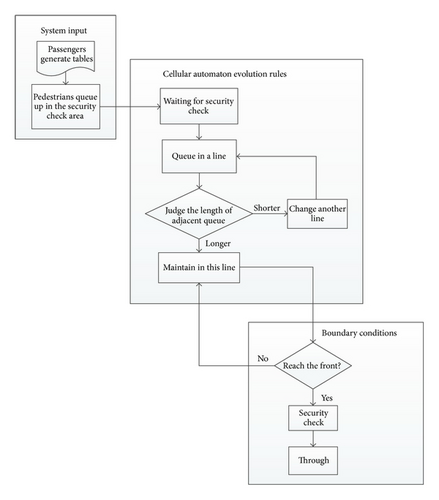
Security check is an important part of the simulation of pedestrians inside the terminal. The guiding sign of security check has a significant impact on pedestrians’ behaviors. Process is as shown in Figure 8.
6.2.2. Choice of Cellular
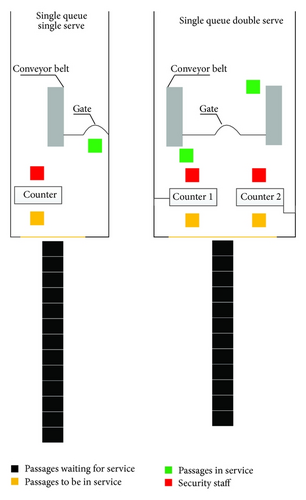
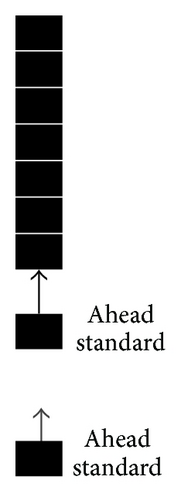
We show every waiting line in security checking area as a line of cellular. In the simulation, security procedures are separated into two types: single queue single serve (SQSS) and single queue double serve (SQDS) (as shown in Figure 9). Correspondingly, the first one or two cellulars represent the passengers taking security checking.
6.2.3. Consistence of a Cell
In the simulation process, each cell represents an area of 0.7 m × 0.7 m in the security check area. As shown in Figure 10, each passenger waiting for the security check or being checked occupies a cell, corresponding to the two situations of single queue single check and single queue double check. The first one or two cells represent passengers taking security checking. Passenger walking speed is set to 0.7 m/s in accordance with the applicable documents, which denotes that passengers move forward the distance of a cell’s length per second.
6.2.4. The Running of Cellular Automation
In this simulation, the maximum queue length is set at 50 × 0.7 m, the simulation step is 1 second, and the total simulation time duration is 4 hours.
(1) Phase 1: Cellular Initialization. Maximum queue length and the gaping security check counter number n form a 50 × n cellular space, representing a complete security queuing area; at the initial time the cells in the entire cellular space are not occupied.
Thus, the 300 × n matrix is generated according to the total number of passengers being checked every five minutes (no airline distinction), that is, the normal distribution matrix of the passengers coming into the security check area within five minutes. The next 300 simulation steps (5-minute simulation time) read the matrix line by line. All the passengers coming into the security check area within five minutes enter the security queuing area randomly during the simulation time.
(2) Phase 2: The Running of Cellular Automation
(a) Basic Evolution Principle. The basic cellular evolution rule is, if the adjacent cellular in front of the cell is empty, then the cell moves forward a position. This evolution rules can be applied to the following situations: first, passengers entering the security queuing area but not yet coming into a queue; second, passengers waiting in a queue and the neighbor queues are not shorter than the one of the passengers. The premise of evolution in accordance with such rules which does not allow jumping phenomenon.
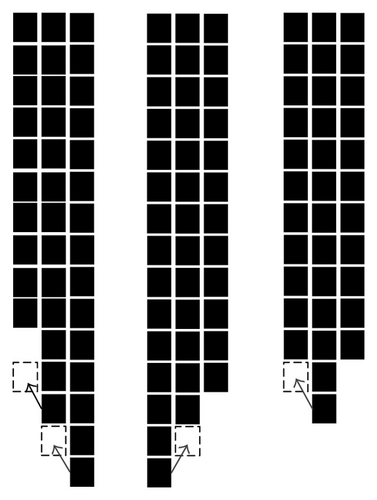
(b) Rules of Passenger Changing a Line. If there is one team shorter that the other in two neighboring lines and the corresponding cellular to the passenger is at the same time empty, then the passenger in the corresponding cellular will change from the current queue to the shorter one; if both sides of the two adjacent queues are shorter than the current queue the passenger is in and the corresponding cellulars in both queues are empty, the passenger will choose to change into one shorter queue randomly. Details are shown in Figure 11.
(c) Boundary Condition. The hypothesis is that all passengers pass through the security. After the passenger at the head of the queue passes the security check, it denotes the time that the corresponding cellular occupies this position reaches the time of the security check, so the passenger will leave the system through the boundary.
6.3. Airport Lounge Module
6.3.1. Inner Airport Lounge Module Cellular Automation Model
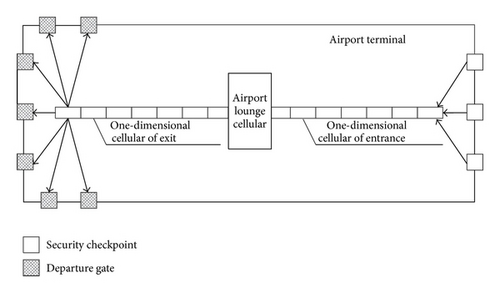
Inner airport lounge is regarded as a single cell, several security check is gathered as an entrance—a one-dimensional cellular automata l connected to the cellular of an airport lounge. Boarding channel exits are summarized as the exit and seen as one-dimensional cellular connected with the cellular in the waiting hall. The result is the construction of one cellular automaton model which has a single entrance and a single exit and is connected to a single one-dimensional cellular.
6.3.2. Consistence of Cellular
As showed in Figure 11, the one-dimensional cellulars at the entrances are all composed of numerous cellulars. Each cellular represents the number of passengers going through all the security checkpoints at a simulation step t1. The value of the cellular is the number of the group of people.
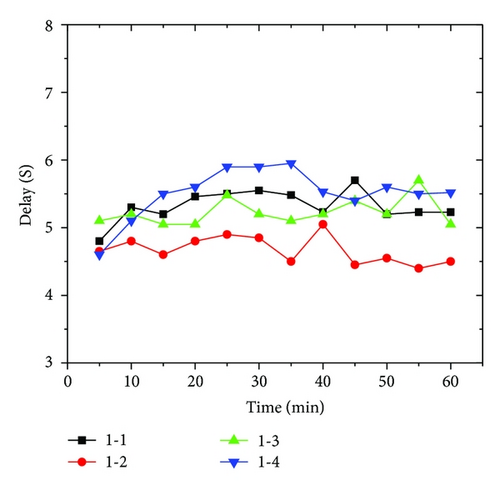
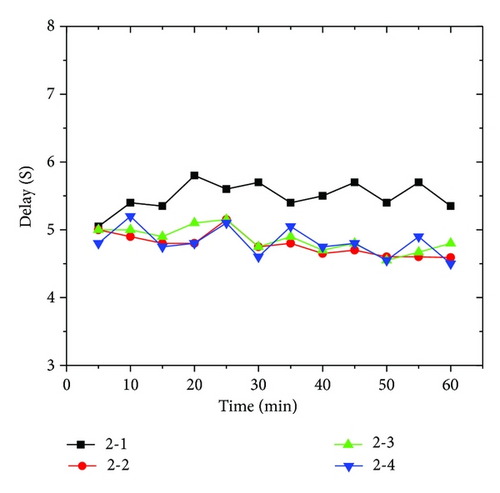
The one-dimensional cellular at the entrances initialized with the unit of the simulation step, in accordance with the passengers output by the security check module for the distribution of time. The one-dimensional cellular with the exit starts boarding half an hour earlier according to the flight schedule departure time. The one-dimensional cellular is initialized according to the average delay of 4–6 seconds per passenger while getting through the export.
6.3.3. The Running of Cellular Automation
The number of people in the waiting hall is room_origin. The simulation time is tn step. The one-dimensional cellular people_come at the entrance is composed of 1 × tn cellulars. The cellular people_come (n) denotes the number of people passing the security check points into the waiting hall at the nth simulation time. The one-dimensional cellular people_out of the export is composed of 1 × tn cellular and the cellular people_out denotes (n) the number of people leaving the waiting hall and starting boarding at the nth simulation time.
(1) Phase 1: Cellular Initialization. After the initialization of the empty one-dimensional cellular, according to the output number of passengers distributed over time by security check module, the one-dimensional cellular people_come obtained the number of arriving passengers a1, a2, a3, …, corresponding to each simulation step people_come (n) people_come (n + 1), people_come (n + 2)…, as Figure 12 shows. According to the flight schedule departure time, namely, starting boarding half an hour earlier rule and the average delay of each passenger passing the export, we initialize the export one-dimensional cellular, getting the number of people b1, b2, b3… which leave the waiting hall and start boarding corresponding to each simulation step people_out (n), people_out (n + 1), people_out (n + 2),…, as Figure 13 shows.

(2) Phase 2: The Running of Cellular Automation
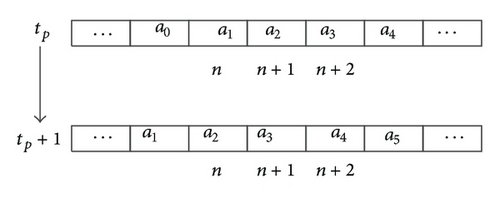
(a) Operating rules: the cellular automaton simulates the situation of passengers entering or leaving the waiting hall. Each simulation time is one step. Therefore, the cellular automaton runs at a constant speed v = 1. So cellular changes from the simulation time tp to tp + 1 as shown in Figure 14.
7. Model Application
7.1. Simulation Environment
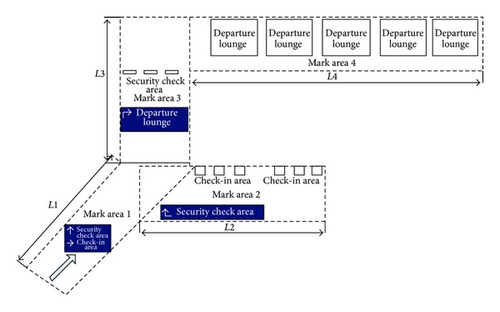
A simulation scene consists of passage, checking-in area, security check, and the waiting area. The normal procedure is passage—checking-in counter—security check—waiting—boarding, several of which need to be guided by signs. If signs were not set up correctly, pedestrians will be held up and all procedures will take longer. This will lay pressure on terminal’s bearing. In simulation scene, lengths of L1, L2, L3, and L4 are 40 m, 50 m, 50 m, and 100 m.
Transportation facilities chart inside the emulated terminal are shown in Figure 15. PGS adopt suspension type. The number and the height will be set up in accordance with requirements of different experiment.
7.2. Simulation Experiment Design
Based on the analysis, the intensity and height of transportation signs have an influence on pedestrians’ routing selection, which is also related to the number of pedestrians. This thesis paper separates the abovementioned variations into two parts: guiding signs number optimization and guiding signs height optimization. The simulation experiment is shown in Tables 1 and 2.
| Order | Height | Rate of flow | Intensity |
|---|---|---|---|
| (meters) | (people/hour) | (/50 meters) | |
| 1 | 2.3 | 1000 | 3 |
| 1500 | |||
| 2000 | |||
| 2500 | |||
| 2 | 2.6 | 1000 | 3 |
| 1500 | |||
| 2000 | |||
| 2500 | |||
| 3 | 2.9 | 1000 | 3 |
| 1500 | |||
| 2000 | |||
| 2500 | |||
| 4 | 3.2 | 1000 | 3 |
| 1500 | |||
| 2000 | |||
| 2500 | |||
| Order | Intensity | Rate of flow | Height |
|---|---|---|---|
| (/50 meters) | (people/hour) | (meters) | |
| 1 | 2 | 1000 | 2.6 |
| 1500 | |||
| 2000 | |||
| 2500 | |||
| 2 | 3 | 1000 | 2.6 |
| 1500 | |||
| 2000 | |||
| 2500 | |||
| 3 | 4 | 1000 | 2.6 |
| 1500 | |||
| 2000 | |||
| 2500 | |||
| 4 | 5 | 1000 | 2.6 |
| 1500 | |||
| 2000 | |||
| 2500 | |||
7.3. Result of Simulation Experiment
7.3.1. Experiment 1 Result of Simulation
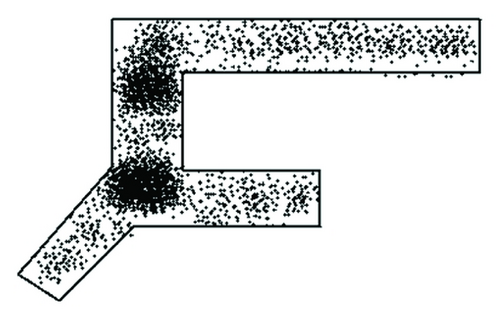
Based on simulation experiment number 1, terminal space variation in three minutes is shown as Figures 16 and 17 (h = height; q = rate of pedestrian flow).
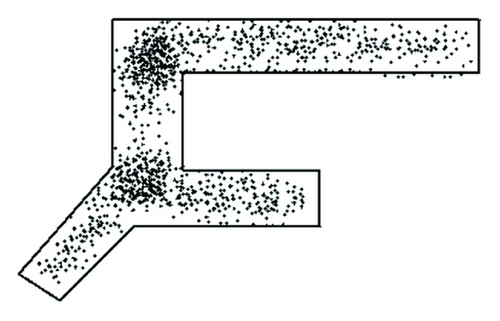
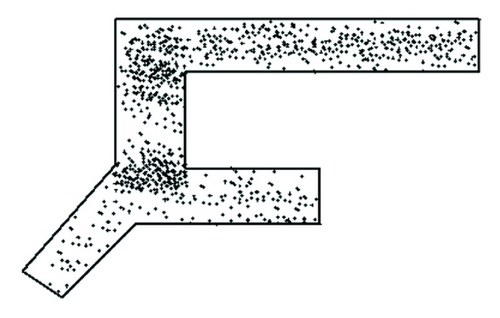
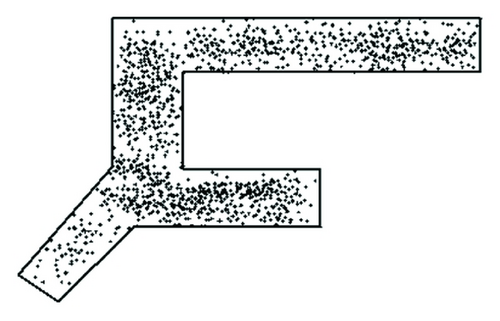
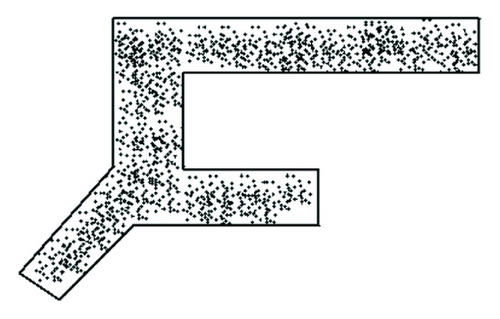
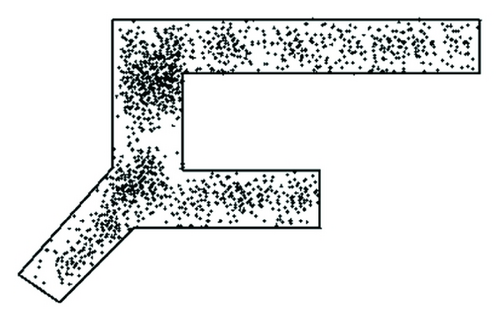
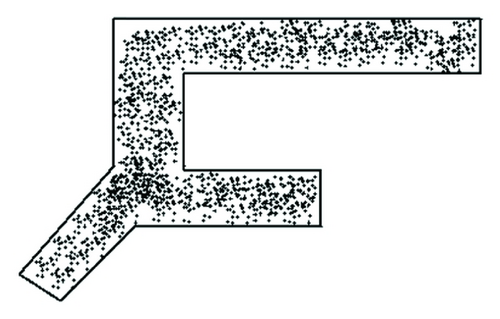
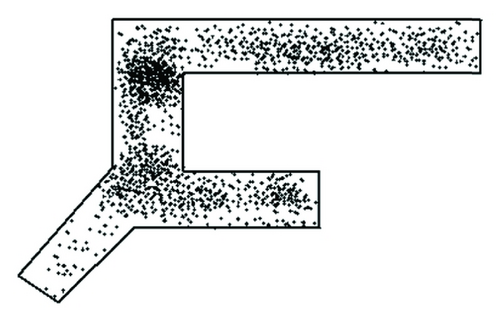
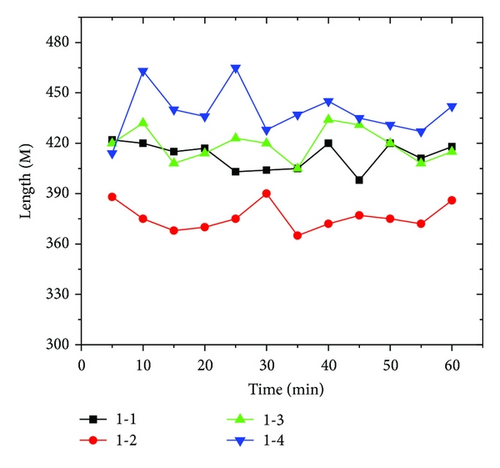
Under the condition of experiment number 1, the contrast Chart between the delay for signs of identification and the travel length to the airport lounge is shown as in Figure 18.
7.3.2. Simulation Result from Experiment Number 2
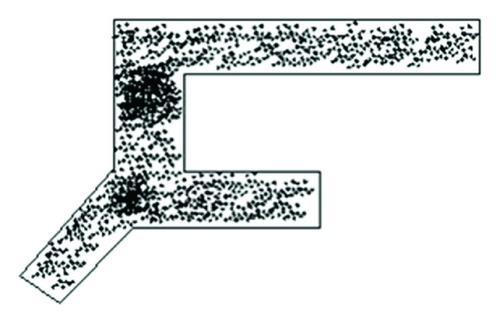
Conducted under the conditions of experiment number 2, terminal space variation for 3 minutes is shown as Figure 19 (ρ = intensity, q = rate of pedestrian flow).
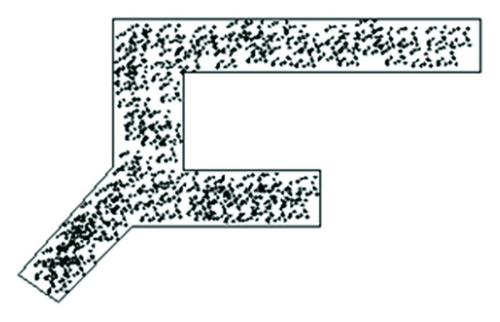
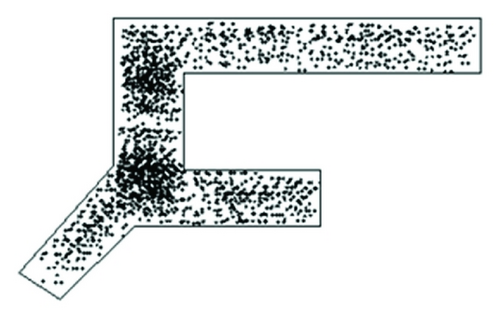
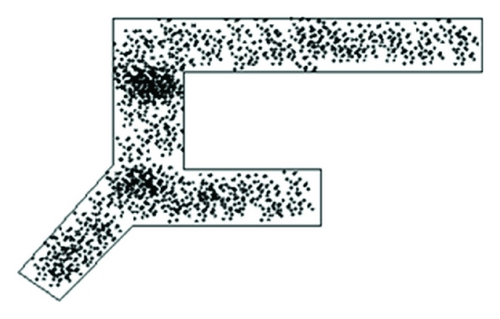
Under the condition of experiment number 2, the contrast Chart between the delay for signs of identification and the passage length to the airport lounge is shown as in Figure 20.
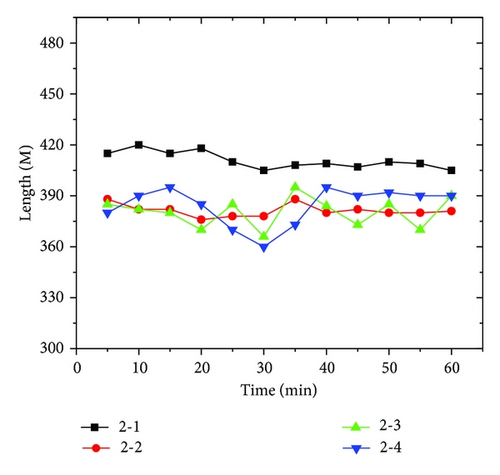
7.4. Analysis of the Result of the Simulation Experiment
(1) From the simulated inner space status chart resulting from experiment number 1, when the rate is 1500 p/h, the height of guiding signs does not have a substantial influence on pedestrians. No obvious grouping is observed for routing decision-making area under different heights. When the rate of pedestrian flow is 2500 p/h, different heights have effects on routing decisions. Grouping level is different at different locations under different conditions. Either too high or too low will cause people to stay with the routing selecting area. From simulation experiment number 1, it is found that a difference of routing selection comes from the guiding sign heights. Under this condition of experiment number 1, the recommendation to the guiding sign heights is 2.6 m.
(2) From the simulated inner space status chart resulting from experiment number 2, when the rate is 2500 p/h, discrete intensity levels have effects on routing selection and differences are found in grouping level at varied positions under different conditions. When the intervals are too large, pedestrians will spend more time looking for signs and also will possibly make a mistake choosing direction due to lack of sign. And furthermore, local space of pedestrians will happen. When the intervals are too small, pedestrians might have problems or additional burdens in identifying signs. From the above, the recommended guiding sign intensity is 3 signs per 50 m.
8. Conclusions
In this paper, an optimization method of PGS is formulated. Pedestrian traffic simulation procedures within the AT are outlined. Firstly, according to features of the PGS’ appearances, the boundary judge and feature perception models are built in order to simulate the properties of the pedestrian. Then, a self-organization model is formulated to determine herd behavior features of the pedestrians. Thirdly, the CA model is used to simulate the crowd situation of the pedestrian within the AT. The result demonstrates that the method in this paper could analyze the influence of the height of PGS on routing decision-making of the pedestrian in AT. A reasonable height for the PGS is recommended for using in the AT according to the numerical simulation result. Meanwhile, the model could describe the influences of PGS’s density on the pedestrian routing decisions. We hope that the models presented in this paper could provide additional guidance for optimizing the interior traffic facilities within the AT.
Future research is directed towards developing methods to solve the guiding signs optimization problem efficiently and widely. Moreover, practical applications of the approach will be taken into account, such as the route choice of guiding by acoustic identification and other guiding facilities.
Conflict of Interests
The authors declare that there is no conflict of interests regarding the publication of this paper.
Acknowledgment
The research is supported by the National Basic Research Program of China (no. 2012CB725403).


