XRD and DTA Analysis of Developed Agglomerated Fluxes for Submerged Arc Welding
Abstract
A unique study of structural and chemical analysis of crystalline phases in developed agglomerated fluxes was carried out. Thirty-two fluxes were developed by using a mixture of oxides, halides, carbonates, silicates, and ferroalloys for submerged arc welding. The present paper focuses on only ten (out of thirty-two) fluxes which were analyzed by X-ray diffraction (XRD) to know the different types of oxides formed and changed in oxidation number of metallic centers after sintering process at around 850∘C. To know the effect of temperature over phase transformation and melting of different compounds, differential thermal analysis (DTA) was carried out from 1000 to 1400∘C. This study aims to know the quantity of ions present (percentage) and melting behavior of developed agglomerated fluxes for submerged arc welding process.
1. Introduction
The agglomeration method is used for flux preparation by using a mixture of oxides, halides, carbonates, silicates, and ferroalloys [1]. The chemistry of weld metal is always governed by the electrochemical changes at the weld pool flux interface because the important properties of submerged arc welding fluxes are the function of their physiochemical properties [2–5]. The important chemical reactions take place during heating of ceramic oxide which is the chemical reaction among the different phases [6], phase transformation of minerals [7], formation of crystalline phases [8], and chemical and structural characterization of crystalline phases in agglomerated fluxes for submerged arc welding were observed [9]. Therefore, the developed agglomerated fluxes can be analyzed to know their crystal structure observed during the rise of temperature. The objective of this analysis is to know the crystalline phases as well as to quantify the different types of ions and their distribution in developed agglomerated fluxes (AGF1101–AGF1110) by X-ray diffraction (XRD) and differential thermal analysis (DTA) is used to know the peaks of endothermic temperatures.
2. Experimentation
In the present study, the fluxes have been designed on the basis of binary and ternary phase diagrams for different oxide and fluoride systems [10] and formulated by using response surface methodology technique [11, 12]. In these fluxes, varying amount of oxides and fluorides were added to know the crystalline phases as well as to quantify the different types of ions and their distribution in developed agglomerated fluxes (AGF1101–AGF1110) by X-ray diffraction (XRD) and differential thermal analysis (DTA) was carried out to know the peaks of endothermic temperatures.
CaO-Al2O3-SiO2-based flux systems have been selected for the study as these are the most widely used fluxes at the commercial level. The details of basic constituents, alloying constituents, and their percentage in the developed agglomerated fluxes are reported in Table 1.
| Basic constituents and alloying constituents | CaO | SiO2 | Al2O3 | MnO | CaF2 | MgO | NiO | Fe-Cr |
|---|---|---|---|---|---|---|---|---|
| Amount (wt %) | 20 | 35 | 10 | 5–10 | 10–20 | 5–15 | 0–10 | 0–10 |
After ascertaining the compositions and constituents of fluxes, they were prepared by agglomeration method by taking small batches (2 kg) of weighed quantities of powdered chemicals except binder and thoroughly mixed in a ball miller. The prepared granular flux was dried and baked in an electrically heated furnace for 3 hrs at 850°C. The dried flux was allowed to cool down to room temperature before storing it in a moisture free box. The XRD analysis was carried out by diffractometer with the monochromatic light wavelength 1.540600 Å (Cu Kα) for all developed agglomerated flux. The DTA was carried out in an Al2O3 crucible from 28 to 1400∘C at the heating rate of 10∘C/min. Alumina was used as a standard reference for differential thermal analysis.
3. Result and Discussion
3.1. XRD and DTA Analysis of Developed Agglomerated Fluxes
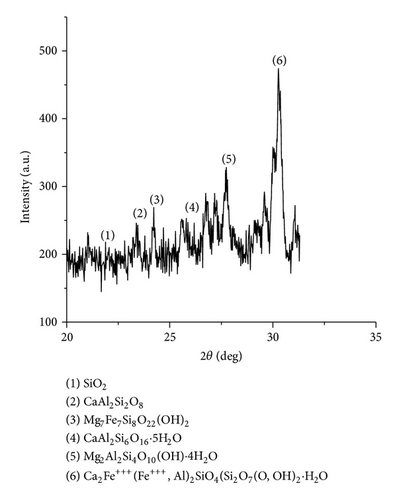
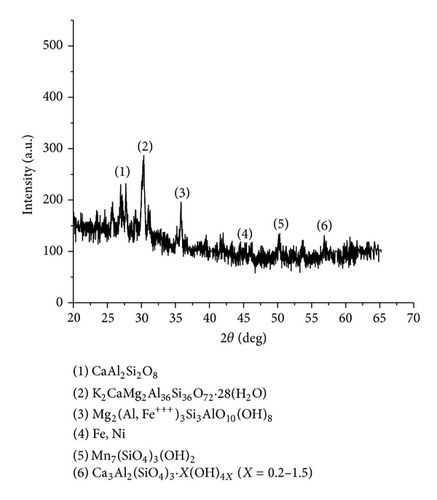
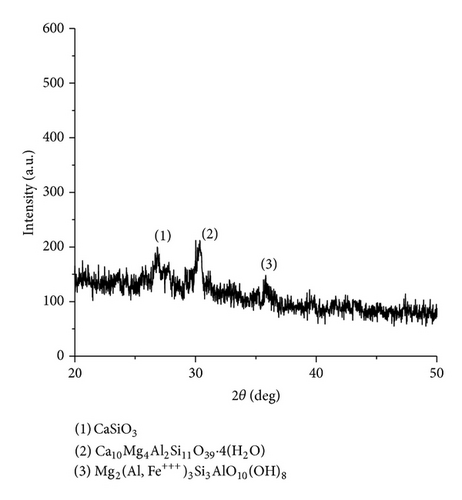
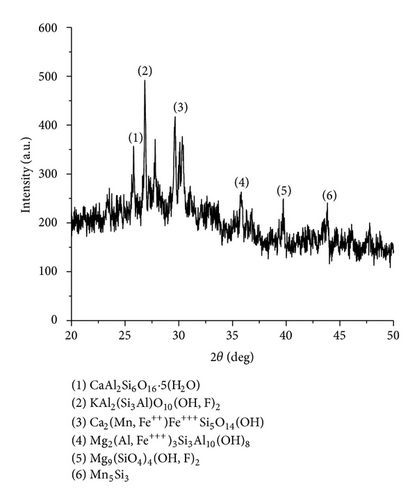
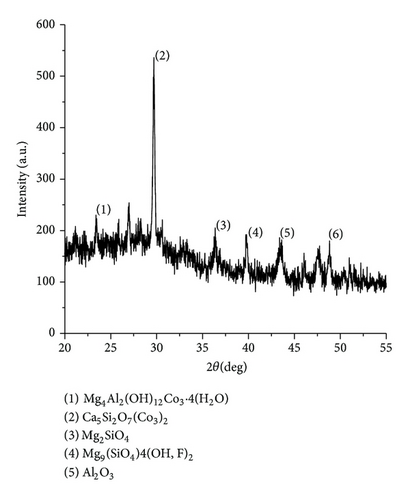
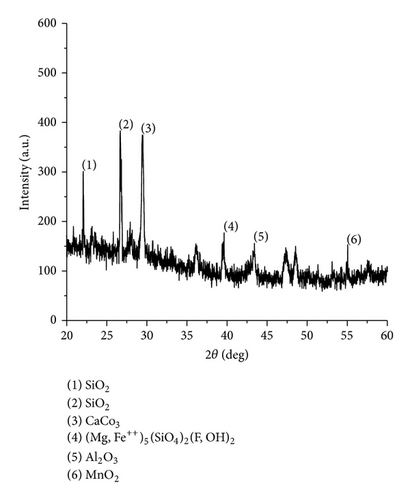
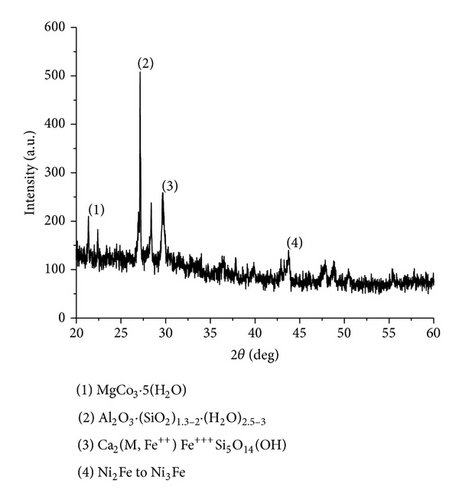
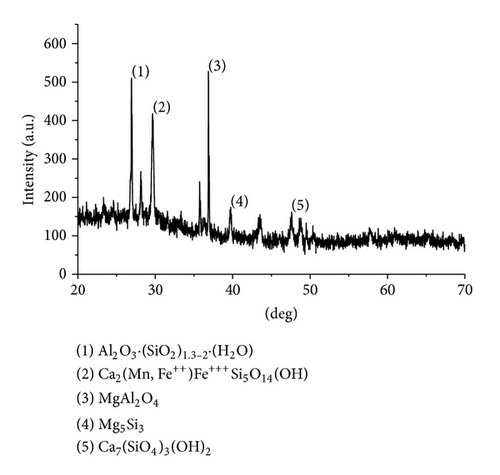
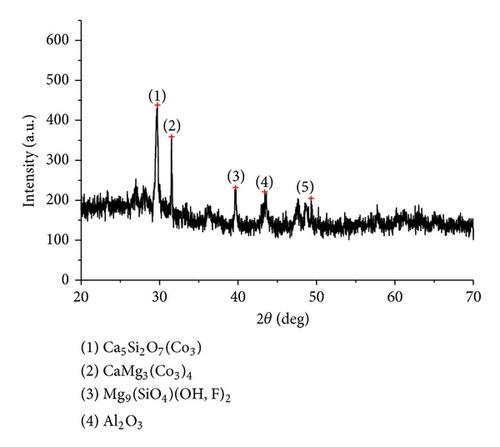
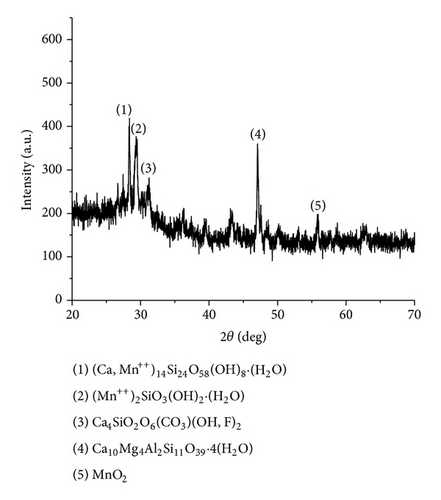
The XRD results of developed agglomerated fluxes are shown in Figures 1, 2, 3, 4, 5, 6, 7, 8, 9, and 10 and by these graphs, it has been observed that a number of crystalline phases are formed due to chemical interaction among ions with potassium silicate binder. The oxides like MnO, MgO, SiO2, Al2O3, and CaO were found in compound form, which means they do not react with one another. The names of different crystalline phases observed in XRD analysis along with their crystal structure were given in Table 2. The quantity of different oxides shown in Table 3 was based on XRD peaks with high intensity [13]. The development of different types of silicates and oxides is mainly due to mixing of potassium silicate during the agglomeration process.
| Flux number | Crystalline phase | Crystal structure |
|---|---|---|
| AFG1101 | CaAl2SiO8 (Dmisteinbergite) | Hexagonal |
| AFG1101 | Mg7Fe7Si8O22(OH)2 (Protoanthrophyllite) | Orthorhombic |
|
CaAl2Si6O16 · 5(H2O) (Epistilbite) | Triclinic |
| AFG1101 | Mg2Al2Si4O10(OH) · 4(H2O) (Palygorskite) | Monoclinic |
| AFG1101 | Ca2Fe+++(Fe+++, Al)2 (Julgoldite) | Monoclinic |
| AFG1102 | CaAl2Si2O8 (Svyatoslavite) | Monoclinic |
| AFG1102 | K2CaMg2(Al, Si)36O72 · 28H2O (Mazzite) | Hexagonal |
|
Mg2(Al, Fe+++)3Si3AlO10(OH)8 (Sudoite) | Monoclinic |
| AFG1102 | Mn7Si3O12(OH)2 (Leucophoenicite) | Monoclinic |
| AFG1102 | Ca3Al2(x = 0.2–1.5) (Hibschite) | Isometric |
| AFG1104 | KAl2(Si3Al)O10(OH, F)2 (Muscovite) | Monoclinic |
|
Ca2(Mn, Fe++)Fe+++Si5O14(OH) (Manganbabingtonite) | Triclinic |
|
Ca10Mg4Al2Si11O39 · 4(H2O) (Juanite) | Orthorhombic |
|
Ca5Si2O7(CO3)2 (Tilleyite) | Monoclinic |
|
Mg9(SiO4)4(OH, F)2 (Hydroxyl clinotumite) | Monoclinic |
| AFG1108 | Ca7(SiO4)3(OH)2 (Chegemite) | Orthorhombic |
| AFG1110 | Ca14 (Mn++)14Si24O58(OH) 8 · 2(H2O) (Truscottite) | Triclinic |
| AFG1110 | CaO · 3(Fe++, Mg, Fe+++)3Si4Al4O10(OH) 2 · 4(H2O) (Ferrosaponite) | Monoclinic |
| AFG1110 | Ca4Si2O6CO3(OH, F)2 (Fukalite) | Orthorhombic |
| AFG1105 | 2 (Chondrodite) | Monoclinic |
| Serial number | Oxides | Quantity of oxides present (wt.%) in developed agglomerated fluxes | |||||||||
|---|---|---|---|---|---|---|---|---|---|---|---|
| AFG1101 | AFG1102 | AFG1103 | AFG1104 | AFG1105 | AFG1106 | AFG1107 | AFG1108 | AFG1109 | AFG1110 | ||
| 1 | CaO | 8.29 | 12.48 | 28.10 | 5.76 | 11.47 | 9.33 | 4.89 | 17.21 | 14.65 | 24.53 |
| 2 | SiO2 | 58.80 | 31.16 | 42.38 | 5.71 | 21.19 | 38.57 | 21.79 | 31.27 | 12.65 | 33.12 |
| 3 | Al2O3 | 10.50 | 22.94 | 14.30 | 18.29 | 24.18 | 16.66 | 11.32 | 23.39 | 20.00 | 3.27 |
| 4 | MgO | 7.80 | 3.37 | 8.12 | 14.47 | 29.78 | 6.59 | 5.78 | 17.34 | 18.52 | 3.37 |
| 5 | MnO | 0.02 | 14.29 | — | 1.86 | — | — | 2.32 | 1.85 | — | 21.20 |
| 6 | NiO | 0.02 | — | — | — | — | — | — | — | — | — |
| 7 | FeO | 0.91 | 0.26 | 0.44 | 0.89 | — | 3.91 | 0.78 | 0.63 | — | 4.20 |
| 8 | Fe2O3 | 6.47 | 0.58 | 0.64 | 3.37 | — | — | 3.48 | 2.79 | — | 1.73 |
| 9 | Na2O | 0.04 | — | — | — | — | — | — | — | — | 0.48 |
| 10 | CO2 | — | — | — | — | 5.41 | 7.82 | 6.31 | — | 13.57 | 2.15 |
| 11 | MnO2 | — | — | — | — | — | 16.66 | — | — | — | — |
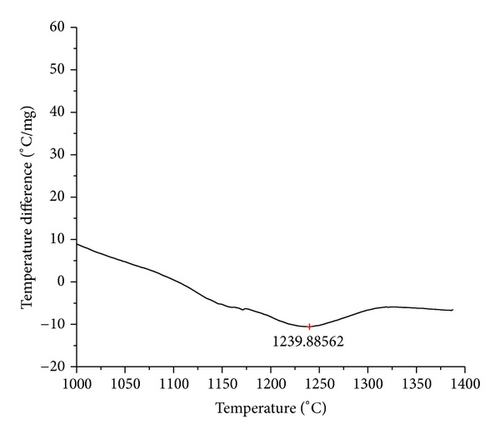
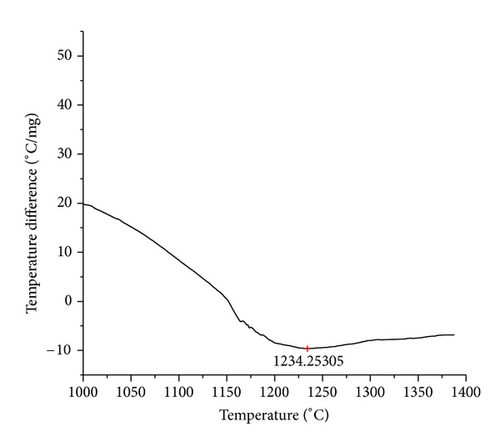
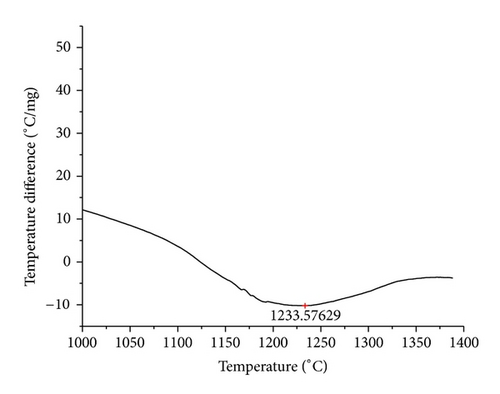
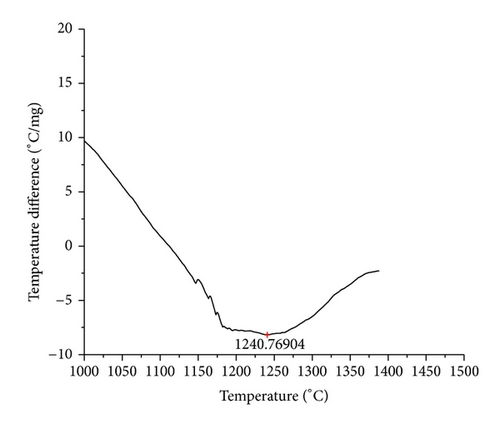
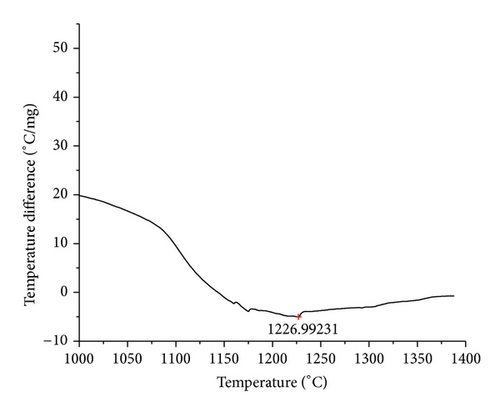
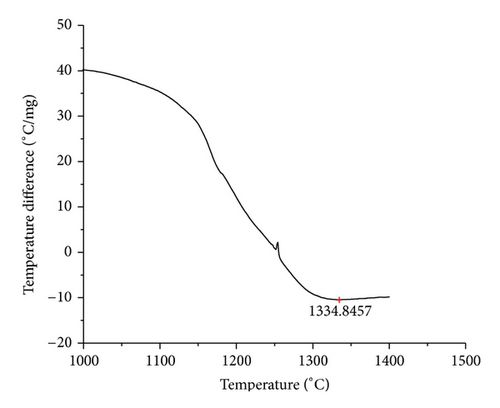
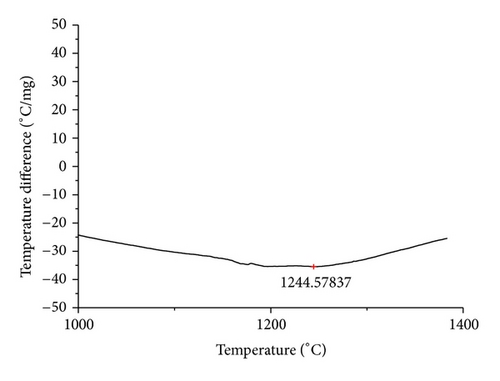
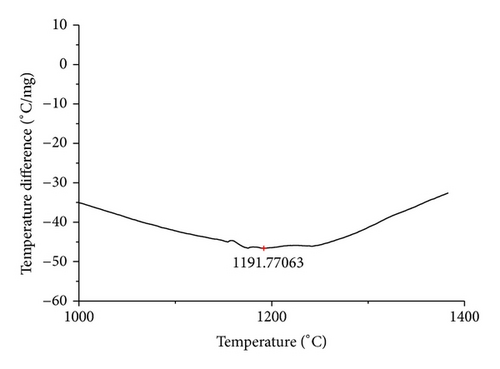
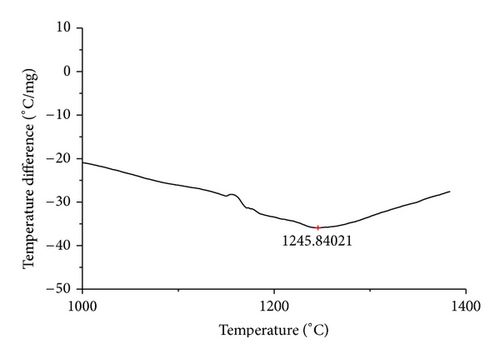
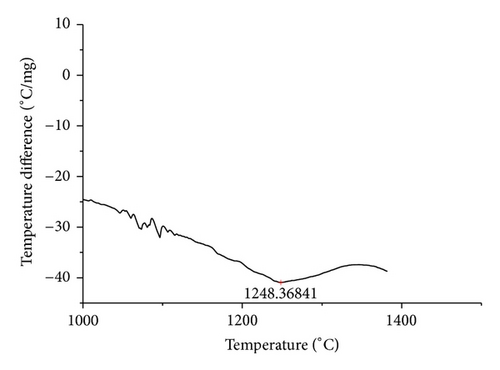
The curves of differential thermal analysis (DTA) are shown in Figures 11, 12, 13, 14, 15, 16, 17, 18, 19, and 20 and it shows that most of the oxides were stable oxides up to 1000∘C. The ranges of DTA curves were found between 1000 to 1400∘C. With a few exceptions, most of the reactions were endothermic in nature and the endothermic peaks were observed at different temperatures for different fluxes given in Table 4. The endothermic peaks were different for different fluxes because of their different chemical compositions. These endothermic peaks were comparable with the melting reaction of different crystalline phases for different fluxes. In some DTA curves, a zigzag behavior was observed due to gassing or blistering of the glass formation [14]. The anions generally present in the fluxes are O2− and F1−. The cations from the flux like Ca2+, Mg2+, Al3+, Fe2+, Fe3+, Si4+, Mn2+, Mn3+, and Mn4+ can react with oxygen and tetrahedral unit from the silicates formed in the fluxes. Since, calcium and magnesium ions have the largest negative heat of formation energy ΔGf, therefore, they react quickly with oxygen in the welding arch. There were changes in oxidation number in some cationic constituents like Fe2+, Fe3+, Mn2+, and Mn4+. In most of the fluxes, calcium was present which increases the stability of electric arc during welding. The viscosity of fluxes increases by the presence of corundum and SiO2 which are present in most of the fluxes. In most of the fluxes, it has been observed that the MnO and SiO2 are jointly present and increase the thermomechanical behavior of weld joint.
| Flux | Peaks of endothermic temperature (°C) |
|---|---|
| AGF1101 | 1239.89 |
| AGF1102 | 1234.25 |
| AGF1103 | 1233.58 |
| AGF1104 | 1240.77 |
| AGF1105 | 1226.99 |
| AGF1106 | 1334.85 |
| AGF1107 | 1244.58 |
| AGF1108 | 1191.77 |
| AGF1109 | 1245.84 |
| AGF1110 | 1248.37 |
4. Conclusion
The study identified the quantity of different ions present in the weld pool, and it also helps to know the different types of oxides and probable crystalline phases in developed agglomerated fluxes during submerged arc welding. Such types of studies are very much helpful to know the effect of compositions of fluxes on thermomechanical behavior of weld metal.


