Testing of the Structure and Mechanical Properties of Technical Titanium Joints
Abstract
The aim of the research was the titanium pipeline welding technology. The transformations of this material due to the influence of thermal welding were analysed. The basic purpose was to evaluate the properties of titanium joint areas. Pipe joints of various thicknesses were welded by means of TIG argon arc welding while applying the optimum and reduced gas flow intensities. The structure and mechanical properties of these joints were tested. Different test results were obtained for joints welded in these two conditions. Recommendations concerning the welding technology and the heat treatment of joints after welding were presented.
1. Introduction
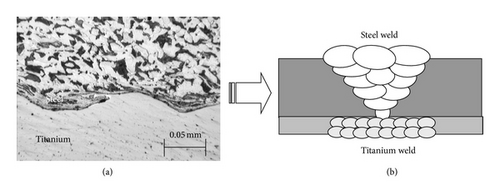
Titanium and its alloys occupy an important place among metal constructional materials due to their especially valuable physical and chemical properties [1–3] which include small specific gravity and big strength in normal and raised temperatures. These materials are highly resistant to atmospheric corrosion and various aggressive environments. Therefore, due to their properties, titanium and its alloys find multiple applications in construction of installations, pipelines, and chemical equipment [4–6], as, for example, a reactor made of an explosively clad steel titanium sheet (Figure 1) [7, 8] or a welded technical titanium pipeline.
Technical titanium in comparison to the chemically pure element is usually foul with oxygen, nitrogen, hydrogen, carbon, iron, silicon, and other elements. The amount of these impurities generally amounts to 0.2–1.2%. These tramp elements form with pure titanium respective binary diagrams of equilibrium systems (Figure 2) [9].
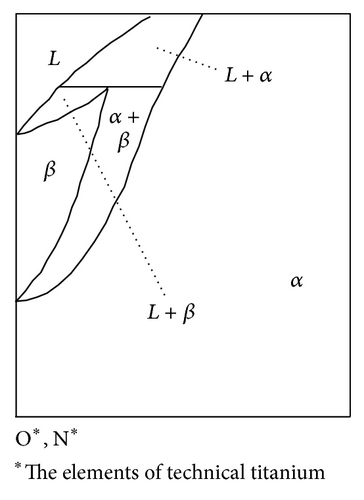
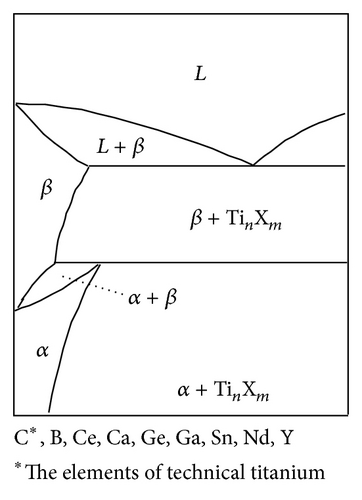
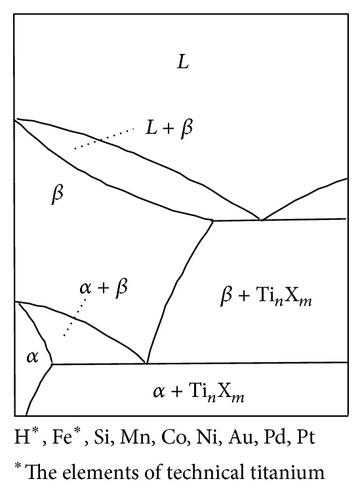
Technical titanium and titanium single-phase alloys α belong to one group. The content of elements stabilizing the phase β is small and does not exceed a boundary value in the phase α. Thus the structure of these alloys after exerting plastic strain and annealing consists mainly of the solid solution α (>95%).
In the case of pure titanium the temperature of the allotropic transformation Tiα⇌ Tiβ equals 1155.5 K. During heating, in these conditions, the unit cell Tiα with a hexagonal lattice transforms into the cell Tiβ which crystallizes into a regular centric lattice system. During cooling, a complete reverse transformation Tiβ⇀Tiα occurs. At small heating and cooling rates the transformation Tiα⇌Tiβ develops by means of nucleation of a new phase and an increase of nucleuses (diffusion). Heating of semifinished titanium products above the allotropic transformation temperature (α⇀β) always leads to the growth of grains independently of heating or cooling.
When cooling from the phase β stability temperature is fast, then the transformation Tiβ⇀Tiα becomes martensitic with shear mechanism (β⇀α′). Titanium martensite is a metastable phase, and it is formed as a result of the lattice strain [10]. The martensitic phase α′ crystallizes into a hexagonal lattice system and determines the supersaturated substitutional solid solution of elements in Tiα. Beside heating and cooling conditions, the martensite morphology depends on the initial heat and plastic treatment. Depending on structure, large areas with twin crystals and needles or plates with different arrangements typical of the phase α′ can be distinguished.
In the case of technical titanium the transformation Tiβ⇀Tiα takes place at a higher temperature ranging from 1133 to 1233 K. Its structure contains a small quantity of the phase β owing to hydrogen and iron, which are within their equilibrium solubility in the phase α. The particles of the phase β limit the plate growth of the phase α.
Titanium shows especially high affinity to oxygen in a solid and liquid state at temperatures above 773 K. Nitrogen increases titanium’s strength more than oxygen and carbon. Hydrogen increases titanium’s brittleness.
2. The Weldability of Technical Titanium
Due to its high thermal efficiency of remelting during welding, titanium undergoes a different welding thermal cycle as compared to steel. The basic problem concerns good plasticity of the welded joint which depends on the welded structure and the phase transformations occurring in the heat-affected zone at temperatures above the transformation α + β⇀β. The welding process requires high accuracy because of strong chemical activity of oxygen, nitrogen, and hydrogen in the heated joint area.
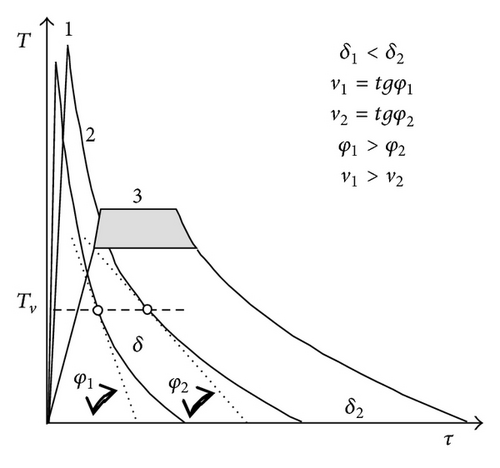
In the case of single-phase alloys α the growth of columnar crystals begins from the melted grains of the base material. The phase transformation β⇀α during cooling of welded joints enables the dendritic structure of the weld. The phase transformation of titanium and its physical properties determine the structural change in the various volumes of the heat-affected zone (Figure 3(a)). The heat-affected zone is characterized by nonuniform heating of each of the alloy volumes. It causes the heterogenous state of stress, strain, phase transformations, and structural changes. The differences in the cooling and annealing rates in the heat-affected zones for various thicknesses of the welded elements δ1, δ2 are presented in Figure 3(b).
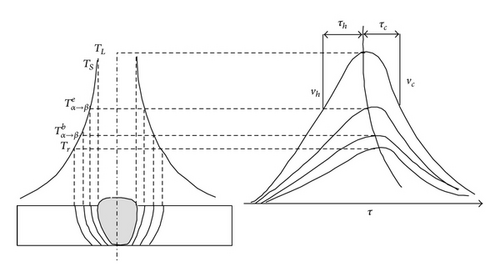
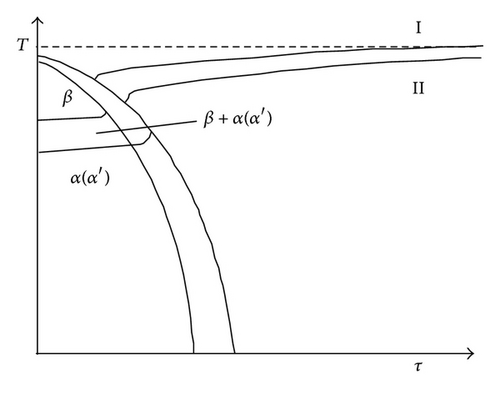
The heat-affected zone of a joint contains areas of incomplete weld penetration, a complete phase transformation, a partial recrystallization, and a recrystallization. In the first two areas grain growth occurs, as well as the segregation of elements and an increase in the gas content. Grain sizes depend on a maximum heating temperature, the exposure time to temperature above the phase transformation α⇀β, and the heating and cooling rates. The typical phase transformation diagram during the welding of technical titanium is shown in Figure 3(c).
The area of a partial recrystallization () (Figure 3(a)) shows a smaller grain growth, since the temperature range is small. The structure of this area consists of phases α + α′. The structure of the recrystallization area consists mostly of the phase α grains of a small diameter (the equiaxed structure) without any signs of phase transformations.
The recrystallization area gradually joins the base material structure. For the temperatures ranging from 623 to 663 K the heat-affected zone can include hydrides TiH separated at the grains boundaries, along the slip lines and the twin crystals. The welds including only elements stabilizing the phase α are of homogeneous structure consisting of the martensitic phase α′. The elements stabilizing the phase β improve the hydrogen embrittlement resistance in the joint.
The welding wire should have a specified strength and plasticity. The temperature of the phase transformation α⇀β in the wire material should always be higher than the temperature transformation in the base material. Thus the weld material should remain in the annealed state after carrying out the heat treatment of the base material.
The single-phase titanium α is characterized by good weldability. A change in the linear energy of welding little influences the plastic and strength properties of the weld and the heat-affected zone. The main factor determining the plastic properties of the weld is the cooling rate of these zones. For the alloys α after plastic strain, the important factor is also the exposure time of the base material to temperatures higher than the recrystallization temperature. The best plastic properties of welds were obtained when applying the average and high cooling rates at which the intensity of the grain growth is smaller.
For technical titanium various fusion welding methods are applied. The universal method is TIG argon arc welding [2]. The electron beam welding [11] and the electroslag welding [12] are also used.
In order to obtain the optimal mechanical and technological properties of welded joints made of titanium α they should be annealed at temperatures ranging from 823 K to 953 K. The soaking time is 0.33–1 h for the thickness of 2–50 mm [13]. Annealing should be carried out above the recrystallization temperature but below the allotropic transformation followed by air cooling. In order to avoid welding stresses underannealing should be applied at temperatures ranging from 723 K to 773 K using the soaking time of 0.5–4 hours.
3. Test Results
3.1. The Initial Material and Forming Joints
3.1.1. The Initial Material for Stub Pipes and the Filler Metal
The initial titanium elements for welding consisted of the segments of pipes with the outer diameter of 355.6 mm (14′′) and the thicknesses δ = δ2 = 8 mm, the 88.9 mm (3′′), and δ = δ1 = 3.05 mm.The chemical constitution and mechanical properties of the pipe material and the filler metal were in accordance with ASTM B862 Grade 2 and ER Ti2-AWS 5.16, and they are shown in Tables 1 and 2.
| δ | Chemical constitution, % | |||||
|---|---|---|---|---|---|---|
| O | N | C | H | Fe | Ti | |
| δ2 | 0.162 | 0.003 | 0.003 | 0.003 | 0.030 | Bal |
| δ1 | 0.110 | 0.006 | 0.012 | 0.008 | 0.060 | Bal |
| Filler metal | 0.090 | 0.005 | 0.010 | 0.005 | 0.030 | Bal |
| δ | Yield stress, MPa | Tensile stress σb, MPa | Elongation, εb, % |
|---|---|---|---|
| δ2 | 357 | 506 | 34 |
| δ1 | 284 | 513 | 33 |
| Filler metal | 275 | 305 | 20 |
- σb and εb are the tensile stress and elongation for pipe base material.
In the filler material there is a smaller content of oxygen, but the relation of other elements is similar. In the pipe material of the thickness δ1 there is more hydrogen and iron in comparison to the thickness δ2. The strength and elongation of the filler metal were smaller than that of the pipe material (Table 2).
3.1.2. The Welding Process of the Stub Pipes
The stub pipes were welded by means of TIG argon arc welding of high gas purity (99.975%). The process of welding was performed by a welder type MagicWave 2200 Job manufactured by the Austrian company Fronius. The range of the current intensity was from 110 to 140 A for the thickness δ2 and from 70 to 100 A for the δ1 while the mean voltage was 12 V. The TIG welding torch with a trailing box was equipped with three gas flows protecting, respectively, the face, the root, and the back of the weld. This combination shielded the weld and the heat-affected zone against the harmful activity of oxygen, nitrogen, and hydrogen from the air. For the stub pipes of the thickness δ2 the optimum range of the joined gas intensity was I = Iopt = 10–20 l/min.
The joint area in the stub pipes of the thickness δ1 and the fine-grained structure of the initial material were deliberately saturated by the increased activity of the atmospheric air. In order to achieve this, the gas intensity was decreased in the root and back flow, which caused I < Iopt. This was to test the influence of an insufficient gas shield on the joint properties.
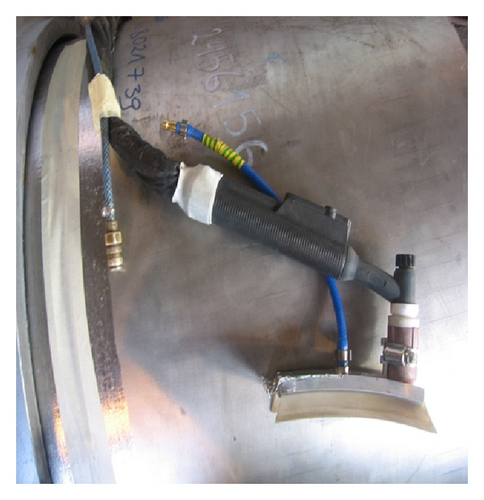
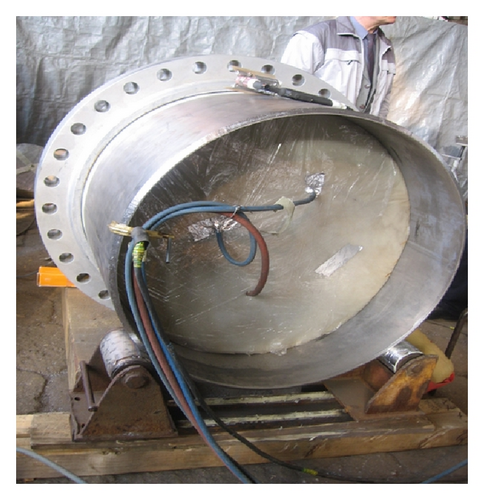
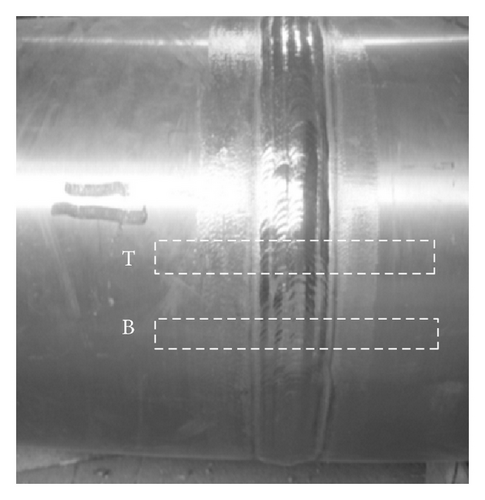
The other conditions for the experimental joints were the same as at the standard welding of industrial pipelines. The fragments of the equipment used by the Polish firm Mostostal Plock SA for welding the elements of pipelines and the experimental joints are presented in Figure 4.
3.2. The Test Procedures
The welded joints made of technical titanium were tested. The samples for tests were cut out of the welded stub pipes. According to the norm PN-EN ISO 15614-5 : 2005 (U), which qualifies titanium welding technology, a visual inspection, metallographic examination were conducted as well as hardness, tensile, and bend tests.
The visual inspection was to evaluate the colour of the welded joint and welding defectiveness. Macro- and micrometallographic examinations were conducted through an optical microscope NEOPHOT 2. The samples were etched in the Kroll reagent. From the Vickers hardness testing device HPO 250 the hardness values HV10 were obtained indirectly.
During the tensile test the test, pieces demonstrated plastic deformation rate of 0.0017 s−1 as measured on the testing machine HECKERT UFP 400. After reaching a certain target of yield strength, the stretching rate was increased to 0.0053 s−1. The test piece was a long slip cut out from the wall of a welded stub (Figure 4(c)), thus two flat test pieces of the thickness δ1 and two of the thickness δ2.
In the bend test on the same testing machine four flat test pieces of the thickness δ1 were used and four of the thickness δ2 which were cut out from the stub in the same way as in the case of the tensile test. At each thickness two samples were bent on the face of the joint and two on the root. The diameter of the bending mandrel was 30 mm.
3.3. The Properties of the Welded Joints
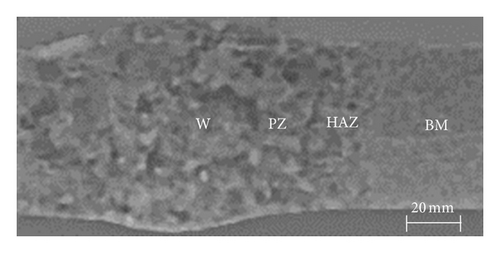
The visual inspection discovered the silver color (admissible) of the faces and roots on the joints of the thickness δ2 and the blue color (inadmissible) on the joints of the thickness δ1. Observation did not reveal any craters, cracks, or incomplete fusion. The macrostructure of the thickness δ2 joints and its characteristic zones are shown in Figure 5.
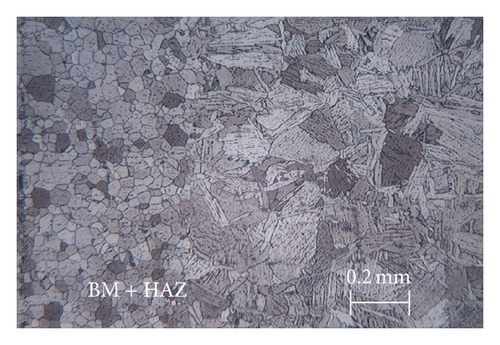
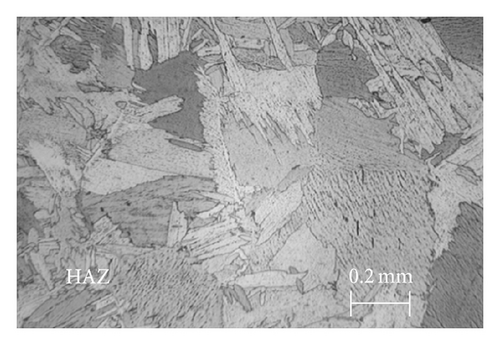
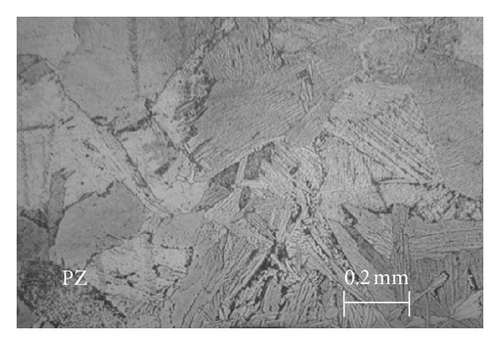
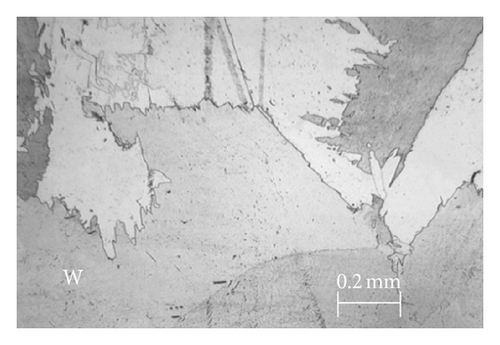
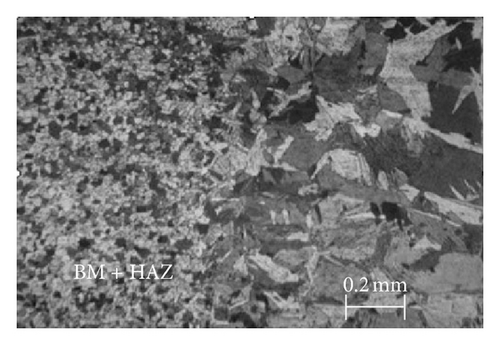
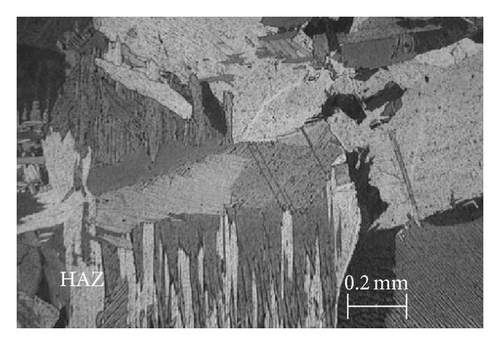
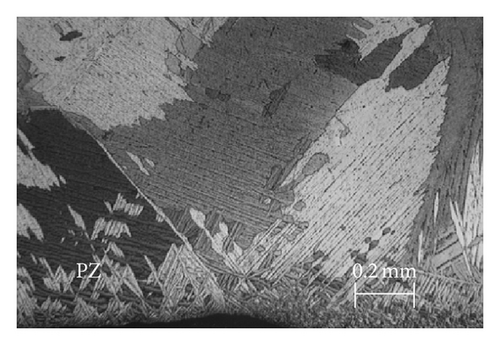
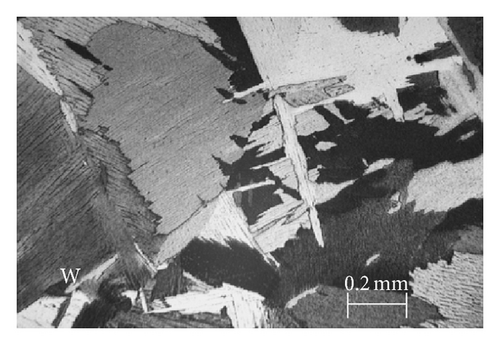
The results of microscopic examination are presented in Figures 6 and 7. The base material of the thickness δ1 joint has a little more of the phase β and smaller grains than the joint material of the thickness δ2. In both joints the presence of the phases α, α′, and β, typical of technical titanium in the initial state and under the influence of the welding thermal cycle, has been revealed. The thinner joints (Figures 7(b)–7(d)) contain a greater quantity of the martensite α′ than the thicker ones (Figures 6(b)–6(d)), while the weld itself has finer grains.
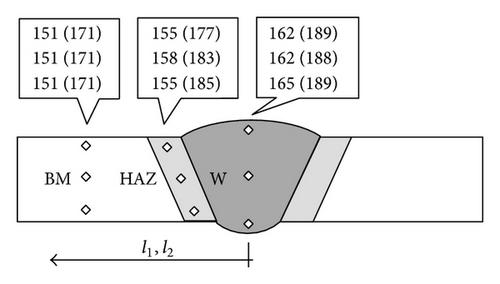
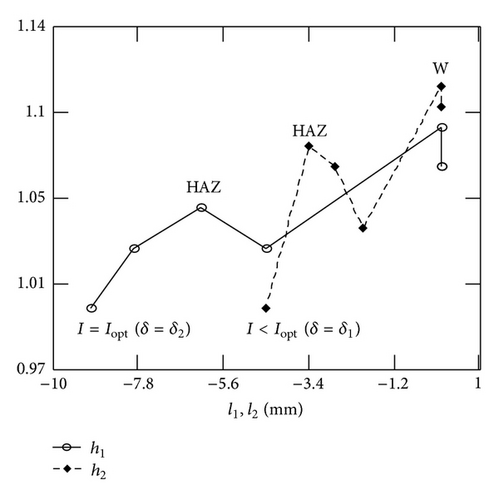
The hardness numbers and relative hardnesses h1 and h2 in each joint zone at I = Iopt and I < Iopt are shown in Figure 8. In both cases the relative hardnesses of joints are the highest in the weld. The joints of the thickness δ1 have the greater hardness HV10; therefore for the zones W, PZ, and HAZ the condition h1 > h2 is valid.
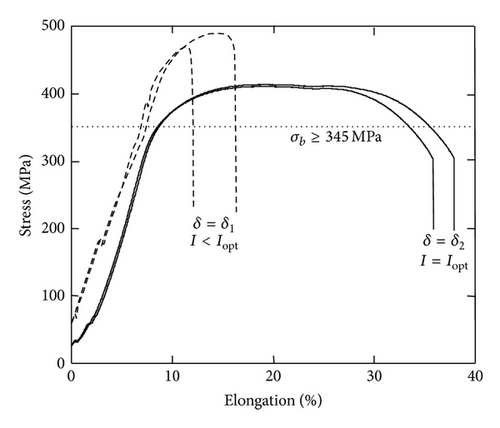
The tensile test results for the flat samples are presented in Table 3. The joints of the thickness δ1 with fractures in the weld have a bigger tensile strength σj. The joints of the thickness δ2 cracked in the heat-affected zone on the penetration zone side. The results of these tests show that for each relative tensile strength index ct there exists the condition . In the case of elongation with the relative elongation index ce the reciprocal condition functions, that is, . The changes of the strength resulted from the static tensile test are presented in Figure 9. Each of these values exceeds the admissible strength σb > 345 MPa according to ASTM B862 Grade 2. The joints of the thickness δ1 have smaller elongation.
| δ | Tensile stress σj MPa | Elongat. εj % | Relat. coeffic. of | Frac. | |
|---|---|---|---|---|---|
| Tensile stress ct | Elongat. ce | ||||
| δ2 | 415 | 37.8 | 0.82 | 1.11 | PZ |
| δ2 | 413 | 35.7 | 0.82 | 1.05 | PZ |
| δ1 | 488 | 16.2 | 0.95 | 0.49 | W |
| δ1 | 466 | 11.8 | 0.91 | 0.36 | W |
- σj and εj are the tensile stress and elongation for joint: ct = σj/σb, ce = εj/εb.
The test results of the bend test are shown in Table 4. Beside mostly positive test results (180 degrees), two negative ones were obtained (58 and 67 degrees). These refer to the joints of the thickness δ1 in which the bend angle on the root side was below the admissible value.
| δ | Bend test kind | Dim. of bend test spec., mm | Bending angle, degree | Result |
|---|---|---|---|---|
| δ2 | FBB | 25.93 × 8.01 | 180 | Positive |
| δ2 | FBB | 26.01 × 7.94 | 180 | Positive |
| δ2 | RBB | 25.97 × 7.98 | 180 | Positive |
| δ2 | RBB | 26.01 × 7.93 | 180 | Positive |
| δ1 | FBB | 14.97 × 3.01 | 180 | Positive |
| δ1 | FBB | 15.02 × 2.98 | 180 | Positive |
| δ1 | RBB | 14.98 × 2.98 | 67 | Negative |
| δ1 | RBB | 15.02 × 3.01 | 58 | Negative |
- FBB and RBB mean tensions of weld face and root, respectively.
4. Analysis
The binary titanium equilibrium systems allow rough understanding of transformations occurring in technical titanium during heating and cooling (Figure 2 and Table 1). In the base material of the welded titanium pipes the phase α with a small quantity of the phase β prevails. The thinner joints of the thickness δ1 contained more elements stabilizing the phase β (H, Fe) with a fine structure in the initial state. The filler metal used had a similar chemical content but with a smaller amount of oxygen. The initial material ensured the degrees of strength and plasticity which were greater than the strength and plasticity of the filler metal (Table 2).
The welded joints demonstrated the presence of phases α, α′, and β in the joint area which are typical of technical titanium after welding (Figures 3(a), 3(c), and Figures 5–7). In both cases of the thickness δ the grain sizes increase towards the weld. The thinner joints in comparison to the thicker ones included a greater quantity of the martensite α′ with deformation twins and the high dislocation density in the joint area. At δ1 < δ2 the quantity of the phase α′ and smaller grains in the weld result from the cooling rate of both joints, where v1 > v2 (Figure 3(b)).
To examine the strength and plasticity of both joint types, the hardness test, the tensile test, and the bend test were carried out. The highest hardness numbers HV10 occurred in the weld and the heat-affected zone (Figure 8) independently of the joint type. These are the areas of the coarse-grained material with an increased brittleness and fractures. Therefore the tensile strength of these areas is smaller than the strength of the base material (Tables 2 and 3).
The joints of the thickness δ1 with the smaller argon shield (I < Iopt) had higher hardness, tensile strength and smaller elongation (Figure 9). The small elongation was convergent with the small bend angle of 58 and 67 degrees for two test pieces (Table 4). Although the tensile strength of those joints exceeds the admissible value in accordance with the standards ASTM B862 Grade 2 (σb> 345 MPa), they should be treated as negative joints.
The obtained joint properties in conditions of the increased diffusive activity of oxygen, nitrogen, and hydrogen from the air visually disclosed the colors of the weld. Silver and blue marked admissible and inadmissible colors on the thick and thin joints, respectively. Therefore the joints of the thickness δ2 considered positive had smaller hardness and tensile strength as well as increased elongation.
The quantitative comparison of the joint strength properties includes the relative index of hardness h, tensile strength ct (strength), and elongation ce (plasticity) (Figure 8 and Table 3). These indexes satisfy the following conditions: and .
5. Conclusions
- (i)
Both initial pipes made of technical titanium had basically the structure of the phase α with a small quantity of the phase β. The welded materials had higher value indicators of the mechanical properties than the filler metal.
- (ii)
Under the influence of the welding thermal cycle the joints were formed in which the joint area included the phases α, α′, and β typical of technical titanium after welding. In the range of the applied thicknesses δ the quantity of the martensite α′ was bigger in the joint of the smaller thickness δ1.
- (iii)
From the point of view of the acceptance criteria the positive joints had the thickness δ2 and the negative ones the thickness δ1. The positive joints disclosed satisfying hardness, plasticity, and tensile strength within the limit of the recommended standard. The negative joints presented higher hardness and tensile strength and insufficient plasticity which was demonstrated by the bend test.
- (iv)
An inadequate argon shield insufficiently protected the joint against the access of oxygen, nitrogen, and hydrogen from the air. It was conducive to the diffusion of these gases to the joint area, especially to the weld of the highest temperature. Increased ultrasaturation of the phase α′ with these elements raised the hardness and strength of the joint but decreased its plasticity.
- (v)
There is a relation between the structure of the welded joints and their mechanical properties. The joints of the thickness δ1 had a greater quantity of the martensite α′ in the weld and the heat-affected zone than the joints of the thickness δ2. Therefore the thinner joints demonstrated higher hardness and strength but lower plasticity.
- (vi)
The applied welding of stub pipes of the thickness δ2 by the TIG process can be used for the actual welding of industrial pipelines following certain recommendations. They include the unification of properties in the joint area and the base material.
- (vii)
For the future it is recommended to anneal joints on the pipelines, if it is possible, in order to obtain optimum mechanical and technological properties and to eliminate welding stresses. Besides, it is recommended to select a filler metal with increased ductility, that is, a reduced content of elements O, N and C.


