Effect of Varying Illumination and Temperature on Steady-State and Dynamic Parameters of Dye-Sensitized Solar Cell Using AC Impedance Modeling
Abstract
The steady-state current-voltage curve and dynamic response of a dye-sensitized solar cell (DSSC) is mathematically modeled based on electrical equivalent circuit. The effect of temperature and illumination on the steady-state and dynamic parameters of dye-sensitized solar cells is studied. It is found that the dynamic resistance of DSSC decreases from 619.21 Ω to 90.34 Ω with the increase in illumination level from 200 W/m2 to 800 W/m2. A positive temperature coefficient of dynamic resistance is observed. The interfacial charge transfer and recombination losses at the oxide/dye/electrolyte interface are found to be the most influential factor on the overall conversion efficiency and included in the mathematical model. The saturation current of rectifying diode and saturation current of recombination diode are responsible for the transfer recombination losses and have major influence on the overall conversion efficiency.
1. Introduction
In recent years, dye-sensitized solar cells (DSSCs) have attracted much attention as a potential low-cost alternative to single or polycrystalline p-n junction-based silicon solar cells. Various oxide-based materials such as NiO2, Fe2O3, ZnO, SnO2, and TiO2 have been studied for photoelectrochemical [1–3] and photovoltaic [4, 5] applications. Tiwana et al. have shown that TiO2 is better material, based on their studies on electron mobility and injection dynamics in mesoporous films for DSSCs [4]. Recent study by Burschka et al. [5] has shown a power conversion efficiency of 15% for the solid-state TiO2 mesoscopic solar cells based on perovskite absorber. When DSSC is illuminated, photons are absorbed by dye molecules, which inject electrons from their excited states into the conduction band of the TiO2 nanoparticles to leave the dye molecule oxidized. Oxidized dye molecules are reduced by a redox electrolyte, which transports the positive charges by diffusion to a Pt back electrode. Efficient electron injection from excited state of the dye to TiO2 plays an important role in DSSC [6, 7]. The injected electrons flow through the porous TiO2 thin film to the transparent conducting oxide (TCO), depending on the incident intensity and trapping-detrapping effect [8–11]. Subsequently, the electrons flow to the back electrode via the external circuit. The oxidized dye molecules are regenerated by redox mediators (). Finally, the oxidized redox mediators () are transported to the back electrode where regeneration of redox mediators occurs for a complete DSSC operation cycle [12, 13].
Usually the dye molecules have low absorption coefficient. The low absorption coefficient of a dye monolayer is compensated by the mesoporous structure of the TiO2 film, which leads to a strong increase in the number of TiO2/dye/electrolyte interfaces through which photons pass, thus increasing the absorption probability. This phenomenon uses the increased surface area due to associated porosity of the TiO2 layer. In fact, studies on the DSSC electrode morphology showed that the light absorption coefficient α and electron transport coefficient D varied with porosity P [14–27]. The influence of electrode morphology, interfacial charge recombination, and the charge transport on the output performance of DSSC is also studied by electrochemical impedance spectroscopy (EIS) [28–30]. Electrochemical impedance spectroscopy is a steady-state method of measuring the current response to the application of an AC voltage as a function of the frequency to study the kinetics of electrochemical and photoelectrochemical behaviors of devices. This paper presents a theoretical EIS and I-V model to estimate steady-state and dynamic parameters of dye-sensitized solar cell. The developed theoretical model is validated with reported experimental results. The effect of temperature and illumination on the steady-state and dynamic parameters is systematically studied for a dye-sensitized solar cell. The existing steady-state models of dye-sensitized solar cells represent the steady-state characteristics of the solar cells but there exists a limitation in predicting dynamic characteristics such as the response of the solar cell on the AC components. For the design of a high performance power conditioning unit, it is essential to have accurate information about the static and dynamic characteristics of the solar cell.
2. Performance Prediction Model
2.1. Prediction of I-V Curve of DSSC
An operating DSSC is principally governed by the relative kinetic rates of several charge transfer steps. The charge transfer taking place from excited dye to TiO2 nanoparticle, from electrolyte to the dye, and from TiO2 to the load terminals plays very critical role in the performance of DSSC. Thus, it is very important to understand all the electronic processes taking place at the TiO2 nanoparticles level, as well as the dynamics of charge separation and charge transport at the metal/oxide interface. The schematic band diagram of dye-sensitized solar cell is shown in Figure 1, which illustrates the following sequence of electron transfer and charge-transport processes, which are at the basis of a DSC’s operation mode [28]:
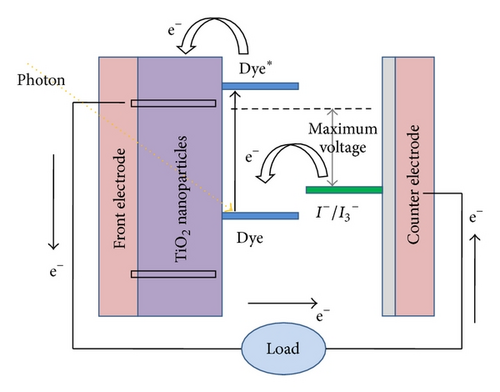
The redox electrolyte is responsible for the dye regeneration, becoming oxidized by electron injection to the TiO2 conduction band. Moreover, the electrolyte conducts the positive charges (holes) to the counter electrode, where the redox-couple itself is regenerated. As the open-circuit voltage of the system corresponds to the difference between the redox potential of the electrolyte and the TiO2 Fermi level, the redox potential must be as positive as possible in order to assure high open-circuit voltages. Moreover, to overcome the problem related to slow charge-transfer reaction at the counter-electrode, a platinum-based catalyst must be employed. On the other hand, the overvoltage at the semiconductor/dye interface should be high since the dark current caused by electron back transfer to the electrolyte decreases the number of electrons available for photocurrent.
2.2. Prediction of Dynamic Resistance of DSSC
Due to the nonlinear I-V characteristics curve of the DSSCs, it is difficult to analyze and determine their output impedance, that is, dynamic resistance. It is necessary to develop an efficient method to determine the dynamic resistance that corresponds to maximum power point (MPP) of DSSC. Being the dynamic quantity, the dynamic resistance is determined by the derivative of the I-V characteristics of the cell and is defined as the change in voltage divided by the change in current (dVm/dIm) at MPP. In addition to this, the dynamic resistance is composed of series resistance and shunt resistance. A DSSC mainly consists of three types of resistances: series resistance (RS), shunt resistance (Rsh), and dynamic resistance (Rd) as shown in Figure 2. The series resistance RS can be determined by various illumination conditions such as dark, constant illumination, and varying illumination, and they yield different results [33]. Practically, RS is determined by using two different illumination levels, the so-called two-curve method. Shunt resistance, Rsh, can be obtained from only one illuminated I-V curve or single curve method. The output impedance of solar PV module, that is, dynamic resistance, is usually composed of the series resistance and shunt resistance.
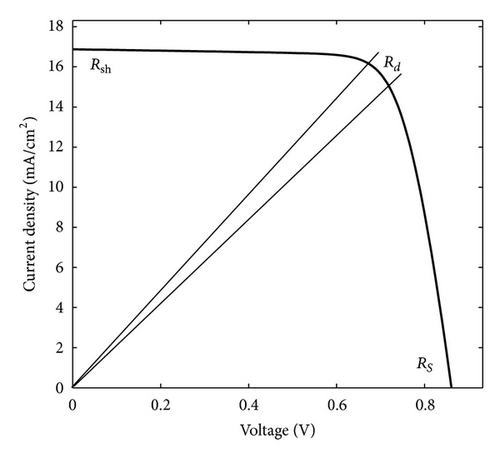
In order to estimate components of resistance offered by DSSC, a new and simple method is proposed here based on the equivalent circuit of DSSC shown in Figure 3. Using this method the dynamic resistance of the DSSC can be determined from single I-V characteristics curve under illumination. The model of the dynamic resistance with the combination of the finite series resistance and shunt resistance is also taken into consideration. Through the developed model, the effect of light intensity and temperature on the I-V characteristics and dynamic resistance of the DSSC is studied.
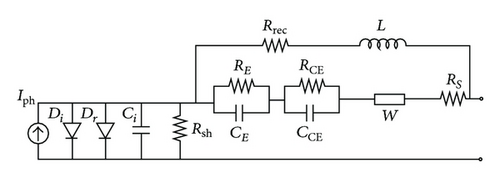
A standard DSSC consists of three interfaces formed by FTO/TiO2, TiO2/dye/electrolyte, and electrolyte/Pt-FTO represented by an equivalent circuit shown in Figure 3 [34]. The interfacial charge transfer at the TiO2/dye/electrolyte is characterized by a rectifying diode Di and a double-layer capacitance Ci. A recombination diode Dr with an ideality factor, m, is employed to denote the interfacial charge recombination losses to both the dye cation and the redox electrolyte. A shunt resistance Rsh takes into account all parallel resistive losses across the photovoltaic device including leakage current. The photogenerated current Iph is in parallel with the rectifying diode. An inductive recombination pathway on account of charge-transfer current [34] is incorporated into the circuit, consisting of a recombination resistance (Rrec) in series with an inductor (L). The charge-transfer resistance and interfacial capacitance at the FTO electrode and electrolyte/Pt-FTO interfaces are characterized by RE and CE and RCE and CCE, respectively. The Nernst diffusion of the carrier transport by ions within the electrolyte is denoted by the Warburg impedance (W). A resistance element RS represents the bulk and contact resistive losses present in a DSSC, such as the sheet resistance of the FTO glass.
- (1)
0 < V < Vm and Im < I < ISC;
- (2)
Vm < V < VOC and 0 < I < Im.
3. Validation and Analysis of Developed Model
3.1. Current-Voltage Characterization
Current-voltage (I-V) characterization is very significant technique to study nonlinear response of the DSSC under dark and illuminated conditions. The simulated I-V characteristic of DSSC was experimentally validated by comparison with data from Gratzel [39] as shown in Figure 4.
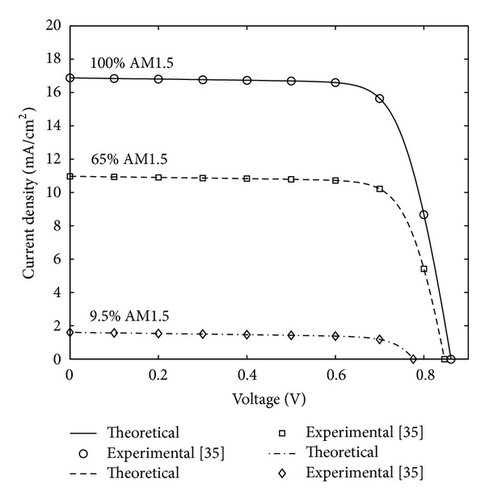
The input data used for simulation purposes are compiled in Table 1.
Iph (mA/cm2) |
Ii (A/cm2) |
Ir (A/cm2) |
Ci (F) |
Rsh (F) |
Rrec (Ω) |
RE (Ω) |
CE (mF) |
RCE (Ω) |
CCE (μF) |
σ (Ω s−1/2) |
RS (Ω) |
|---|---|---|---|---|---|---|---|---|---|---|---|
| 16.9 | 0.4 × 10⁻¹⁶ | 1.4 × 10⁻¹⁰ | 10 | 3000 | 4.2 | 21.7 | 0.8 | 9.8 | 19 | 4.2 | 12.6 |
It is evident from Figure 4 that the outlined model agrees quite well with the experimental data. The reported cell’s efficiency of 11.04% (JSC = 16.9 mA/cm2; VOC = 862 mV; PMAX = 11.04 mW; RS = 12.6 Ω) [39] is in straight agreement with the simulated parameters of the DSSC having efficiency of 10.85% (JSC = 16.9 mA/cm2; VOC = 862 mV; PMAX = 10.85 mW; RS = 10.85 Ω). The experimental and simulated I-V curves were fitted by means of the parameters RS, Rsh, Di, and Dr.
The curves at 0.65 sun and 0.1 sun were subsequently calculated using the same parameter as used at 1 sun, by only changing the light intensity in the simulation (i.e., the recombination constant and the quantum injection yield are taken to be independent of light intensity). It can be seen that short-circuit current, maximum power point and open-circuit voltage are in general agreement with the experimental results.
3.2. Electrochemical Impedance Spectroscopy
In the Nyquist plots, the respective electrochemical steps with different time constants are represented by the semicircles as shown in Figure 5. Three semicircles correspond to three interfaces formed by FTO/TiO2, TiO2/dye/electrolyte, and electrolyte/Pt-FTO [39, 40, 42]. The tri-iodide diffusivity was obtained by fitting the experimental EIS spectra under illumination to an appropriate electrical analogue [43, 44]. The diffusion of in the electrolyte is usually well described by the Nernst diffusion impedance, characterized by the Warburg parameter and a characteristic diffusion time constant [45, 46]. Due to excess of I− ions compared to , the former does not contribute to the diffusion impedance [47].
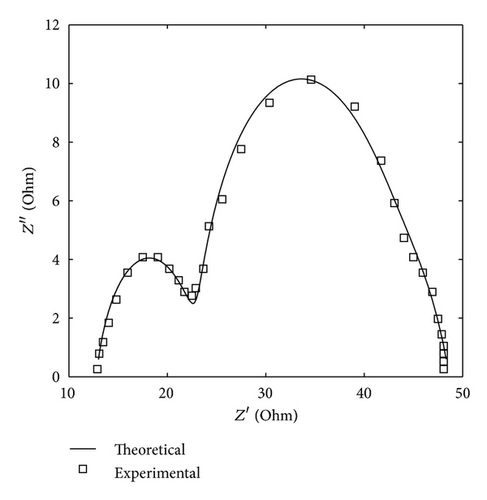
The low-frequency semiarc in the Nyquist plot represents the electrolyte-platinum interface and may be expressed as a charge-transfer resistance and a double-layer capacitance [34]. Impedance spectra are simulated over a frequency range of 0.01–106 Hz with AC amplitude of 10 mV. The values of model parameters used in the simulation are summarized in Table 1. The shunt resistance, Rsh, can be estimated from the slope of the I-V curve near short-circuit current point, which is typically of order of 103 for a highly efficient solar cell. The values of Ii and Ir are found to be of orders 10−15 and 10−10 A/cm2, respectively. The inductor L is 10–100 H [48]. The double-layer capacitance, Ci, is determined to be of order 10 F. The large capacitance value at the TiO2/dye/electrolyte interface (Ci) is likely to result from the large surface area of the nanocrystalline TiO2 structure [30]. The length between the intercepts at the real axis corresponds to the charge-transfer resistance (Rct) of the component. The double-layer capacitance (Ci) is determined from the characteristic frequency [49]. The resistance elements Rrec, RE, RCE, and RS are typically of several ohms for a highly efficient solar cell. The interfacial capacitances CE and CCE are of orders 1 mF and 1 µF, respectively.
4. Results and Discussion
4.1. Effect of Illumination on Steady and Dynamic Parameters
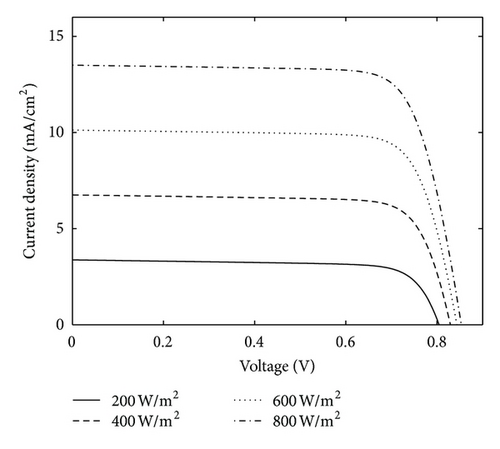
The proposed model in Section 2 is used to estimate the I-V characteristics of the DSSC. The static parameters (ISC, VOC, PMAX, and RS) of the DSSC are estimated in STC conditions. The simulated current-voltage characteristic of DSSC is shown in Figure 8 with varying illumination at constant cell temperature. Generally, the output current of the DSSC increases with the radiation intensity. A positive increment in current is mainly due to increase in solar irradiance. With the increase in the solar irradiance the higher number of photons strikes the DSSC which results in enhanced dye excitation and electron transfer into the conduction band of TiO2 electrode resulting in higher photocurrent.
The values of the dynamic resistance at MPP are computed using the values of Iph, ISC, and RS. The dynamic resistance of the DSSC is calculated in an effective manner using (30) as listed in Table 2. From the obtained theoretical data as listed in Table 2, the series resistance, RS, shows a decreasing trend continuously with increase in the intensity of illumination. Using our previous work [50], the dynamic resistance of the DSSC can be determined for a given photogenerated current-voltage characteristic curve. The dynamic resistance for various illumination levels is listed in Table 2.
| Illumination (W/m2) | JSC (mA/cm2) | VOC (mV) | PMAX (mW) | RS (Ω) | Rd (Ω) | Efficiency, η (%) |
|---|---|---|---|---|---|---|
| 200 | 3.4 | 804.7 | 2.0 | 38.28 | 619.21 | 10.00 |
| 400 | 6.8 | 829.5 | 4.3 | 18.52 | 306.55 | 10.75 |
| 600 | 10.1 | 843.7 | 6.6 | 12.4 | 148.94 | 11.00 |
| 800 | 13.5 | 853.6 | 8.8 | 9.66 | 90.34 | 11.00 |
4.2. Effect of DSSC’s Working Temperature on Steady and Dynamic Parameters
The effect of the cell temperature (TC) on I-V curve of DSSC is estimated from the proposed model as shown in Figure 7, and the extracted steady-state and dynamic parameters are listed in Table 3.
| Temperature (K) | JSC (mA/cm2) | VOC (mV) | PMAX (mW) | RS (Ω) | Rd (Ω) | Efficiency, η (%) | Ir (A/m2) | Ii (A/m2) |
|---|---|---|---|---|---|---|---|---|
| 298 | 13.5 | 853.6 | 8.8 | 9.66 | 90.34 | 11.00 | 3.22 × 10⁻⁷ | 1.04 × 10⁻¹³ |
| 303 | 13.5 | 827.4 | 8.5 | 10.05 | 96.77 | 10.62 | 5.84 × 10⁻⁷ | 3.41 × 10⁻¹³ |
| 308 | 13.6 | 801.2 | 8.1 | 10.45 | 102.95 | 10.12 | 1.04 × 10⁻⁶ | 1.08 × 10⁻¹² |
| 313 | 13.6 | 774.9 | 7.8 | 10.88 | 108.64 | 9.75 | 1.82 × 10⁻⁶ | 3.31 × 10⁻¹² |

As the device temperature increases, negligible increase in short-circuit current is observed; however, the open-circuit voltage rapidly decreases due to the exponential dependence of the reverse saturation current on the cell temperature as given by (20) [50]. As a result of increased cell temperature, higher series resistance offers greater resistive power losses equivalent to I2RS and thus reduces its performance by reducing efficiency. The increase in RS causes maximum power point shifts towards lower values. The current output of the DSSC in the range of ISC to IMAX is dependent on the Rsh of the solar cells. For this study sufficiently high Rsh is considered for modeling (and the experimental value of Rsh is also quite high), so there is negligible variation in the current between ISC and IMAX with respect to varying voltage at the output terminal of DSSC. The voltage output of DSSC in the range of VMAX to VOC is dependent on series resistance. Although both resistances (RS and Rsh) contribute to the degradation of the I-V curve, but the effect of RS is dominant because the current loss (~I2RS) is directly dependent on RS. At higher current, in the case of DSSC, the loss term is more prominent. A decrease in the PMAX with the increase in TC is observed because as temperature increases the band gap of the TiO2 semiconductor shrinks. The increased temperature causes reduction in open-circuit voltage (VOC) and small increase in the photocurrent for a given irradiance because of fractional increase in the number of electrons transferred from valance band to conduction band of TiO2 semiconductor. The excited state of the dye energetically lying above the conduction band edge of the TiO2 nanoparticles assures fast electron injection, before it can fall back to its ground state. On the other hand, the oxidized dye has a higher positive potential than the redox-couple in the electrolyte. The redox electrolyte is responsible for the dye regeneration, becoming oxidized by electron injection to the TiO2 conduction band. Further, the electrolyte conducts the positive charges (holes) to the counter-electrode, where the redox-couple itself is regenerated. As the open-circuit voltage of the system corresponds to the difference between the redox potential of the electrolyte and the TiO2 Fermi level, the redox potential must be as positive as possible in order to assure high open-circuit voltages. As the temperature increases, the band gap of TiO2 electrode shrinks which results in reduced difference between the redox potential of the electrolyte and the TiO2 Fermi level and hence reduced VOC. The similar trend of decreasing VOC with increase in temperature is observed for DSSC by other researches [52]. Another significant factor which governs the decrease VOC is the transfer recombination which occurs at the dye-electrode interface, electrolyte-dye interface, and electrolyte-counter electrode interface. The influence of each parameter on the overall conversion efficiency is simulated. It is clearly demonstrated that Ii (saturation current of rectifying diode) and Ir (saturation current of recombination diode) are responsible for the transfer recombination losses and have major influence on the overall conversion efficiency. However, the effect of resistive elements starts becoming dominant when the series resistance is getting larger, especially detrimental to the fill factor.
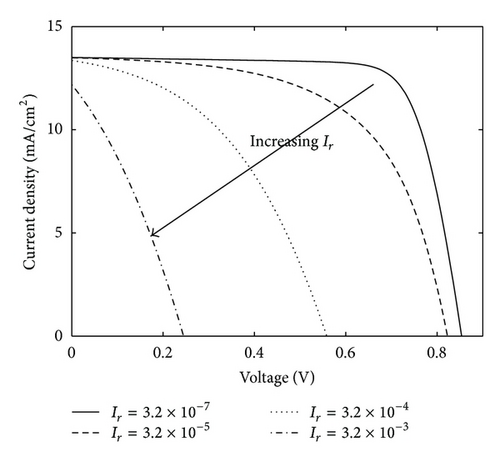
The effect of increase in the transfer recombination (which is related to recombination diode, Dr) is shown in Figure 8, wherein the increase in Ir plays a critical role in deciding the performance of DSSC.
It is noteworthy to mention that the saturation current (Ir) for recombination diode (Dr) in a two-diode model is mainly dependent on the cell temperature as given by (19). As the temperature increases, Ir increases, which further contributes to decline of the output performance of dye-sensitized solar cell (Figure 8).
5. Conclusions
A mathematical model that simulates the steady-state current-voltage curve and the dynamic response of a dye-sensitized solar cell (DSSC) based on equivalent circuit of DSSC is proposed. The interfacial charge transfer and recombination losses at the oxide/dye/electrolyte interface are found to be the most influential factor on the overall conversion efficiency and included in the mathematical model. All parameters in the model can be related to quantities accessible experimentally. The model predicts the dynamic current-voltage behavior of DSSC under varying illumination levels and temperatures. The implications of the model are discussed in terms of efficiencies potentially attainable in dye-sensitized solar cells having diffusional mechanism of charge transport.
Acknowledgment
The authors would like to acknowledge the scientific discussions held with Professor Indrajit Mukhopadhyay of School of Solar Energy, Pandit Deendayal Petroleum University, Gandhinagar.


