Size Effects on Magnetic Properties of Ni0.5Zn0.5Fe2O4 Prepared by Sol-Gel Method
Abstract
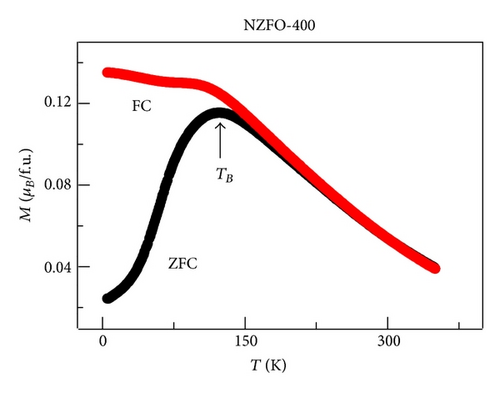
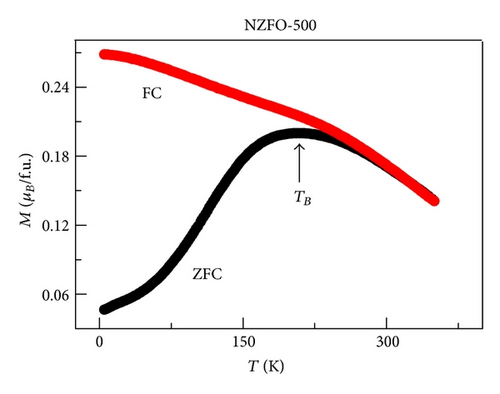
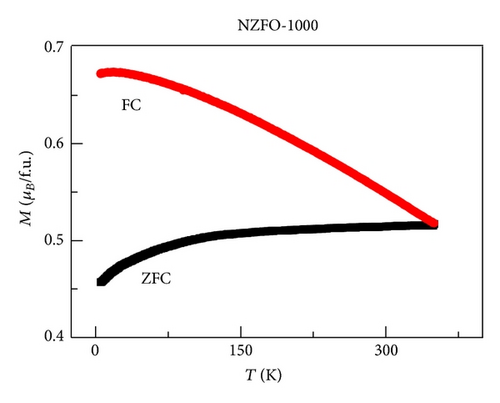
Ni0.5Zn0.5Fe2O4 particles with different particle sizes have been synthesized by sol-gel method. X-ray diffraction results show that all the samples are pure cubic spinel structure with their sizes ranging from 9 to 96 nm. The lattice constant significantly decreases with further increasing annealing temperature. The magnetic measurements show superparamagnetic nature below the particle size of 30 nm, while others show ferrimagnetic nature above the corresponding blocking temperature. The blocking temperature increases with the increase in particle size, which can be explained by Stoner-Wohlfarth theory. The saturation magnetization increases as the particle size increases, which can be explained by the cation redistribution on tetrahedral A and octahedral B sites and the domain wall motion. The variation of coercivity as a function of particle size is based on the domain structure.
1. Introduction
Spinel ferrites have attracted more and more attention due to their various technological applications in some fields, such as microwave absorption, high-speed digital tape, ferrofluid, magnetic recording, and photomagnetic materials [1–5]. Among the spinel ferrites, nickel zinc ferrite is one of the most versatile magnetic materials as they have high saturation magnetization, high Curie temperature, excellent chemical stability, low coercivity, and biodegradability [6]. It is a mixed spinel structure based on a face-centered cubic lattice of oxygen ions, with functional units of (ZnxFe1−x)[Ni1−xFe1+x]O4. Zn2+ and Ni2+ ions are known to have very strong preferences for the tetrahedral A and octahedral B sites as depicted by curled and square brackets [2], respectively, while Fe3+ ions partially occupy the A and B sites. In the case of Zn1−xNixFe2O4 ferrite, it was found that for x greater than 0.5, Fe3+ moments in A and B sites have collinear arrangement, whereas for x less than 0.5, Fe3+ moments in the B site have noncollinear arrangement [7]. The compositional variation can result in the redistribution of metal ions in the A and B sites, which can modify the properties of nickel zinc ferrites. The nickel concentration effect on structure and magnetic of NixZn1−xFe2O4 has been reported [8]. The result showed the superparamagnetic nature of the samples for x = 0.1 and x = 0.3 whereas the material showed ferromagnetic for x = 0.5, but the crystallite size increased unobviously from 12 to 17 nm corresponding x = 0.1 to x = 0.5. Therefore, the nickel concentration played an important role in determining the magnetic properties of NixZn1−xFe2O4. In our previous studies [9], it is found that Ni0.5Zn0.5Fe2O4 (NZFO) presents the best magnetic and microwave absorption ability in NixZn1−xFe2O4 system. Therefore, it is necessary to further study the magnetic properties of NZFO nanoparticles.
George et al. [10] have studied finite size effects on the structural and magnetic properties of NiFe2O4 powders. They found the specific saturation magnetization decreased with decreasing grain size, which may be due to noncollinear magnetic structure and surface effects. The coercivity reached a maximum when the grain size was 15 nm and then decreased as the grain size increased further, which can be explained on the basis of domain structure. Chen and Zhang [11] have reported size effects on magnetic of MgFe2O4 spinel ferrite nanocrystallites. The MgFe2O4 nanoparticles showed typical superparamagnetism, which unambiguously correlated with the particle size from 6 to 18 nm. However, few groups have investigated size effects on magnetic properties of NZFO ferrite prepared by sol-gel method.
In the present work, the sol-gel method has been used to prepare NZFO with different heat treatment temperatures. To the best of our knowledge, it is the first time to systematically demonstrate size effects of nanocrystallite ferrite on the magnetic behavior. The possible mechanism is discussed here.
2. Experimental
In order to synthesize NZFO, stoichiometric amounts of nickel nitrate, zinc nitrate, and iron nitrate were dissolved in deionized water under heating and magnetic stirring. After stirring for 30 min, citric acid was slowly added to the mixed nitrates solution. The mole ratio of citric acid and total metal ions was controlled to be 1.5 : 1. Urea was added to adjust the pH value to 7. The mixed solution was stirred at 80°C until forming viscous brown gel. Then, the viscous brown gel was placed in the oven at 80°C for 1-2 days to obtain a dry gel. The as-burnt powders were obtained when the dry gel was calcinated at 350°C for 3 h. Finally, the as-burnt powders were annealed in the muffle furnace at different temperatures in the range 400–1100°C in steps of 100°C for 2 h with a heating rate of 5°C/min in air. The as-burnt powders with different annealing temperatures were named as NZFO-350, NZFO-400, NZFO-500, NZFO-600, NZFO-700, NZFO-800, NZFO-900, NZFO-1000, and NZFO-1100, respectively.
Phase analysis of the products was performed by Philips X’pert PRO X-ray diffractometer with Cu Kα radiation. TEM (JEM-2010) was used to show the morphology and particle size distribution. The magnetic properties of the NZFO ferrite powders were measured by using a superconducting quantum interference device magnetometer measurement system (SQUID, MPMS-5T). Zero-field-cooling (ZFC) and field-cooling (FC) magnetization curves were performed in the temperature range between 5 and 350 K under an applied magnetic field of 100 Oe.
3. Results and Discussion
3.1. Structure and Morphology
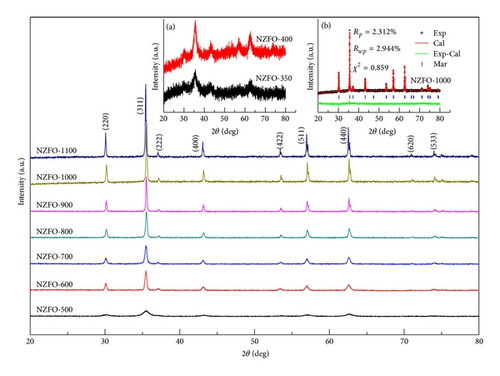
Figure 1 shows XRD patterns samples treated under different annealing temperatures. The XRD patterns have a good agreement with the standard JCPDS cards for nickel zinc ferrite (card no. 08-0234), which confirms single phase cubic spinel structure (space group ) of ferrite samples. Figure 1(a) shows that the as-burnt sample appears diffraction peak of spinel ferrite, but the crystallinity is still relatively low, with less defined diffraction peaks. Figure 1 shows that the corresponding diffraction peaks become narrower and sharper with increasing annealing temperature, which indicates the growth in crystallite size [12] and much better crystallinity. It is expected that if one introduces annealing temperature in the system much higher, the molecular concentration at the crystal surface will increase and hence the crystal growth will be promoted [13]. In addition, a higher temperature can enhance the atomic mobility and make grains get more energy to grow up.
| T (°C) | D (nm) | a (Å) | Ms (μB/f.u.) | Hc (Oe) | Mr (μB/f.u.) | ||
|---|---|---|---|---|---|---|---|
| 300 K | 300 K | 10 K | 300 K | ||||
| 350 | 9 | — | — | 0.26 | 0 | 478 | 0 |
| 400 | 10 | 8.3965 | — | 0.79 | 3.6 | 687 | 0.0017 |
| 500 | 13 | 8.3922 | 76.7 | 1.53 | 5.6 | 530 | 0.0085 |
| 600 | 30 | 8.3775 | 13.7 | 2.03 | 58.2 | 114 | 0.21 |
| 700 | 33 | 8.3750 | 13.5 | 2.77 | 58.0 | — | 0.19 |
| 800 | 46 | 8.3792 | 10.7 | 2.87 | 50.8 | 117 | 0.26 |
| 900 | 81 | 8.3776 | 1.57 | 3.12 | 32.3 | — | 0.17 |
| 1000 | 88 | 8.3766 | 2.15 | 3.09 | 25.4 | 44 | 0.12 |
| 1100 | 96 | 8.3774 | 2.14 | 3.14 | 15.1 | — | 0.06 |
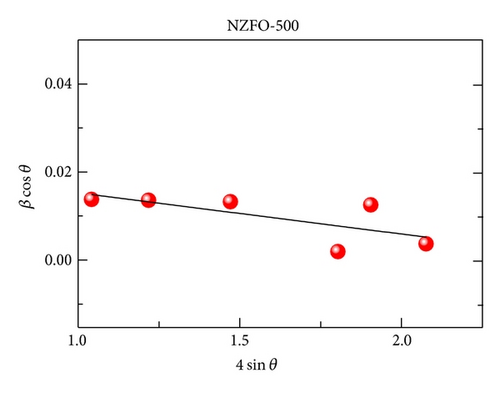

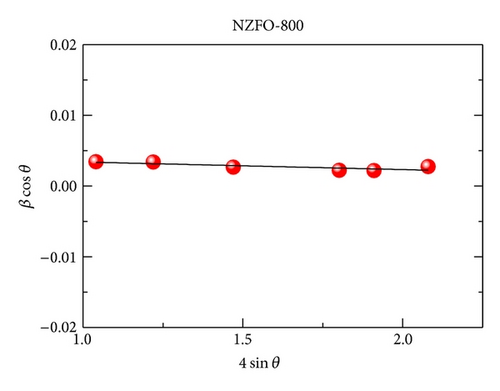
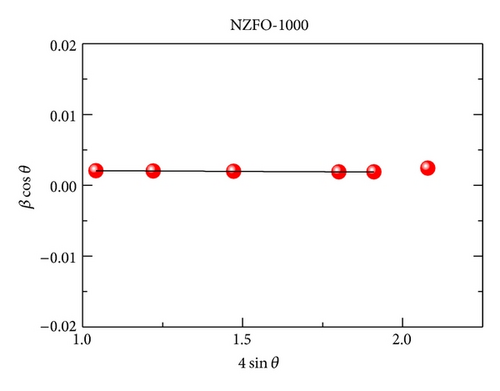
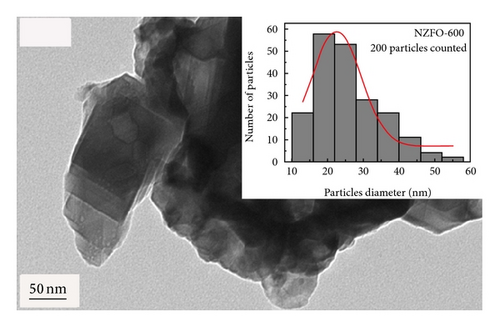
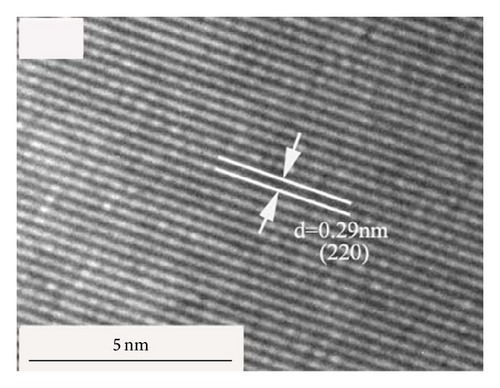
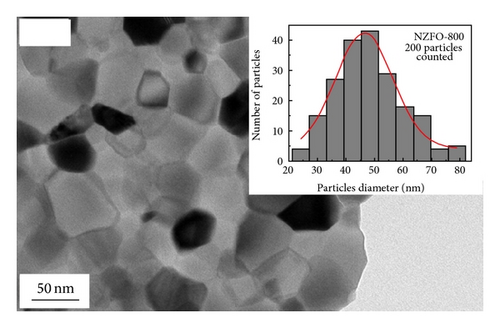
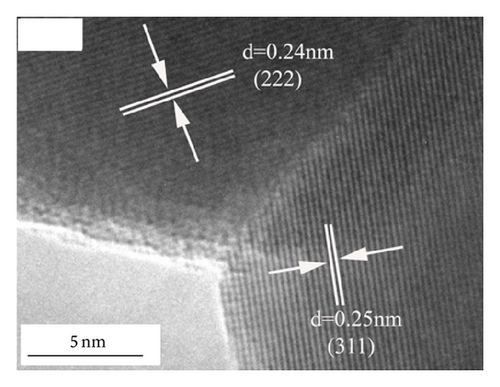
Figure 3 shows the TEM morphology of NZFO-600 and NZFO-800. The particles are similar spherical and polyhedral shapes. For NZFO-800 sample, classical polygonal grain and grain boundary morphologies are present, which shows a higher degree of crystallinity than that of NZFO-600 sample. The insets in Figures 3(a) and 3(c) are particle size distribution graph by counting 200 nanoparticles. The histogram of the size distribution is characterized by a Gaussian function (solid line). It is found that average particle size of NZFO-600 and NZFO-800 is obtained as 23 nm and 46 nm, respectively, which are in agreement with those of the XRD patterns. Therefore, the average crystallite size obtained from XRD analysis is taken as the average particle size. High-resolution TEM (HRTEM) analysis is employed to determine the crystal facets and orientation, as shown in Figures 3(b) and 3(d). In Figure 3(d), two sets of lattices are present and they are oriented at a certain angle with the interfringe spacing of 0.24 nm and 0.25 nm, corresponding to spinel (222) and (311) lattice planes of NZFO-800 ferrite.
3.2. Magnetic Properties
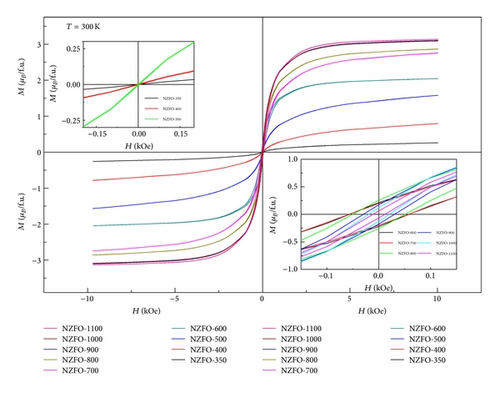
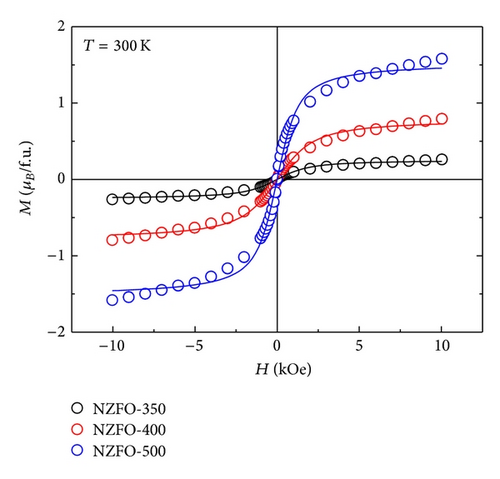
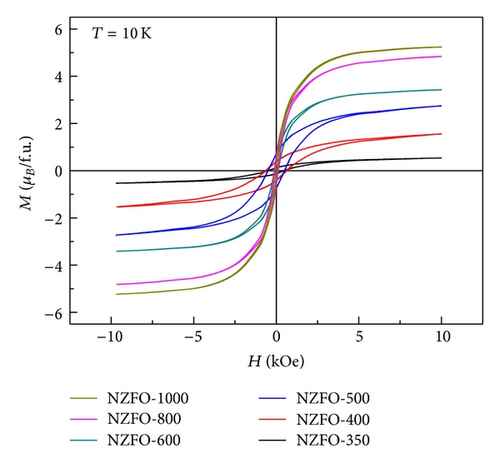
Figure 6 shows M-H loops of the nanoparticles with different particle sizes at 10 K. NZFO nanoparticles show typical hysteresis behaviors. The values of Hc are listed in Table 1.
The variation of Ms and Hc with different particle size is shown in Figure 7. The magnetic moment for formula unit in Bohr magneton is calculated and the obtained data are displayed in Table 1. It is seen that Ms decreases as the particle size decreases. Kumar et al. [18] had reported that the existence of spin canting, cation distribution, and disordered surface layer could result in decreased Ms. The surface effects become significant as the particle size decreases, which can lead to the decrease of Ms. Another possible factor is the redistribution of cations between A and B sites, which grows the net magnetic moment. According to Neel’s two sublattice model of ferrimagnetism, O4 configuration has 6 μB for formula unit. The value is higher than our Ms value, which confirms cation disorder and redistribution. Sreeja et al. [19] had confirmed an abnormal cation distribution of Ni0.5Zn0.5Fe2O4 with different annealing temperature by Mössbauer spectroscopic study. At lower sintering temperatures, weaker magnetic superexchange interaction and lattice defects can also lead to the smaller value of Ms [20]. Figure 7 shows that Hc increases rapidly as particle size increases with a maximum value of 58.2 Oe at 600°C (30 nm) and then decreases with further increases in particle size. The same observation of Hc change with particle size in Ni-Zn ferrite was reported in earlier study [16]. From the inset of Figure 7, Hc increases as the particle size increases, reaches a maximum value, and then decreases at 10 K as well as at 300 K. The values of Hc decrease as the temperature of measurement increases. A critical particle size of 10 nm is obtained at 10 K. The critical particle size decreases as the temperature of measurement decreases from 300 K to 10 K. Thus, in Figure 7, the peak value of Hc has shifted to the lower particle size when the temperature decreases from 300 K to 10 K. A similar result had been reported by George et al. [10]. The values of Hc and Mr near to zero for NZFO-350, NZF-400, and NZFO-500 display superparamagnetic nature at 300 K. Generally, the Hc for magnetic nanoparticles is closely related to their particle size. Smaller particle sizes correspond to a lower Hc.

This variation of the Hc with particle size can be explained on the basis of domain structure, critical size, and the surface and interface anisotropy of the crystal. A crystallite will spontaneously break up into a number of domains in order to reduce the large magnetization energy if it is a single domain. The ratio of the energy before and after division into domains varied as [10], where D is the particle size. So, the energy reduces as D decreases, which suggests that the crystallite prefers to remain single domain behavior for quite small D.
4. Conclusion
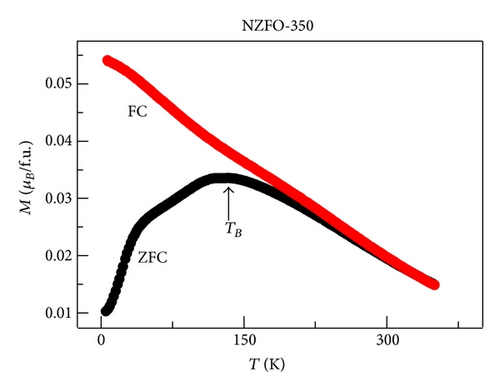
XRD analysis reveals that all samples are the single phase cubic spinel structure, and higher annealing temperature could lead to lattice shrinkage and grain growth. The strain is also induced during the annealing process. The particle size from TEM morphology is in close agreement with the crystallite size by W-H plots. The room magnetic measurement shows superparamagnetic nature for NZFO-350, NZFO-400, and NZFO-500 ferrites, and others show ferrimagnetic nature. The room temperature saturation magnetization increases as particle size increases, with a maximum value of 3.14 μB/f.u. corresponding the particle size of 96 nm. The coercivity increases with increasing particle size and reaches a maximum when the particle size reaches a critical size and then decreases as the particle size increases further. This is due to the transition from single domain to multidomain structure. ZFC and FC magnetization behaviors confirm systematically the effect of surface effects on magnetic behavior.
Acknowledgments
This work was financially supported by the National Nature Science Foundation of China (Grants nos. U1232210, 11274314, 51002156, and 11104098) and the Natural Science Major Foundation of Anhui Provincial Education Department (Grant no. KJ2012ZD14).


