Two-Dimension Hydrodynamic Dispersion Equation with Seepage Velocity and Dispersion Coefficient as Function of Space and Time
Abstract
The contamination through the geological formation cannot move and disperse with the same speed and dispersion coefficient, respectively, due to the variability of the geological formation. This paper is therefore first devoted to the description of the hydrodynamic advection dispersion equation with the seepage velocity and dispersion coefficient as function of space and time. Secondly the equation is solved via two analytical techniques: the homotopy decomposition method and the differential transform method. The numerical simulations of the approximated solutions are presented.
1. Introduction
Most of the Earth’s liquid freshwater is found, not in lakes and rivers, but is stored underground in conglomerations of voids, called aquifers, and present in the geological formations constituting the earth’s mantle, where they act as reservoirs of water for rivers and streams, especially during periods of drought or low rainfall—a phenomenon commonly called baseflow. This resource, conventionally referred to as groundwater, therefore forms an essential, in fact major, component of the fresh water resources, as illustrated by the fact that that nearly two billion people depend directly on groundwater or their drinking water, while 40% of the world’s food is produced on farmlands irrigated with groundwater [1].
One reason why groundwater so often constitutes the main source of drinking water in many cities and towns around the world is because it is frequently present in sufficient quantities at the point of demand. However, this seemingly advantage may sometimes be its greatest disadvantage, especially in situations where the groundwater occurs at shallow depths and the area overlying the aquifer is populated densely. This problem is particularly relevant in the present technological age to its vast quantities of waste that is often disposed in an uncontrolled manner. Since space, time, and mass are measurable, and numbers form the basis of all mathematics, the question arises if it is not possible to combine the power of human reason with well-planned observations and describe natural phenomena in abstract mathematical terms? This question leads us to the mathematical formulation of the flow of subsurface water in the geological formations. The development of a theory for natural phenomenon can be briefly summarized in four steps [2, 3].
Apply the rules of mathematical analysis to the observables and try to establish a framework, or hypothesis, able to predict the behaviour of the phenomenon, under different conditions from those used in establishing the hypothesis. The main effort is to establish a suitable mathematical relation between different observables, or what [4] calls a mathematical model for the observables. An ideal mathematical model should not only provide links between different observables, but also lead to a better understanding of the phenomenon. The attractiveness of this approach is that the mathematical model could, in principle, be used to investigate the future behaviour of a given phenomenon and under various conditions. For simplicity, it is always assumed that, the seepage velocity retardation factor and the dispersion coefficient appearing are the mathematical equation describing the movement of contamination in groundwater as constants. However, in the real world observation, these coefficients depend on space and time. One therefore needs to include such behaviour in the mathematical formulation. This paper is therefore devoted to the discursion underpinning the effect of variation in time space of the seepage velocity and dispersion coefficient on one hand, and on the other hand a possible analytical solution of this equation.
2. Mathematical Formulation
3. Analytical Solutions
Environmental phenomena, such as groundwater pollution, are highly complex phenomena, which do not lend themselves readily to analysis of analytical models. The discussion presented in this section will therefore be devoted to the derivation of analytical solution to the advection dispersion equation (1). As V. M. Alexandrov wrote in the foreword of a popular science book “Asymtotology: ideas, methods, and applications [sic]”, asymptotic methods belong to the, perhaps, the most romantic area of modern mathematics [6]. Though computer science is growing very fast and numerical simulation is applied everywhere, nonnumerical issues will still play a large role [7–11].
There exist some alternative analytical asymptotic approaches, such as the nonperturbative method [12], modified Lindstedt-Poincare method [13], variational iteration method [14], Adomian decomposition method [14], homotopy perturbation method [15], and book-keeping artificial parameter perturbation method [15]. Recently to solve the groundwater flow equation, Atangana and Botha proposed a modified decomposition method called homotopy decomposition [16]. In this section we make use of two different methods including the HDM and DTM to derive approximate solution of (1). We will start with HDM.
3.1. Useful Tools for the Homotopy Decomposition Method [17–19]
3.2. Differential Transform Method (DTM) [17, 20–22]
- (1)
if w(x, y, t) = W1(x, y, t) ∓ W2(x, y, t), then W(k, h, m) = W1(k, h, m) ∓ W2(k, h, m),
- (2)
if w(x, y, t) = cw1(x, y, t), then W(k, h, t) = cW1(k, h, t) where c is a constant,
- (3)
if w(x, y, t) = d1w1(x, y, t)/dx1, then W(k, h, t) = (k + 1)W1(k + 1, h, m),
- (4)
if w(x, y, t) = d1w1(x, y, t)/dy1, then W(k, h, t) = (h + 1)W1(h + 1, k, m),
- (5)
if w(x, y, t) = d1w1(x, y, t)/dt1, then W(k, h, t) = (m + 1)W1(m + 1, k, h),
- (6)
if w(x, y, t) = w1(x, y, t)w2(x, y, t), then .
4. Applications
In this section, we apply these methods for solving the two-dimension hydrodynamic dispersion equation with seepage velocity and dispersion coefficient as function of space and time.
Example 1. Let us consider in (1) the following coefficients:
The following figure shows the numerical simulations of the approximated solutions obtained via HDM and DTM.
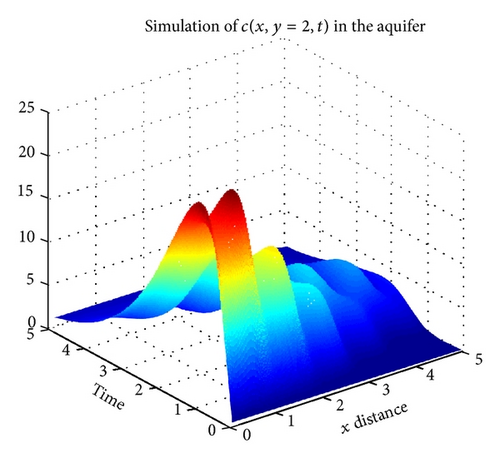
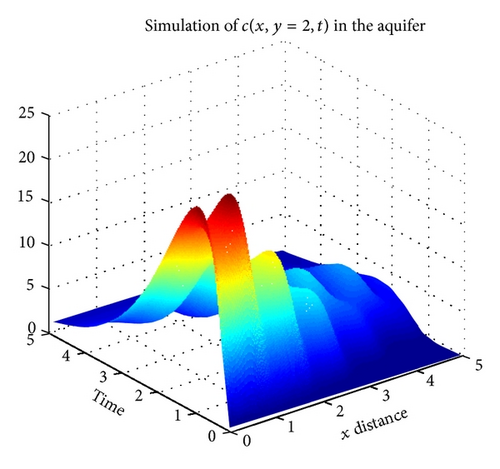
Figures 1 and 2 show the numerical simulation of the approximate solution via HDM and DTM, respectively. Here we fixed y = 2 and we consider the concentration to be a function of x and t. It can be observed that both methods give pretty much the same results for the first four components of the series solution.
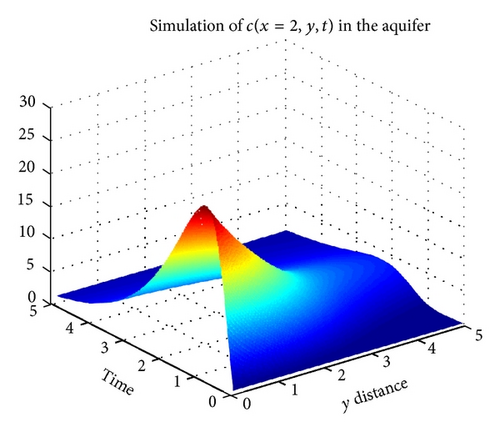
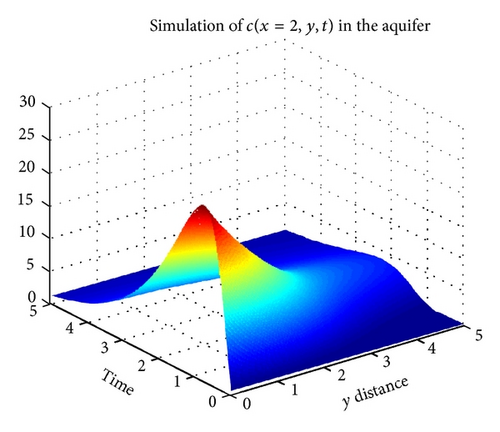
Figures 3 and 4 show the numerical simulation of the approximate solution via HDM and DTM, respectively. Here we fixed x = 2 and we consider the concentration to be a function of x and t.
Figures 5 and 6 are the contour plot obtained via Mathematica. These figures show the possible pathway taken by the pollution through the geological formation called aquifer.
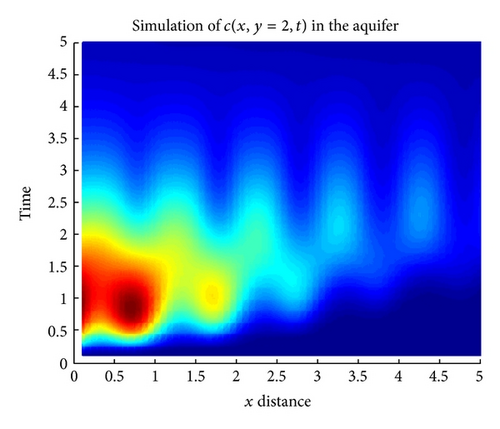
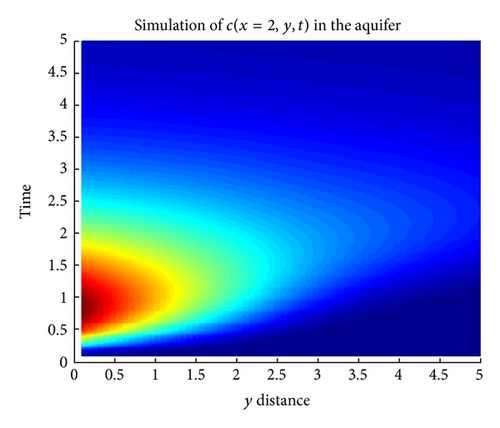
Figure 7 shows the contour plot of the approximate solution as a function of x and y for a fixed time. In practice this figure shows the behaviour of the contamination through the geological formation for a fixed time t = 10. The figure shows that since the seepage velocity and the dispersion coefficient are function of space, the pollution will not have the same intensities everywhere in the aquifer. There will be certain place in the aquifer with more pollution than other, depending on the velocity and the dispersion coefficients associated.

5. Discussion and Conclusion
Natural geological deposits with highly contrasting permeability may form mobile and relatively immobile zones, where the potential mass exchange between mobile and immobile zones results in a wide time distribution for solute trapping. The transport process in groundwater is, by its very nature, always in contact with the matrix of an aquifer. There is thus a possibility that the solutes may interact with the rock matrix and one another. A true mathematical model for groundwater pollution must therefore be able to account for interactions between the dissolved solids and matrix of the aquifer. It will thus be advantageous to look at the nature of the interactions between dissolved solids and a porous medium that may be expected in groundwater pollution. Experimental evidence indicates that when a dissolved solid comes in contact with the matrix of a porous medium, it may (a) pass through the medium with no apparent effect, (b) be absorbed by the porous matrix, and (c) react with the porous matrix and other substances dissolved in the fluid. The dissolved solids encountered in porous flow are, for this reason, often classified as conservative, nonconservative, and reactive tracers [22]. This behaviour implies that the quantity of dissolved solids in a porous medium depends not only on the flow pattern, but also on the nature of the porous matrix and the solution. These situations (a), (b), and (c) can be characterized efficiently by the time-nonlocal model, including the hydrodynamic dispersion equation with seepage velocity and dispersion coefficients as function of space and time as described by Figure 5. If the high-permeable material tends to form preferential flow paths, such as the interconnected paleochannels observed in alluvial depositional systems, then the solute transport may show a heavy leading edge, which can be described by the hydrodynamic dispersion equation with seepage velocity and dispersion coefficients as function of space and time.


