Forecasting the Cell Temperature of PV Modules with an Adaptive System
Abstract
The need to reduce energy consumptions and to optimize the processes of energy production has pushed the technology towards the implementation of hybrid systems for combined production of electric and thermal energies. In particular, recent researches look with interest at the installation of hybrid system PV/T. To improve the energy performance of these systems, it is necessary to know the operating temperature of the photovoltaic modules. The determination of the operating temperature Tc is a key parameter for the assessment of the actual performance of photovoltaic panels. In the literature, it is possible to find different correlations that evaluate the Tc referring to standard test conditions and/or applying some theoretical simplifications/assumptions. Nevertheless, the application of these different correlations, for the same conditions, does not lead to unequivocal results. In this work an alternative method, based on the employment of artificial neural networks (ANNs), was proposed to predict the operating temperature of a PV module. This methodology does not require any simplification or physical assumptions. In the paper is described the ANN that obtained the best performance: a multilayer perception network. The results have been compared with experimental monitored data and with some of the most cited empirical correlations proposed by different authors.
1. Introduction
In the world energy scenario affected by the reduction of fossil fuels supply used for the production of the electrical and thermal energy, the potential offered by renewable energy sources (RES), is strategic for the industrial countries [1]. The exploitation of RES has promoted several thermal and electric technologies, improving the overall energy conversion efficiency [2]. The development of PV systems and of solar thermal technology is playing an important role in the building integration, to cover the electricity and thermal needs for the production of heat water and the internal heating.
In recent years, several researches have led to the installation and the study of hybrid devices [3]: hybrid photovoltaic/thermal collector or hybrid (PV/T) system.
The temperature of PV module increases when it absorbs solar radiation; this temperature raising provokes a decrease in electrical conversion efficiency; a PV/T system is capable of partially avoiding this undesirable effect. The hybrid technologies permit to control the temperature system; the presence of a water/air circulation system cools the PV module helping to increase the electrical output, and furthermore the hot water can be afterword exploited, improving the overall efficiency of the whole system [4]. Furthermore, the operating temperature of the PV modules has a significant importance when used in building integrated photovoltaic energy system (BIPV). Many authors have pointed out how the operating cell temperature must be evaluated for the optimal sizing of BIPV system [5–9]. The assessment of Tc can therefore give important results in terms of indoor thermal quality in the sustainable building field, especially in the application of BIPV as smart windows [10].
For these reasons, the evaluation of the PV temperature is essential to ensure high performances.
As described by Skoplaki and Palyvos in [11], many correlations for predicting the electrical performance of a photovoltaic module have been proposed and used by different authors. This report highlights the role of the temperature of the silicon as the main parameter that affects the conversion efficiency.
However, as better explained in the following, the equations that describe the energy balance of a PV system make the determination of the operating temperature of a PV module not simple. In fact, because of the different nature of the variables present in the balance (physical, thermoelectrical, and environmental) and the uneasy determination of many key parameters (e.g., overall heat transfer coefficient and optical properties), the evaluation of the cell temperature, by using an empirical correlation, could lead to not reliable results.
In this work, the authors explore the possibility to offer an alternative method to assess the operating temperature of PV devices by using adaptive techniques. Adaptive systems such as ANN should allow predicting, in a fast and reliable way, the temperature of the PV module by varying all the boundary conditions. To validate the reliability of the proposed ANN, two different modules were tested and the results were compared with experimental monitored data.
2. The Cell Temperature of a PV Module
In general, the performance of a photovoltaic module is defined according to the “peak power,” which identifies the maximum electric power supplied by a PV system when it receives a solar irradiance of 1 kW/m2 (Gref) at the cell temperature of 25°C (Tref). These conditions are only nominal because the solar irradiance has a variable intensity and the module is subject to considerable temperature changes [12].
Indeed, in actual conditions it is essential to evaluate the operating condition under all possible circumstances of solar irradiance G, cell temperature Tc, wind speed W, air temperature Tair, and electric load RL.
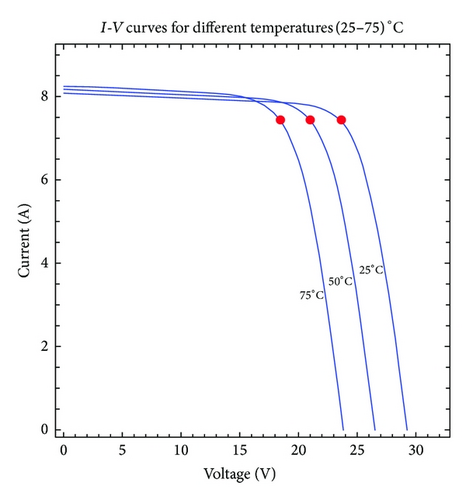
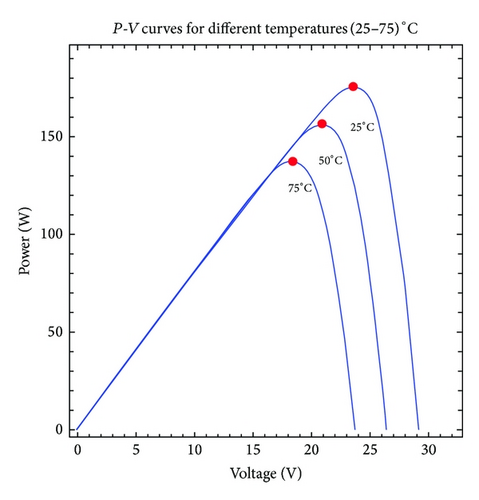
In Figure 1, it is possible to observe how the intersection between the load line RL and I-V curves identifies the working point; with the same graphical method, it is possible to identify the working point in terms of electric power; the red circles identify the maximum power points. As it is easy to understand, the Tc is a key parameter that affects the energy conversion efficiency of a PV module: increasing the temperature decreases the delivered power.
This very simple method yields satisfying results only if the PV modules are not roof integrated.
However, the NOCT approach estimates Tc based only on the passive behaviour of the PV, not taking into account at the same time the actual weather variables and the electricity production regimes of the PV module. This approach neglects the fact that not all the absorbed solar irradiance is converted into electricity: generally, only 15–18% is converted into electricity; the remaining part of the insolation is transformed into heat contributing to increase the temperature cell.
The heat transfer between the PV panel and the surrounding environment is driven by a global heat transfer coefficient, which describes the radiative and convective exchange processes.
For these reasons, in this work after a simplified description of the energy balance of a PV, which highlights the dependence of the operating temperature by some environmental parameters and by the thermophysical properties of a PV system, the authors underline how the determination of Tc using conventional calculation procedures is often complex and difficult to solve. On the other hand, the use of any empirical relationship, typically characterized by some assumptions and simplifications, often affects the results. In the following, the application of the ANN approach, to predict the operating temperature of a PV module, is proposed.
Recently, these methodologies have received attention and increased their use very successfully in the implementation of MPP searching [21–30]. As previously mentioned, this method does not need exact mathematical models, can work with vague inputs, and can handle nonlinearities [31].
3. The Energy Balance of a PV Module
As already noted, the efficiency of a photovoltaic panel depends mainly on the intensity of the solar irradiance and cell temperature. Considering a generic PV system the energy exchanges can be depicted by Figure 2.
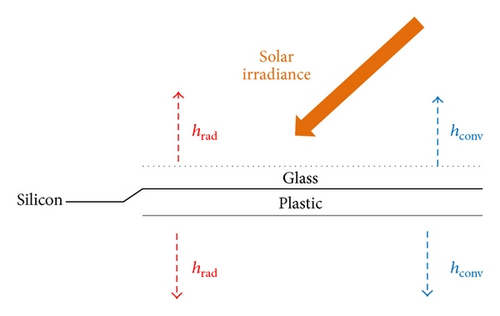
As it is possible to observe, also in this simply lumped parameters approach, the evaluation of the cell temperature is not immediate and it strongly depends on the solar irradiance and air temperature. Furthermore, the presence of exponential terms and implicit expression of electric power complicates the resolution procedure, not allowing the direct mathematical calculation. In addition, the determination of the global heat transfer coefficient U must be taken into account.
Unfortunately, the case study of hot inclined rear surfaces is still an open problem [33].
If we give up the idea of analytically solving the problem, as previously described in Section 2, in the literature, it is possible to find different correlations about the Tc value [11, 17, 34–37]. However, each correlation is characterised by the same simplifications and/or assumptions that do not represent the complexity of the PV energy balance accurately.
4. Definition of ANN
ANNs are computational intelligence architectures based on emulating biological neural networks and have the capability of “learning” the behavior of input data. The basic unit of an ANN is a neuron. An artificial neuron (AN) acts in the same way as a biological neuron; each has a set of inputs and produces an output based on these inputs. A biological neuron produces an output by comparing the sum of each input to a threshold value; based on that comparison it produces an output. In addition, it is able to vary the weight of each input according to the priority of the input. The inputs and outputs of a biological neuron are called synapses; they may act as inputs to other neurons or as outputs. Thus, the set of neurons and synapse creates an interconnected network, which produces an output based on weights, sums, and comparisons [22].
Generally, an artificial neural network consists of multiple interconnected artificial neurons, arranged in several layers; Figure 3 shows a schema of a typical arrangement of neurons in an ANN.
The use of ANNs often makes it possible to identify correlations between data that are very complex to assess.
5. Experimental Setup
To apply a neural approach it is necessary to have a large database of specific data that represents the analysed system. For this reason, to build and to train a specific ANN, a specific test facility situated on the roof of the Energy Department of University of Palermo (38° 1070N, 13° 1220E) has been made up. The experimental device was built up to permit to acquire the thermoelectrical parameters of photovoltaic modules and the weathers variables that define the energy balance of a PV system. The test facility consists of two silicon panels (Kyocera KC175GHT-2 and Sanyo HIT 240 HDE4) connected with a precision resistance set (Figure 4). The technical data of the two panels provided by the manufacture are shown in Tables 1 and 2.
| Kyocera KC 175 GH-2 | ||
|---|---|---|
| Maximum power | Pmax [W] | 175 |
| Maximum voltage | Vmp [V] | 23.6 |
| Maximum current | Imp [A] | 7.42 |
| Open-circuit voltage | VOC [V] | 29.2 |
| Short-circuit current | ISC [A] | 8.09 |
| Thermal voltage coefficient | [V/°C] | −0.109 |
| Thermal current coefficient | [mA/°C] | 3.18 |
| Sanyo HIT 240 HDE-4 | ||
|---|---|---|
| Maximum power | Pmax [W] | 240 |
| Maximum voltage | Vmp [V] | 35.5 |
| Maximum current | Imp [A] | 6.77 |
| Open-circuit voltage | VOC [V] | 43.6 |
| Short-circuit current | ISC [A] | 7.37 |
| Thermal voltage coefficient | [V/°C] | −0.109 |
| Thermal current coefficient | [mA/°C] | 2.21 |
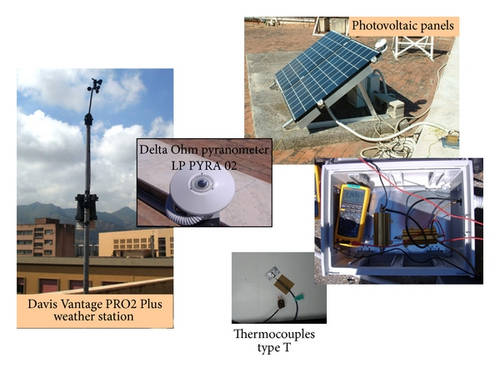
The measurements were performed with a data acquisition module National Instruments NIUSB-9221 and a Delta Ohm pyranometer (mod. LPPYRA 02 AV) linked to an Advantech ADAM 6024 module. A DavisVantage PRO 2 Plus weather station was used to collect the measurements of air temperature and relative humidity, wind speed and direction, horizontal global solar irradiance, and atmospheric pressure. The temperature of the panels was measured using some thermocouples (type T, copper-constantan) put in three different points of each panel [34].
In this way, in addition to the weather data climate collected by the weather station and the cell temperature measured by the thermocouples, it was also possible to measure and collect electric data related to the operation panel: the power delivered, the short-circuit current ISC, and the open-circuit voltage VOC.
6. Preliminarily Analysis of Data Collected
To correctly apply the neural approach, all data must be subject to a preprocessing step that consists in a preliminary analysis that permits to identify possible outliers, to remove uncorrected values, to carry out a statistical analysis, and to perform a correlation analysis. The analysis of the common current-voltage curves given by manufactures at constant temperature or constant solar irradiance does not allow a correct evaluation of the thermoelectrical behaviour of a photovoltaic panel because, in actual conditions, the temperature and the solar irradiance change simultaneously.
- (i)
when the ratio between the working voltage V and the voltage of maximum power Vmpp,panel is less than 0.95, the I-V characteristic is almost horizontal, and the power output is proportional to the incident insolation;
- (ii)
when the ratio V/Vmpp,panel is greater than 1.05, the I-V characteristic of the panel decreases much more rapidly and the influence of insolation becomes less significant (saturation conditions);
- (iii)
the regimen identified by a ratio 0.95 < V/Vmpp,panel < 1.05, characterizes the state of a PV panel connected to a maximum power point tracking system (MPPT) in which the load dynamically adapts to generate the maximum power.
In this case, the two couples of constants pertaining the two modules have been evaluated using Tables 3 and 4 for the Kyocera module and Tables 5 and 6 for the Sanyo module.
| Solar irradiance [W/m2] | ||||||
|---|---|---|---|---|---|---|
| 1000 | 800 | 600 | 400 | 200 | 40 | |
| Pmpp [W] | 175.112 | 138.418 | 102.236 | 66.7111 | 32.1507 | 5.8841 |
| Vmpp [V] | 23.6 | 23.3241 | 22.977 | 22.501 | 21.7091 | 19.9224 |
| Impp [A] | 7.41999 | 5.93455 | 4.4495 | 2.9648 | 1.48098 | 0.295351 |
| Cell temperature [°C] | |||
|---|---|---|---|
| 25 | 50 | 75 | |
| Pmpp [W] | 175.112 | 156.099 | 137.09 |
| Vmpp [V] | 23.6 | 20.975 | 18.4243 |
| Impp [A] | 7.41999 | 7.44215 | 7.44069 |
| Solar irradiance [W/m2] | ||||||
|---|---|---|---|---|---|---|
| 1000 | 800 | 600 | 400 | 200 | 40 | |
| Pmpp [W] | 240.335 | 189.975 | 140.323 | 91.5759 | 44.1493 | 8.08932 |
| Vmpp [V] | 35.4998 | 35.0848 | 34.5641 | 33.8511 | 32.6691 | 30.0095 |
| Impp [A] | 6.77004 | 5.41475 | 4.0598 | 2.70526 | 1.35141 | 0.269559 |
| Cell temperature [°C] | |||
|---|---|---|---|
| 25 | 50 | 75 | |
| Pmpp [W] | 240.335 | 222.492 | 204.759 |
| Vmpp [V] | 35.4998 | 32.7991 | 30.1697 |
| Impp [A] | 6.77004 | 6.78349 | 6.78691 |
For the Kyocera module, the mathematical interpolations of the data collected in the previous tables permitted to evaluate the following values: a = 1.1395 and b = 26.172.
For this last module, the mathematical interpolations of the data collected in the previous tables permitted to evaluate the following values: a = 1.7007 and b = 26.153.
In this way filtering the data for the operating regimen represented by a ratio 0.95 < V/Vmpp,panel < 1.05, it was possible to identify the data close to the maximum power points. Filtering the data collected for both modules, two datasets, indicated in Table 7, have been created; the 15% of the filtered data will be used as a test dataset (not used for the ANN training phase).
| Kyocera panel | Sanyo panel | |
|---|---|---|
| Original datasheet vectors | 3832 | 2310 |
| Filtered dataset vectors | 333 | 205 |
| Test dataset vectors | 50 | 31 |
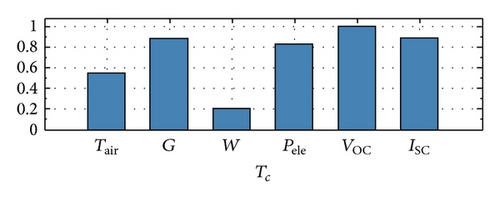
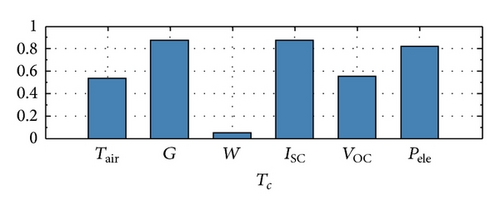
The correlation analysis for the two different PVmodules (Figures 5 and 6) permits a first evaluation of the mutual relationships between Tc and all the other features. The preliminary correlation analysis has identified a strong correlation between Tc and the solar irradiance G, the short-circuit current ISC, the open-circuit voltage VOC, and the electrical power Pele; on the other hand, it has identified a moderate correlation with air temperature and wind speed.
A statistical analysis permitted to assess the maximum (Max), mean (Mean), and minimum (Min) values and the standard deviation (StDev) of all considered features (Tables 8 and 9).
| Tair [°C] | P [W] | G [W/m2] | W [m/s] | ISC [A] | VOC [V] | |
|---|---|---|---|---|---|---|
| Max | 27.27 | 165.56 | 1078.20 | 7.20 | 8.73 | 30.24 |
| Min | 9.90 | 22.17 | 126.41 | 0.00 | 1.01 | 26.50 |
| Mean | 19.57 | 110.21 | 729.30 | 2.32 | 5.91 | 28.13 |
| StDev | 2.39 | 48.35 | 293.22 | 1.231 | 2.38 | 0.74 |
| Sample | 333 | 333 | 333 | 333 | 333 | 333 |
| Tair [°C] | P [W] | G [W/m2] | W [m/s] | ISC [A] | VOC [V] | |
|---|---|---|---|---|---|---|
| Max | 30.93 | 222.27 | 1044.33 | 5.23 | 3.84 | 64.44 |
| Min | 17.87 | 23.14 | 129.89 | 0.00 | 0.48 | 62.11 |
| Mean | 25.83 | 156.63 | 725.44 | 2.509 | 2.77 | 63.75 |
| StDev | 1.89 | 58.25 | 259.68 | 1.14 | 0.95 | 0.47 |
| Sample | 205 | 205 | 205 | 205 | 205 | 205 |
7. Application of ANN
According to the type and nature of data that have been collected from the experimental set, it was possible to choose several topologies of neural networks. Different simulations relating to several topologies of ANNs have been tested, but in this work, only the best ANN will be described.
7.1. One Hidden Layer MLP
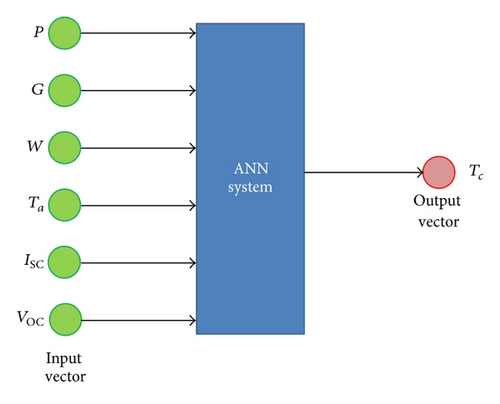
A multi-layer perception (MLP) is a kind of ANN consisting of multiple layers of ANs in which each layer is fully connected to the next one. Except for the input ANs, each node is a neuron with a nonlinear activation function. MLP utilizes a common supervised learning technique for training the network. This topology is one of the simplest available for ANNs; our MLP artificial network is composed by: two input sources, two function blocks, two weight layers, one hidden weight layer and one error criterion block. In Figure 7 our one hidden layer MLP topology is schematized to evaluate the cell temperature.
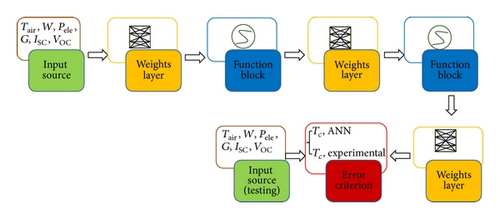
The input source represents all the available data that can be used for training or testing; in this case it contains the total vectors obtained after applying the filter (Table 7): 85% of the total filtered vectors were used for the training phase and 15% of the total filtered vectors were used for the testing phase.
The function blocks can be seen as nonlinear thresholds for the propagation of the signals. They give the adaptive system its nonlinear computing capabilities, and those used in the following proposed network have a sigmoidal function.
The weights layer represents the long-term memory of the system and is adjusted during the learning phase. Finally, the error criterion is a block that takes two signals and compares them according to a specific criterion; the signals terminate to flow across the system. The training phase has been optimised concerning the number of epochs to avoid overfitting.
In Table 10 are reported the number of epochs in order to avoid the overfitting for the two different PV panels.
| Kyocera panel | Sanyo panel | |
|---|---|---|
| Learning time [s] | 6.00 | 1.56 |
| Epochs | 3.326 | 1.542 |
After the training, for each ANN the postprocessing phase evaluates the mean error (ME) and the mean absolute error (MAE) that represents the quantity used to measure how close forecasts or predictions are to the eventual outcome. Furthermore, the standard deviation (StDev) that shows how much variation or “dispersion” exists from the average (mean, or expected value) was evaluated.
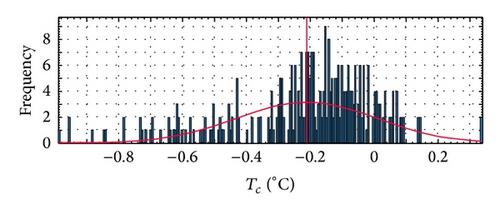
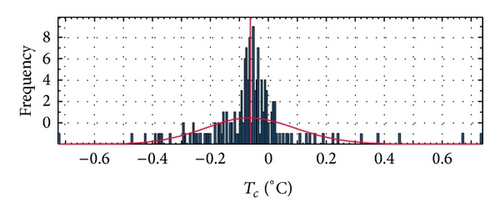
Figures 8 and 9 show the ME distribution for the Kyocera and Sanyo modules, respectively, in terms of cell temperature.
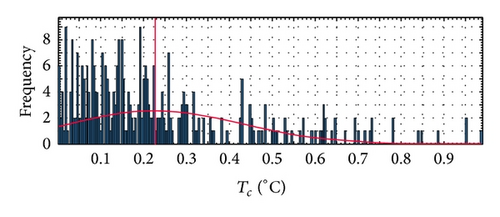
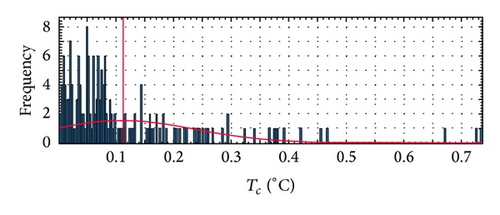
Figures 10 and 11 show the MAE distribution for the Kyocera and Sanyo modules, respectively, in terms of cell temperature.
In Table 11 the values of ME, MAE, and StDv of Tc case, for the two different PV panels are reported.
| Kyosera module | Sanyo module | |||
|---|---|---|---|---|
| T [°C] | StDv (T) | T [°C] | StDv (T) | |
| ME | −0.21 | 0.22 | −0.06 | 0.16 |
| MAE | 0.23 | 0.20 | 0.11 | 0.13 |
Furthermore, the confidence plot that gives an estimated range of values, which is likely to include the calculated cell temperature with a probability of 95% was evaluated. Due to the physics of the analyzed problem, the confidence plot was evaluated only for daylight hours neglecting the temperature trend during the night. In Figure 12 the confidence plot of Tc for the Kyocera module is ±0.23°C, and in Figure 13 the confidence plot of Tc for the Sanyo module is ±0.74°C.
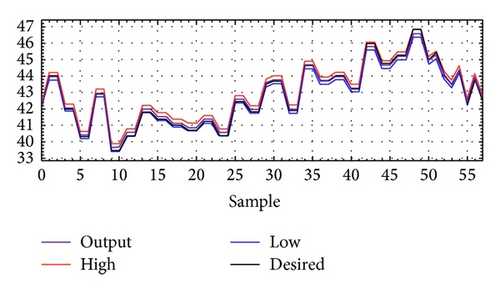
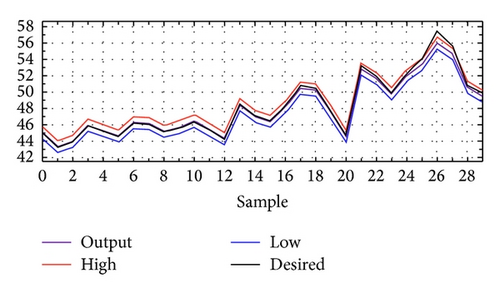
In these figures the range of the confidence plot was indicated by the red (high) and blue (low) lines, while the measured data are indicated by the black line and those obtained from the ANN by the purple line. As it is possible to see the output data coincide perfectly with the desired data with a very narrow confidence band.
8. Results and Discussion
Based on analysis of the results obtained, it is clear as the proposed ANN approach for evaluating the operating temperature gives very good performances, characterized by an extremely narrow confidence band that does not exceed ±0.7366°C. This methodology is characterised by a great flexibility and reliability providing excellent results for any kind of modules: monocrystalline and/or polycrystalline. Furthermore, this approach does not consider any simplifications nor assumptions; finally, the learning time is very short.
To validate the ANN methodology, a comparison between ANN results and the Tc calculated with some of the most cited empirical correlations was carried out extracting the MAE values.
In this work were chosen the following correlations.
The results shown in Table 12 were obtained by applying the previous correlations at the same modules (Kyocera and Sanyo) for the same data set (filtered data) and calculating the mean absolute error between the measured data and the calculated data.
| Correlation | Mean absolute error [°C] | Note | |
|---|---|---|---|
| Kyocera | Sanyo | ||
| ANN | 0.23 | 0.11 | MLP topology |
| Servant | 4.62 | 4.01 | α = 0.0138, β = 0.031, γ = 0.042, W = 1 m/s |
| Duffie and Beckman | 16.36 | 14.38 | τα/U taken as a constant |
| Hove | 16.09 | 16.32 | τα/U determined experimentally |
9. Conclusion
In this paper, an artificial neural network approach has been proposed to determine the operative temperature of PV modules. As previously described, the energy balance of a generic PV system, because of the different natures of the parameters (thermoelectric, environmental, and physical) and the complex mathematical formulation, is not easy to solve. Different authors proposed several empirical correlations which should permit obtaining directly the PV module operating temperature, developed from common geometries and weather conditions. Generally, if the correlations are in implicit form, an iteration procedure is necessary for the calculation; if the correlations are in explicit form, very often they are referred only to references conditions or sometime they use same constant values. In any case, these assumptions and simplifications could affect the reliability of the results. The application of the ANN approach, instead, represents a simple and fast solution to correctly evaluate the operative regimen of a PV module by varying all the boundary conditions.
In this work the authors proposed a one hidden layer MLP to determine the Tc of a generic PV panel. The ANN has been tested and trained with experimental data consisting of air temperature, wind speed, solar irradiance, power output, open-circuit voltage, short-circuit current, and cell temperature. The results obtained of the ANN issued a reliable tool to forecast the cell temperature of the PV panel. Comparing the performances of this network with those of some of the most cited empirical correlations, the ANN results present a significant lower MAE. Furthermore, the very short time requested for the training phase suggests that the ANN could be integrated in a software for run-time evaluation of the cell temperature.


