New Model for Evaluation of FRP Debonding Strain for Russian Design Code
Abstract
The most probable failure mode of FRP-strengthened RC beams is an intermediate crack-induced debonding. Over the last 13 years, researchers developed several methods for calculation strain corresponding to delamination of FRP. A significant number and diversity of existing foreign and domestic methods make the design complex process. The aim of this study was to propose a simple method for calculating FRP debonding strains, based on the best international achievements and adapted for use in Russia. To achieve this goal, the authors performed a review and reliability assessment of existing foreign and domestic meth-ods. Reliability assessment is made by comparing the calculated and experimental data. Experimental data were collected from the existing literature. After reliability assessment, the most simple and accurate method was selected among the considered. On the basis of the chosen method, the authors proposed a formula for calculating the design value and characteristic value strain corresponding to delamination of FRP. The results of calculations by the authors’ formula are more economical than the original method and have the required reliability for these variables. The proposed method is recommended for use in the design of flexural FRP-strengthened RC beams in Russia.
1. Introduction
- (1)
steel yield and FRP rupture;
- (2)
steel yield and concrete crushing;
- (3)
concrete compression failure;
- (4)
shear failure;
- (5)
flexure crack-induced interfacial debonding;
- (6)
flexural-shear crack-induced interfacial debonding;
- (7)
concrete cover separation;
- (8)
plate-end interfacial debonding;
- (9)
peeling off caused by the unevenness, irregularities, and roughness of the concrete surface.
All of these typical failure modes are recognized for flexural FRP-strengthened members and are widely reported in the scientific literature [1–6]. Modes (1)–(4) are similar to conventional bending failure of reinforced concrete elements. Modes (5)–(9) are unique and peculiar to the structures reinforced by externally bonded FRP systems. These modes failures usually occur before ultimate bearing capacity of the structure to bending or shear achieved. In practice modes (7)-(8) are often eliminated by gluing to the support element areas anchorage transverse U-shaped hoop. Mode (9) is prevented by quality surface preparation. Modes (5)-(6) are generally defining the design. To prevent such an intermediate crack-induced debonding failure mode at ULS, the strain (stress) in FRP reinforcement should be limited to the level at which debonding may occur due to the opening of flexural flexural-shear cracks in the beam’s tension zone in the middle of the span.
Calculation of FRP strain corresponding to delamination is set out in a number of foreign guidelines [7–11]. This issue is also dealt with in [12–14].
Today in Russia, there is no national code for the design and construction of externally bonded FRP systems for strengthening concrete structures. At the end of 2012 it was proposed to discuss the first draft of the code “strengthening of reinforced concrete structures with composite materials” [15]. The draft is developed by the Research, Design and Technological Institute for Concrete and Reinforced Concrete named after Gvozdev supported by a number of interested companies, long before the draft methodology for the design and construction of externally bonded FRP systems for strengthening concrete structures were presented at a number of guides, which do not have the status of national standard [16–21]. These guides are designed by the foreign companies-suppliers of technologies and materials in Russia or by domestic institutions on the orders of these companies.
Calculation of FRP strain corresponding to delamination stated in the draft and some guides is taken from “manual for strengthening reinforced concrete structures with composite materials” [16]. In the guide of “BASF Building Systems” company [20] (further STO BASF) and handbook [21] (further handbook fife), the methods of calculating of FRP strain corresponding to delamination are adaptations of the approach outlined in the ACI 440.2R-08 [7]. Strictly speaking, the approach outlined in the manual [16] was also borrowed from the earlier edition of ACI 440.2R-02 [22].
Thus, the development of Russia’s standard framework for enhancing structure by FRP has gone the way of borrowing foreign developments. However, the choice of a basic methodology for calculating of FRP strain corresponding to delamination remains unclear. Why the American approach was formed on the basis of the existing Russian practices?
- (1)
perform a review of the existing foreign and domestic methods of calculating of FRP strain corresponding to delamination;
- (2)
fulfill their verification and reliability assessment;
- (3)
choose among the considered the most reliable method to assess its shortcomings;
- (4)
make the necessary adjustments to the selected model to reduce its weaknesses and adaptation to Russian regulatory basis of values and notation;
- (5)
assess the reliability of the proposed model.
2. A Review of Existing Theoretical Models
A detailed review of foreign and domestic methods sets out in a companion paper [23]. Here is a review of some of the methods developed by foreign researchers and not included in the codes.
2.1. Teng et al
where Ef, tf, and bf are the elastic modulus (MPa), thickness (mm), and width (mm) of the bonded plate, respectively, and bc are the specified cylinder compressive strength (MPa) and width (mm) of the concrete block, respectively, L is the bond length (mm), and Le is the effective bond length (mm). A value of 0.427 for α was found by authors [24] to provide a best fit of the shear test data gathered by them.
In [12], the coefficient α in (1) was recalibrated against the collected test data of beams and cantilever slabs failing by intermediate crack debonding. The authors used the 8 experimental results for beams and 6 results for cantilever slabs. It was proposed that a value of 0.48 for α is adopted for design use, which leads to conservative predictions for all test results of the combined database. Note that the experimental data used by the authors had a wide scatter.
Additionally, the authors noted that for simply supported beams with a plate terminated near the supports or cantilever beams and slabs with the plate terminated near the free end, the bond length is generally greater than the effective bond length, so βL is generally equal to 1.0.
2.2. Lu et al
where Ld is the distance (mm) from the loaded section to the end of the FRP plate, ft is the tensile strength of concrete (MPa), and τmax is the maximum shear bond stress (MPa).
We note that 99% of experiments to study the flexural FRP-strengthened elements are organized in the form of 3- or 4-point bending tests. Thus, loading performed by concentrated forces. However, in a real design, calculation of bending elements is performed on a distributed load act; that is, it is not possible to determine Ld.
2.3. Said and Wu
where C1 = 0.23, C2 = 0.2, C3 = 0.35 are constants that were obtained determined from the available experimental result. For design purposes, a strength reduction factor of 0.75 was recommended.
2.4. Comparison of the Models
In this paper and in the companion paper [23], methods for calculation of FRP strain corresponding to delamination are summarized in Table 1. None of the methods of calculation do involve separate design and characteristic values of the strain. Nevertheless, Table 1 shows the formula to calculate these values individually. This separation must be done artificially and for subsequent evaluation of the reliability of methods. In the event that the original source did not specify the formula used to calculate the characteristic value, it was considered that the formula to estimate the design value. The formula for calculating the characteristic value is obtained by eliminating any of the safety factors.
| No. | Formula | Reference | |
|---|---|---|---|
| Characteristic value of FRP debonding strain | Design value of FRP debonding strain | ||
| 1 |
|
[7] | |
| 2 |
|
|
[8] |
| 3 | — | , ΓFk = 0.5 | [11] |
| 4 | , | — | [12] |
| 5 | — |
|
[13] |
| 6 | — | [14] | |
| 7 | , | , | |
| [16–19] | |||
| , γf = 1.1 | |||
| 8 |
|
[20] | |
| 9 | , , , | [21] | |
| 10 | , | , | |
| [15] | |||
| , | |||
- is the specified compressive strength of concrete; n is the number of plies of FRP reinforcement; Ef is the tensile modulus of elasticity of FRP; tf is the nominal thickness of one ply of FRP reinforcement; is the ultimate rupture strain of FRP reinforcement; is the design rupture strain of FRP reinforcement; ψf is the FRP strength reduction factor; CE is the environmental reduction factor; γf,d, γf, γf1, γf2, γE,f, γm, γε,f are the partial factors; γc is the partial factor for concrete; ΓFk is the characteristic value of specific fracture energy; τmax is the maximum shear bond stress; Ld is the distance from the loaded section to the end of the FRP plate; ft is the tensile strength of concrete; km is the bond-dependent coefficient; Rb,n, characteristic value of compressive strength of concrete in compliance with Russian codes; B strength classes for concrete in compliance with Russian codes.
Since the notations of the same quantities of the various authors are different, the following notations have been introduced in Table 1: εfd is the FRP debonding strain, bf is the width (mm) of the bonded plate, b is the width (mm) of the concrete member, and kb is the geometrical factor related to the width of the bonded plate and the width of the concrete member.
A review of the existing foreign and domestic methods of calculating of FRP strain corresponding to delamination showed that neither abroad nor in Russia there is consensus on this issue. The following questions remain open: which of the methods more accurately predicts the actual value of the debonding strains? What is the reliability with which this prediction is performed?
Domestic approaches contained all sorts of safety factors, which complicates the calculation formula. It is not clear how these factors actually increase the reliability of the debonding strains.
It is important to note that the approach outlined in ACI 440.2R-08 [7], and hence the domestic approaches, based entirely on ACI 440 [7, 22], did not take into account the geometrical factor related to the width of the bonded plate and the width of the concrete member, which can reduce the accuracy of calculation.
The design value of compressive strength of concrete Rb is the ratio of the characteristic value of compressive strength of concrete Rb,n and the partial factor for concrete γc = 1.3.
where α is the empirical coefficient; kb is the geometrical factor related to the width of the bonded plate and the width of the concrete member; R is the some concrete strength; C1 is the value of the degree of strength of concrete; n is the number of plies of FRP reinforcement; Ef is the tensile modulus of elasticity of FRP; tf is the nominal thickness of one ply of FRP reinforcement; C2 is the value of the degree of longitudinal stiffness of the composite. The study is required to determine the values of α, C1, and C2 and decide in what forms to enter in a formula the strength of concrete is.
3. Experimental Database
- (1)
beams failed due to concrete cover separation or plate-end interfacial debonding;
- (2)
no debonding strains were provided;
- (3)
it is not clear which strength of concrete is specified: cylinder or cube;
- (4)
beams are with anchorage details along span.
Out of a total of 22 experimental studies, only 14 had some specimens satisfying the previous requirements, resulting in a total of 83 beams or slabs included in the database. The selected members represent a wide cross section of shapes and sizes, with widths varying from the lower limit of 100 mm up to 400 mm. The reinforcement ratio varies from 0.33% to 1.71%. The spans range from 1500 to 6000 mm. The database includes three different FRP materials: CFRP, aramid FRP (AFRP), and glass FRP (GFRP), which were installed using both the wet lay-up method and externally bonding a pre-cured laminate using structural adhesive. Figure 1 shows the regression lines, which are reflecting the relationship between experimental values of the debonding strains and corresponding values obtained by calculation. Note that in some cases, debonding strains calculation involves first payment rupture strain. In the calculation of the rupture strain, the partial factors CE, γE,f, and γε,f were not considered, since the comparison was performed with the results of short-term tests; that is, the environmental impact was negligible.
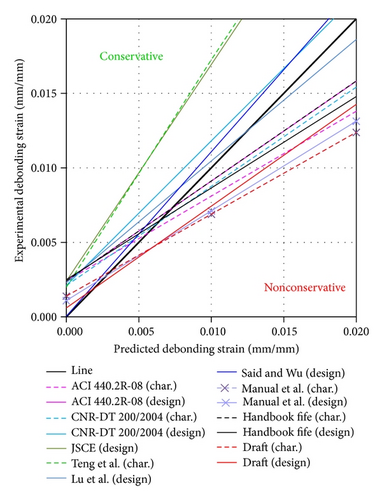
The ordinates are the experimental values of the debonding strains (marked εfd,ex.), and the abscissae are the predicted (theoretical) values of design and characteristic values of the debonding strains (marked εfd,th.). The plotting area is divided into two areas: the area of conservative results, εfd,ex. > εfd,th., and the area of unconservative results, εfd,ex. < εfd,th.. The line (bold) corresponds to the equality εfd,ex. = εfd,th.. The data in Figure 1 allow you to visually assess the reliability of different methods.
In order to use the normal distribution to predict the behavior of the model, the Kolmogorov-Smirnov and Lilliefors tests and Shapiro-Wilk’s W test were used to determine the goodness of fit. A percentage of exceedance value was also found for each analytical model. This represents the probability that the analytical model will overestimate the IC debonding failure, judged from the sample of experimental beams. The results of statistical analysis are shown in Tables 2 and 3. In Figures 2 and 3 the normal distributions for x1 and x2 are shown.
| Kolmogorov-Smirnov and Lilliefors tests | Shapiro-Wilk’s W test | Mean, theor/exp |
Standard deviation |
Probability of exceedance | Reference |
|---|---|---|---|---|---|
| K-S d = 0.0878, P > 0.20; Lilliefors P < 0.15 |
|
1.171 | 0.324 | 70% | [7] |
| K-S d = 0.069, P > 0.20; Lilliefors P > 0.20 |
|
1.126 | 0.287 | 67% | [8] |
| — | — | — | — | — | [11] |
| K-S d = 0.093, P > 0.20; Lilliefors P > 0.20 |
|
0.467 | 0.061 | 0% | [12] |
| — | — | — | — | — | [13] |
| — | — | — | — | — | [14] |
| K-S d = 0.075, P > 0.20; Lilliefors P > 0.20 |
|
1.494 | 0.380 | 90% | [16–19] |
| K-S d = 0.096, P > 0.20; Lilliefors P < 0.10 |
|
1.362 | 0.375 | 83% | [20] |
| K-S d = 0.083, P > 0.20; Lilliefors P < 0.20 |
|
1.082 | 0.314 | 60% | [21] |
| K-S d = 0.082, P > 0.20; Lilliefors P > 0.20 |
|
1.479 | 0.358 | 91% | [15] |
Kolmogorov-Smirnov and Lilliefors tests |
Shapiro-Wilk’s W test |
Mean, theor/exp |
Standard deviation |
Probability of exceedance |
Reference |
|---|---|---|---|---|---|
| K-S d = 0.086, P > 0.20; Lilliefors P < 0.20 |
|
0.989 | 0.278 | 48% | [7] |
| K-Sd = 0.069, P > 0.20; Lilliefors P > 0.20 |
|
0.766 | 0.196 | 11% | [8] |
| K-S d = 0.083, P > 0.20; Lilliefors P > 0.20 |
|
0.437 | 0.085 | 0% | [11] |
| — | — | — | — | — | [12] |
| K-S d = 0.069, P > 0.20; Lilliefors P > 0.20 |
|
0.910 | 0.232 | 35% | [13] |
| K-S d = 0.075, P > 0.20; Lilliefors P > 0.20 |
|
0.899 | 0.170 | 27% | [14] |
| K-S d = 0.067, P > 0.20; Lilliefors P > 0.20 |
|
1.445 | 0.357 | 89% | [16–19] |
| K-S d = 0.074, P > 0.20; Lilliefors P > 0.20 |
|
1.232 | 0.314 | 77% | [20] |
| K-S d = 0.107, P > 0.20; Lilliefors P > 0.15 |
|
1.161 | 0.339 | 68% | [21] |
| K-S d = 0.081, P > 0.20; Lilliefors P > 0.20 |
|
1.381 | 0.321 | 88% | [15] |
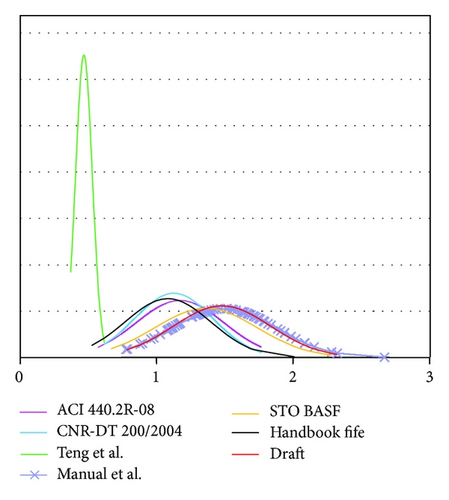
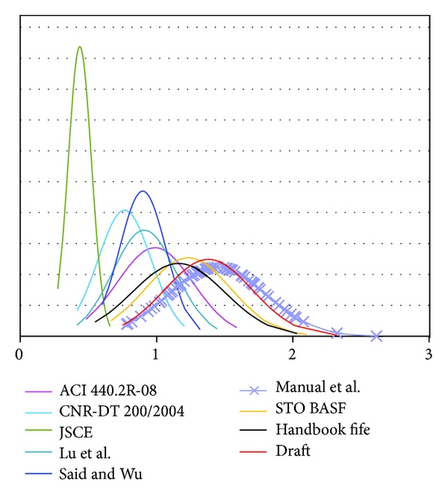
Analysis of Tables 2 and 3 and Figures 2 and 3 shows that all the Russians guideline give nonconservative results. A percentage of exceedance values vary from 68% to 89%. Among the foreign methods, Teng’s method was found to be the most reliable and the simplest. Note, however, that this method gives a too conservative results but does not provide a formula for estimating the design value of the debonding strains. We explain that too conservative debonding strains affect the efficiency of constructive solutions to strengthening. In other words, the debonding strains reducing leads to the necessity of increasing the area (width) of the FRP. Thus, we need to develop a formula for calculating the results which would have the greater efficiency and reliability required.
4. Proposed Analytical Formula
where Rb is design value of compressive strength of concrete in compliance with Russian standard.
Statistical analysis of data was performed to assess the reliability of the proposed method. The results of statistical analysis are shown in Table 4. In Figures 4 and 5 the normal distributions for x1 and x2 are shown.
| Reference | Kolmogorov-Smirnov and Lilliefors tests |
Shapiro-Wilk’s W test |
Mean, theor/exp |
Standard deviation |
Probability of exceedance |
|---|---|---|---|---|---|
| x1 |
|
|
0.732 | 0.145 | <5% |
| x2 |
|
|
0.687 | 0.136 | 1% |
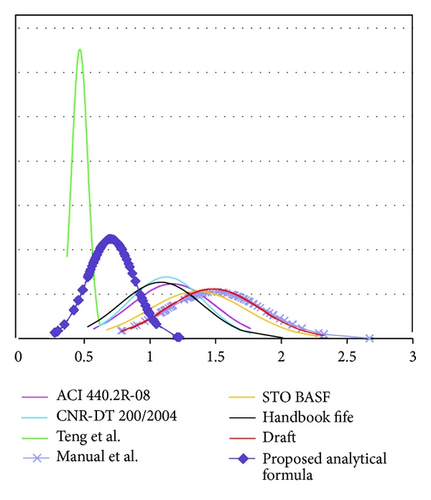
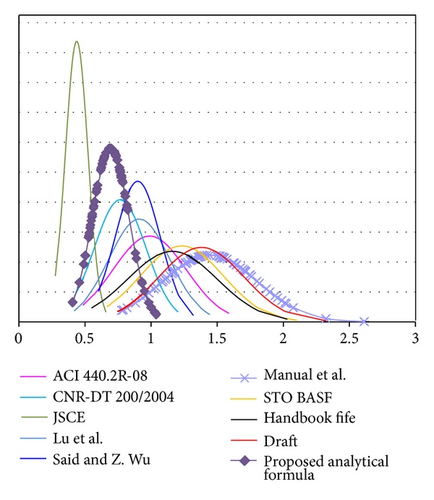
As can be seen from Table 4, the probability that the analytical model will overestimate the IC debonding failure is 5%. In other words, the probability of the characteristic value of the debonding strains calculated by the proposed model is 0.95. Similarly, it is shown that the probability of the design value of the debonding strains calculated by the proposed model is 0.99. So, these probabilities correspond to the Russian codes.
5. Conclusions
The authors carried out a review of existing methods for calculating the debonding strains of the FRP. Overview of domestic methods showed that they are built on the American approaches [7, 22] and thus have the same disadvantages as the American methods. The analysis of foreign experience makes it possible to determine the general form of the function for the debonding strains and set the desired values.
To verify and assess the reliability of the considered methods, the authors performed a comparison of the experimental and calculated data. Experimental data were collected from the published literature. These data were assembled into the experimental database, which included the 87 results. The assessment of the reliability of methods as the most simple and reliable method was adopted Teng’s method.
Based on Teng’s method, the authors proposed a simple analytical formula for calculating the debonding strains, meeting the requirements of reliability and efficiency, and taking into account the traditional Russian values and notations for concrete strength and lacking of the shortcomings of the original Teng’s method. Reliability analysis of the proposed model has shown that it meets the Russian codes requirements of reliability and efficiency and can be used in the design.


