Presentation of Malaria Epidemics Using Multiple Optimal Controls
Abstract
An existing model is extended to assess the impact of some antimalaria control measures, by re-formulating the model as an optimal control problem. This paper investigates the fundamental role of three type of controls, personal protection, treatment, and mosquito reduction strategies in controlling the malaria. We work in the nonlinear optimal control framework. The existence and the uniqueness results of the solution are discussed. A characterization of the optimal control via adjoint variables is established. The optimality system is solved numerically by a competitive Gauss-Seidel-like implicit difference method. Finally, numerical simulations of the optimal control problem, using a set of reasonable parameter values, are carried out to investigate the effectiveness of the proposed control measures.
1. Introduction
Malaria is a tropical infectious disease, transmitted from infected person to susceptible one through Anopheles female mosquito each time the infected mosquito takes a blood meal, and it is prevalent mainly in Africa and some parts of Asia [1]. Clinical symptoms such as fever, pain, chills, and sweats may develop a few days after an infected mosquito bite. Malaria is the cause of the death of over 1 million people each year and many more are infected with the disease. Scientists of several countries are trying to create an effective vaccine to prevent malaria, but it has been difficult. Yet it still poses a major problem throughout much of the world. One of the most important public health programs in many countries is the program to control or to eliminate malaria. This is because malaria is regarded as a very dangerous disease that may lead to death [2].
In the absence of an effective vaccine [3], current control programs for malaria have focused on personal protection and mosquito reduction strategies (such as larviciding, adulticiding and elimination of mosquito breeding sites). A way to prevent the malaria epidemic is to control the growth of mosquito population. Intensive use of insecticides has been one of the major efforts in many years. Most of the mosquitoes use favorable climatic conditions to flourish [4]. Thus, combating efforts of malaria are more effective and economical if it is in phase with climatic changes. Consequently, we consider an optimal control model with three time-dependent controls, prevention u1, treatment u2 and mosquito reduction u3, respectively.
The use of mathematical modeling is increasing influence the theory and practice of disease transmission and control. The mathematical modeling can help in figuring out decisions that are of significant importance on the outcomes and provide complete examinations that enter into decisions in a way that human reasoning and debate cannot. Several health reports and studies in the literature address that malaria is increasing in severity, causing significant public health and socioeconomic burden [5, 6]. Malaria remains the world’s most prevalent vector-borne disease. Despite decades of global eradication and control efforts, the disease is reemerging in areas where control efforts were once effective and emerging in areas thought free of the disease. The global spread necessitates a concerted global effort to combat the spread of malaria. The present study illustrates the use of mathematical modeling and analysis to gain insight into the transmission dynamics of malaria in a population, with main objective on determining optimal control measures. In order to manage the disease, one needs to understand the dynamics of the spread of the disease. Some health scientists have tried to obtain some insight in the transmission and elimination of malaria using mathematical modeling [7].
Recently, some theoretical studies and mathematical models have used control theory [8]. The optimal control efforts are carried out to limit the spread of the disease, and in some cases, to prevent the emergence of drug resistance. The authors in [9] studied a model to assess the impact of some anti-WNV control measures, by reformulating the model as an optimal control problem with density-dependent demographic parameters. They have used two control functions, one for mosquito-reduction strategies and the other for personal (human) protection. In [10], time-dependent prevention and treatment efforts are investigated, where optimal control theory is applied. Using analytical and numerical techniques, they have shown that there are cost-effective control efforts for treatment of hosts and prevention of host-vector contacts. Three types of control functions, one for vector-reduction strategies and the other two for personal (human) protection and blood screening, respectively, are considered in [11]. They have investigated that there are cost-effective control efforts for prevention of direct and indirect transmission of vector-borne disease. In this paper, we use three control functions one for mosquito-reduction strategies and other two for prevention and treatment efforts, respectively. The goal of this paper is to use optimal control theory to evaluate the effectiveness of the control functions. We want to minimize the exposed, infected human and susceptible, exposed, infected mosquito populations with minimum implementation cost.
The paper is organized as follows. Section 2 describes a mathematical model of malaria with three control terms. The analysis of optimization problem is presented in Section 3. The numerical implementation and the strategy used to solve the problem is given in Section 4. Finally, the conclusions are summarized in Section 5.
2. Malaria Model with Controls
The model presented in this section will be a continuation of ideas from recent vector-host models [9–11]. We will begin with the presentation of the optimal control problem for the transmission dynamics of malaria in order to derive optimal prevention, treatment and mosquito reduction strategies with minimal implementation cost. Our aim is to show that it is possible to implement time-dependent anti-malaria control techniques while minimizing the cost of implementation of such measures. In this paper, we introduce three control functions, u1, u2 and u3. The control functions u1, u2 represent time-dependent successful efforts of prevention and treatment, respectively. The well-known practices of prevention efforts include, surveillance, use of mosquito nets, treating mosquito-breading ground and reducing contacts between human and mosquitoes. On the other hand, treatment efforts are carried out by screening patients, administering drug intake. The control function u3(t) represents the level of larvacide and adulticide used for mosquito control administered at mosquito breeding sites.
We consider a compartmental model that divide the human and mosquito populations into different classes. For humans, the four compartments represent the total population of humans at a given time t. Let Sh denotes the number of members of a population susceptible to the disease, Ih is the number of infective members of a population, Eh is the number of exposed members of a population and Rh is the number of members who have been removed from the possibility of infection. For mosquitoes the three compartments represent susceptible mosquitoes Sv, exposed mosquitoes Ev and infectious mosquitoes Iv populations at a given time t. The immune class in the mosquito population does not exist, since the mosquito once infected never recover.
For the human population: Λh is the human input rate of new individuals entering the population (assumed susceptible). μh and δh are the natural and disease induced death rates respectively. αh is the progression rate of the exposed class to infectious class. r is treatment rate, r0 and c0 are rate constants. bβh is the inoculation rate, where βh is the probability that a bite by an infectious mosquito results in transmission of the disease to the susceptible human and b is the contact rate between the two. In the model, the term bβhShIv denotes the rate at which the human hosts Sh get infected by infected mosquitoes Iv.
3. Mathematical Analysis of the Model
3.1. Positivity and Boundedness of Solutions
Since the model (2.1) represent human and vector population, it is important to prove that all solutions with nonnegative initial data will remain nonnegative for all time.
Theorem 3.1. If Sh(0), Eh(0), Ih(0), Rh(0), Sv(0), Ev(0), Iv(0) are nonnegative, then Sh(t), Eh(t), Ih(t), Rh(t), Sv(t), Ev(t), Iv(t) remain nonnegative for all t > 0.
Proof. To see this, let
Thus, Sh(t*) being the sum of positive terms is positive. By the same argument, it can be proved that the quantities Eh, Ih, Rh, Sv, Ev, and Iv are positive for all times t > 0. This completes the proof.
The objective functional ℱ formulates the optimization problem of interest, namely, that of identifying the most effective strategies. The overall preselected objective involves the minimization of the number of exposed, infected human and minimizing the susceptible, exposed and infective mosquitoes at a minimal cost over a finite time interval [0, T].
3.2. Existence of an Optimal Control
Theorem 3.2. Given the objective functional ℱ(u1, u2, u3) = +A2Ih+A3Nv++ + , where the control set U given by (3.8) is measurable subject to system (2.1) with initial conditions given at t = 0, then there exists an optimal control such that .
Proof. The integrand of the objective functional ℱ given by (3.6) is a convex function of (u1, u2, u3) and the state system satisfies the Lipschitz property with respect to the state variables since state solutions are bounded. The existence of an optimal control follows [12].
In order to find an optimal solution, first we should find the Lagrangian and Hamiltonian for the optimal control problem (2.1)–(3.6). The Lagrangian of the control problem is given by
In order to derive the necessary conditions, we use Pontryagin’s maximum principle [13] as follows.
If (x, u) is an optimal solution of an optimal control problem, then there exists a non trivial vector function λ = (λ1, λ2, …, λn) satisfying the following conditions.
We now derive the necessary conditions that optimal control functions and corresponding states must satisfy. In the following theorem, we present the adjoint system and control characterization.
Theorem 3.3. Given an optimal control and a solution of the corresponding state system (2.1), there exists adjoint variables λi, i = 1, …, 7 satisfying
Proof. To determine the adjoint equations and the transversality conditions we use the Hamiltonian (3.10). The adjoint system results from Pontryagin’s Maximum Principle [13].
To get the characterization of the optimal control given by (3.14), solving the equations,
4. Numerical Results and Discussion
The numerical algorithm presented below is a semi-implicit finite difference method.
We discretize the interval [t0, tf] at the points ti = t0 + il (i = 0,1, …, n), where l is the time step such that tn = tf. Next, we define the state and adjoint variables Sh(t), Eh(t), Ih(t), Rh(t), Sv(t), Ev(t), Iv(t), λ1(t), λ2(t), λ3(t), λ4(t), λ5(t), λ6(t), λ7(t) and the controls u1(t), u2(t), u3(t) in terms of nodal points , , , , , , , , , , , , , , , and . Now a combination of forward and backward difference approximation is used as follows.
Algorithm 4.1.
Step 1. Consider Sh(0) = Sh0, Eh(0) = Eh0, Ih(0) = Ih0, Rh(0) = Rh0, Sv(0) = Sv0, Ev(0) = Ev0, Iv(0) = Iv0 , λi(tf) = 0 (i = 1,…, 5), and u1(0) = u2(0) = u3(0) = 0.
Step 2. For i = 1, …, n − 1, do
Step 3. For i = 1,…, n − 1, write , , , , , , , , , .
end for.
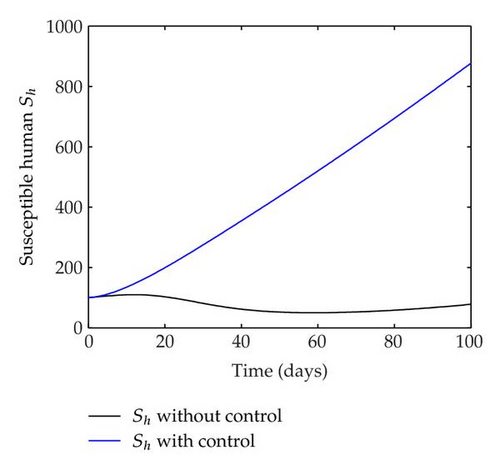
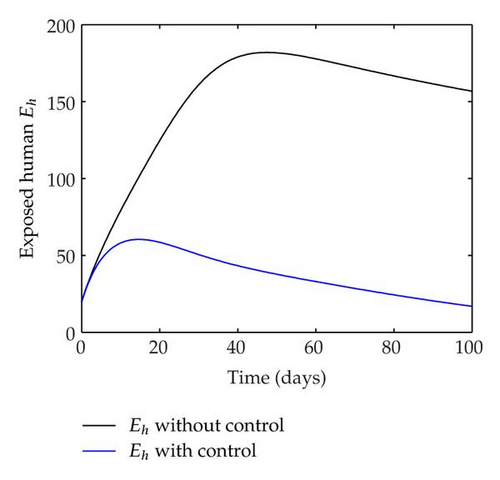
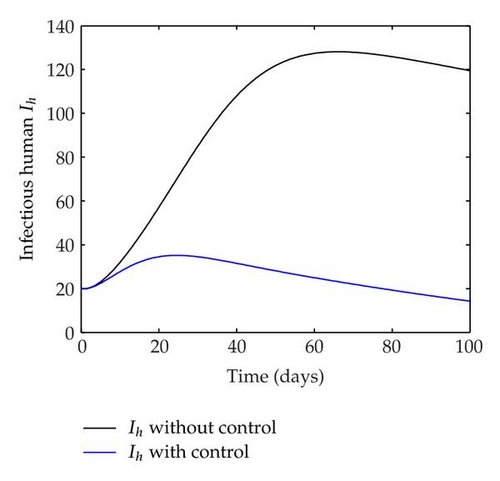
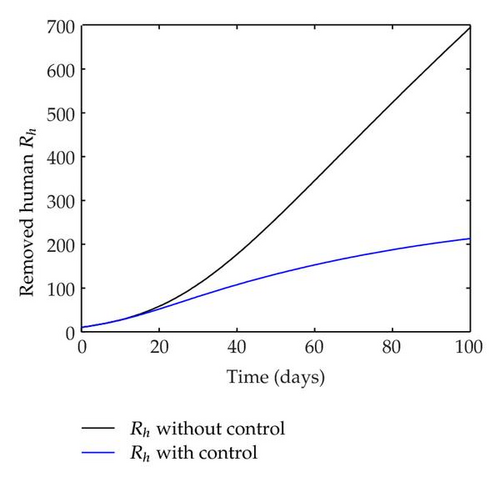
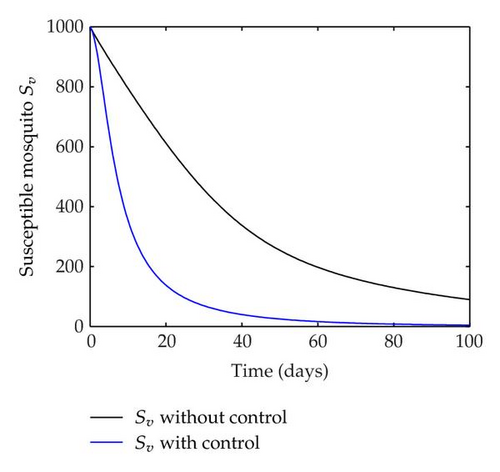
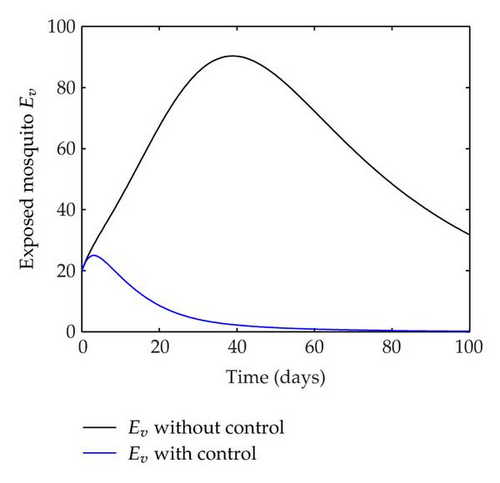
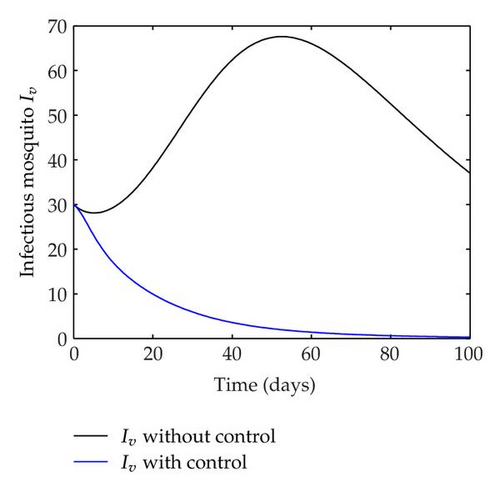
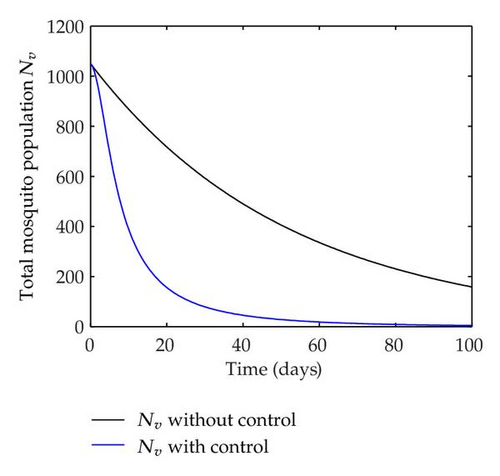
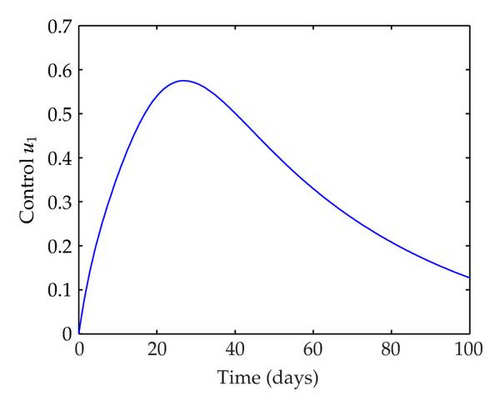
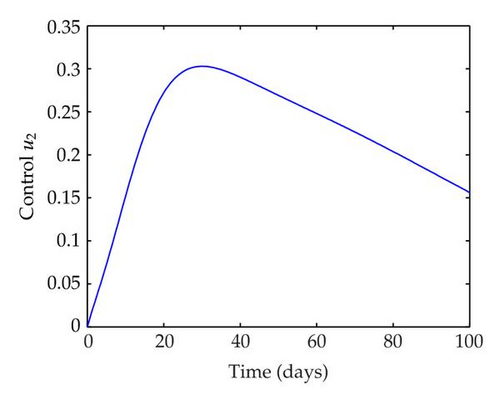
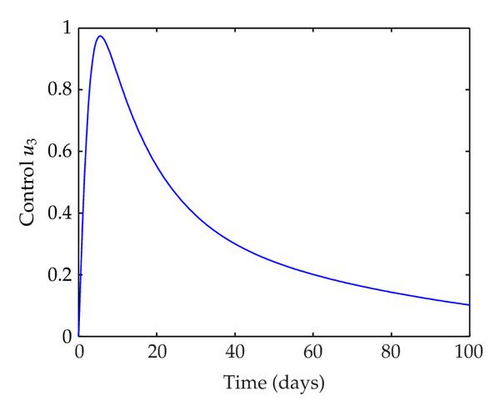
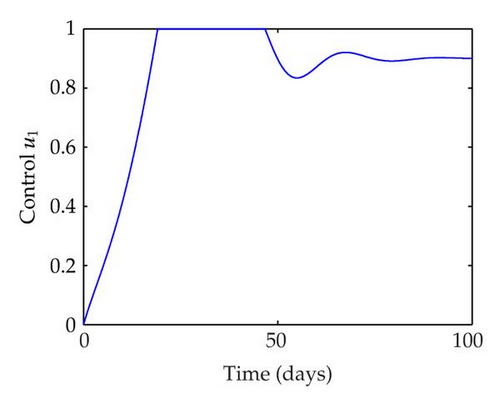
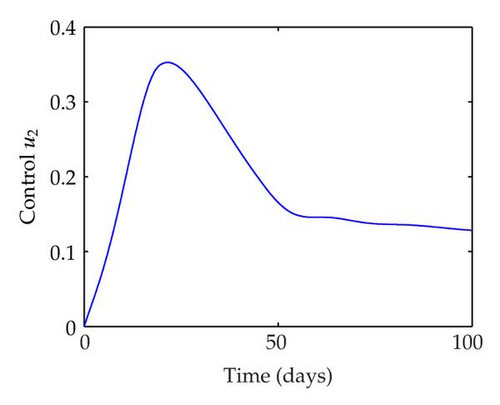
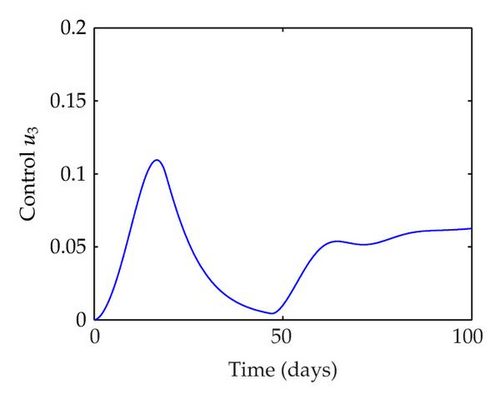
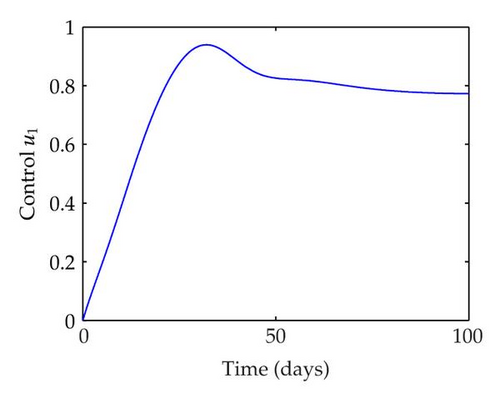
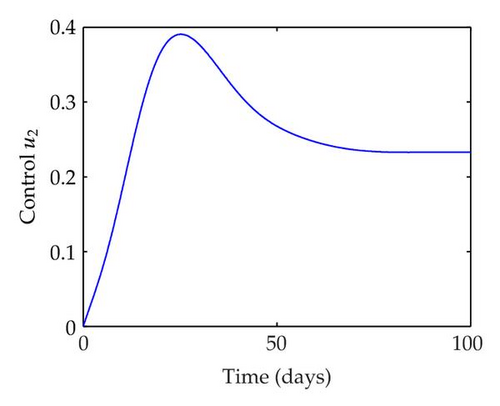
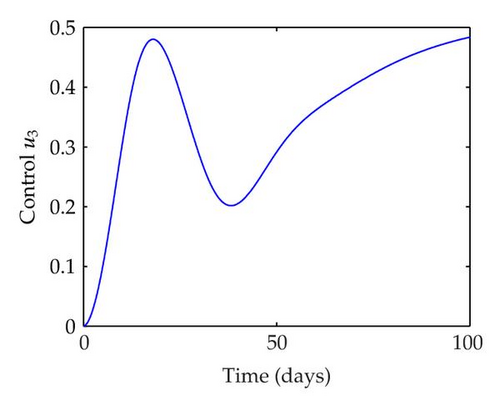
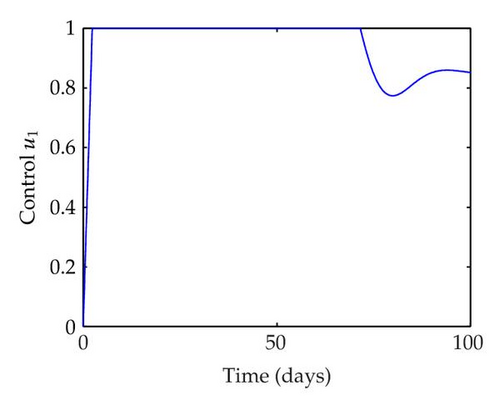
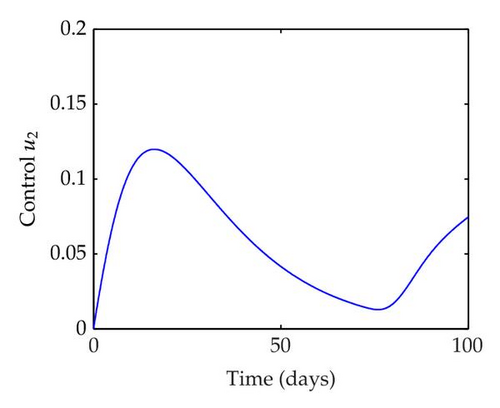
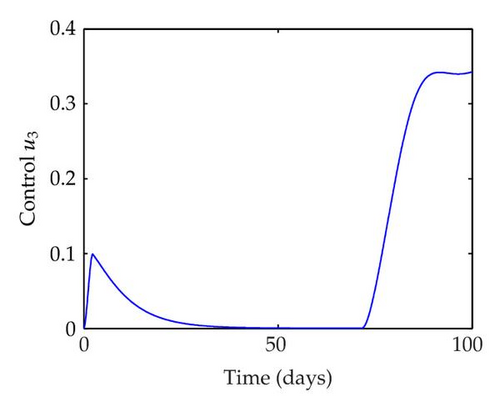
We have plotted susceptible, infected, exposed and recovered human population with and without control by considering parameter values as given in Table 1, with initialization Sh(0) = 100, Eh(0) = 20, Ih(0) = 20, Rh(0) = 10. The control individuals are marked by solid blue line while the individual without control are marked by black line. Similarly, we have plotted susceptible, infected, exposed and total number of mosquito population with and without control by considering parameter values as given in Table 1, with initial conditions Sv(0) = 1000, Ev(0) = 20, Iv(0) = 30. The control individuals are marked by solid blue line while the individual without control are marked by black line. The weight constant values in the objective functional are A1 = 1, A2 = 1, A3 = 1, B1 = 150, B2 = 50 and B3 = 300. Figure 1, represents the population of susceptible, exposed, infected and recovered humans with and without control. The solid black line denotes the population of individuals in system (2.1) without control while the blue line denotes the population of exposed individuals in system (2.1) with control. We see that the population of the exposed, infected human with control is more sharply decreased after 12 or 13 days than the individuals without control. Figure 2 represents the population of susceptible, exposed, infected and the total number of mosquito population in the system (2.1) with and without control. The population of susceptible, exposed and infected mosquito with control is more sharply decreased than without control and becomes very small. In Figure 2, we see that if there are no control susceptible, exposed and infected mosquito without control constantly increases, but if there is control the population of susceptible, exposed and infected mosquito begins to decrease from the very beginning day of the control measure. Figures 3, 4, 5, 6 represent the optimal controls u1, u2 and u3, the balancing constants A1, A2, A3, B1, B2 and B3 are given in each of the figure captions and parameters are given in Table 1. Parameter values used in the numerical simulations are estimated based on malaria disease as given in Table 1 and are taken from [10]. The constant c0 is arbitrarily chosen with c0 = 0.06. For illustration purposes, we consider the parameter values in Table 1 for numerical simulation.
| Parameters | Descriptions | Values |
|---|---|---|
| Λh | Recruitment rate of humans | 10 |
| αh | Transfer rate from Eh to Ih class | 1/17 |
| αv | Transfer rate from Ev to Iv class | 1/18 |
| ΛvNv | Recruitment rate of mosquitoes | 50 |
| μh | Death rate for humans | 1/60 × 365 |
| μv | Death rate for mosquitoes | 1/15 |
| δh | Disease-induced death rate for humans | 0.01 |
| b | Biting rate of infectious mosquitoes | 3 |
| βh | Transmission probability from mosquitoes to humans | 0.001 |
| βv | Transmission probability from humans to mosquitoes | 0.0001 |
| r | Recovery rate for humans | 0.07 |
| r0 | Rate constant | 0.04 |
5. Conclusion
A comprehensive, continuous model for the transmission dynamics of malaria has been presented. We sought to determine optimal control strategies that would minimize not only the exposed, infected human, and susceptible, exposed, infected mosquito but also the cost of implementation of the control as well. Our model incorporates three control measures. We analyzed the optimal control using the functional ℱ in terms of quadratic forms. Minimizing the cost we obtained the optimal controls u1, u2 and u3 where ℱ was minimized. The model is analyzed for the existence of control. The proposed optimal control shows the result of optimally controlling the disease using three controls, personal protection, treatment and mosquito reduction strategies, respectively. We have developed the necessary conditions for the optimal control using the Pontryagin’s Maximum Principle. Using the state and adjoint system together with the characterization of the optimal control, we solved the problem numerically via an efficient numerical method based on optimal control with parameter values estimated based on malaria. A comparison between optimal control and without control dynamics is presented. It is easy to see that the optimal control has a very desirable effect upon the population for reducing the number of infected individuals. In order to illustrate the overall picture of the disease, the numbers of susceptible, exposed, infected, recovered human population and susceptible, exposed, infected mosquito population under the optimal control and without control are shown in figures.
Acknowledgments
This research was partially supported by the Deanship of Scientific Research, King Khalid University, Saudi Arabia (KKU-SCI-11-025) and the work of Prof. Il Hyo Jung was supported by the Cooperative Research Program for Agriculture Science and Technology Development (Project No. PJ007420) Rural Development Administration, Republic of Korea. A. A. Lashari acknowledges the support from the National University of Sciences and Technology Islamabad, Pakistan.


