Internal Demagnetizing Factor in Ferrous Metals
Abstract
Modelling the saturation major loop of a ferrous metal produces the intrinsic magnetization parameters; fitting the measured commutation curve, however, can yield different results. The relation of the intrinsic loci of the vertices of the minor loops (ND = 0) to the experimental curve (ND ≠ 0) is investigated. The two-way transformation between the two curves is formulated in closed mathematical form with the help of the internal demagnetization factor, ND. The method is applied to four ferrous metals, with widely different intrinsic properties (soft nonoriented Fe-Si steel, normalized low carbon steel, and Finemet in nanocrystalline and amorphous state) supporting the predictions of the proposal. The developed relationship is model independent and it is shown that the ND factor depends linearly on coercivity based on experimental evidence.
1. Introduction
A large number of the measurements of ferrous substances are aimed at finding the intrinsic material properties [1] of the tested ferrous sample (as defined by Fiorillo). Due to the ever-presence of demagnetization field, various measuring methods have been developed to minimize its effect. The most commonly accepted way is to make the sample turn into a closed magnetic circuit, such as a toroid or an Epstein square [1–3]. Although these two methods are not completely free from the ever-present internal demagnetization, they suffer the least from it [1]. Researchers went into great length to include the internal demagnetization force into current models like Preisach, Jiles, Stoner-Wohlfarth [2, 4, 5], and so forth, leading to complicated, so called, dynamic versions.
The saturated major hysteresis loop of the sample carries all the intrinsic magnetic parameters directly recoverable from the measured data. Within this loop lie the un-hysteretic loci of the vertices of the symmetrical minor loops, the only curve, which belongs to both the ascending and descending branches of the hysteresis loops [5, 6].
A proposal is put forward in this paper to show the relationship between the intrinsic curve and the loci of vertices of the measured minor loops. This relationship between the two curves, independent of models, is formulated in closed mathematical form and its prediction is verified by the experimental data obtained from four different ferrous samples.
Once the intrinsic locus (M01 for Nd = 0) is modelled from saturation or minor loop data, by using any of the static models, the measured curve (Nd ≠ 0) can be calculated from the proposed formulation below with optimization of the Nd parameter value as specified by Jiles [2] and used by Fiorillo [1].
2. The Intrinsic Loci of Vertices
The intrinsic commutation curve (ND = 0) is the locus of the return points or the maxima of the set of symmetrical minor loops. It is a single-valued function and in spite of having no hysteresis, it carries all the hysteretic properties of the ferrous material obtained from the saturation data [7].
3. The Effective Field and Its Implications
For simplicity we will use normalised quantities in further calculations, where the lower case letters will represent the normalised quantities of the physical equivalents, denoted by the same capital letters.
The first derivative of m0 by h in (3) leads to an expression, which shows a character similar to the feedback in an electrical circuit [14].
This expression describes a well-known relationship between the inherent (μi) and the effective (μeff) permeabilities [1, 2].
The intrinsic locus is entirely a theoretical concept. It was introduced for the free (Gibbs) energy calculations [2]. It assumes zero internal demagnetization in a system, where a m moment can freely move around under the influence of H external excitation field without any hindrance from the interaction between the magnetic moments.
We must remind the reader that, for various ferromagnetic substances, this internal demagnetization constant ND is given traditionally in a numerical value with unity dimension (i.e., when both the H and B measured in A/m). When different unitary system is used, ND has a different physical dimension and must be normalised (see nD as normalised ND).
4. Experimental Verification
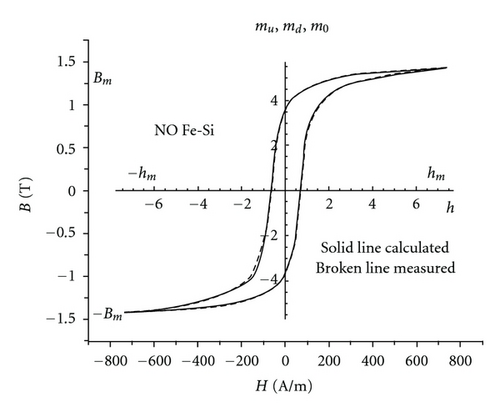
To verify the predictions of the proposed method, it was applied initially to two ferrous materials with very different characters. The first was a soft steel NO Fe-Si with 67.5 A/m coercivity [15], shown in Figure 1. The second material was a normalized low carbon steel (AISI 1040) with coercivity of 450 A/m (see Figure 5). Following the excellent results, the same experiment was also repeated later on two other samples; Finemet in nanocrystalline and amorphous (as cast) state. The detailed data of those samples are not included in this paper due to its limited size. All measurements were carried out under identical conditions by using triangular excitation of f = 0.001 Hz on toroid samples with geometrical details as follows: De = 25 mm, Dint = 15 mm and thickness d = 0.5 mm [1]. In making the identical toroid samples, extreme care was taken to avoid any changes in magnetic properties due to mechanical handling of the materials.
For numerical calculations we used the hyperbolic model for its simplicity and speed and the Mathematica program interactively. A brief summary of the model is given in the appendix. For further details we refer the reader to the literature [6, 16, 17].
4.1. NO Fe-Si
Starting with conveniently chosen parameter values at the beginning with subsequent changes of the parameters, new curves are calculated and compared with the measured one.
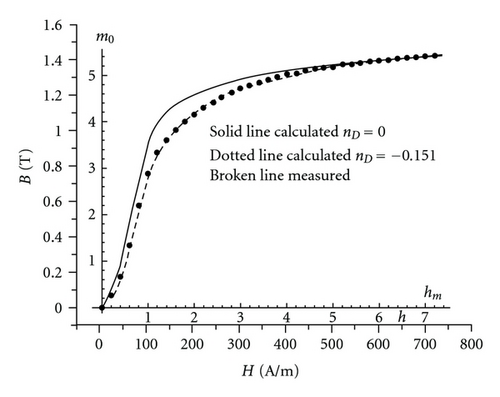
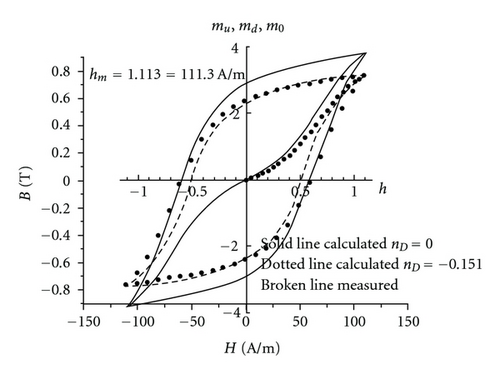
When the iteration produced the best fit to the measured curve, the normalized and the equivalent physical values can be easily read from the two coordinate systems (normalization) as shown in Figures 1, 2, and 3.
-
a1 = 3.18, a2 = 1.45, a3 = 1.09,
-
α1 = 2.75, α2 = 0.56, α3 = 0.134,
-
hc1 = 0.675, h2c = 0.57, hc3 = 2.2,
-
hm = 7.35 equivalent to:
-
A1 = 0.842 T, A2 = 0.384 T, A3 = 0.288 T.
-
Hc1 = 67.5 A/m, Hc2 = 57 A/m, Hc3 = 220 A/m, Hm = 735 A/m.
-
with normalization of 1 h = H 100 A/m and 1 m = M 0.2647 T.
The measured and the modelled m0 curves for nD = −0.151 (ND = −57 A/Tm, or −7.10−5). nD = 0 are depicted in Figure 2. For the symbols see the appendix.
In order to check the accuracy of the transformation, between the two curves, 25 of the minor loops were measured with maximum field excitation values between hm = 5.01, Hm = 501 A/m and hm = 0.152, Hm = 15.2 A/m. For all the minor loops measured, the corresponding loops were calculated for the reduced maximum magnetization at nD = 0 and nD= −0.151.
For clarity, only one of the minor loops is shown in Figure 3 for the peek excitation field value of 111.3 A/m.
All the calculated loops had an excellent fit to the equivalent measured loops for the same ND value. The proposed method is applicable to all measured hysteretic data, where the external demagnetization field is eliminated or reduced to a negligible level.
4.2. Low Carbon Steel Toroid (AISI 1040)
-
a1 = 2.68, a2 = 2.08, a3 = 1.6,
-
α1 = 3.52, α2 = 0.47, α3 = 0.09,
-
hc1 = 0.45, hc2 = 0.44, hc3 = 0.9 and hm = 7.35,
-
equivalent to:
-
A1 = 0.64 T, A2 = 0.5 T, A3 = 0.38 T,
-
Hc1 = 450 A/m, Hc2 = 440 A/m, Hc3 = 900 A/m, and Hm = 7350 A/m,
-
with normalization of 1 h = H 1000 A/m and 1 m = M 0.24 T.
The measured and the modelled hysteresis loops are depicted in Figure 4 with the intrinsic and the measured commutation curves. The curves are shown in the first quadrant only for better visual resolution.
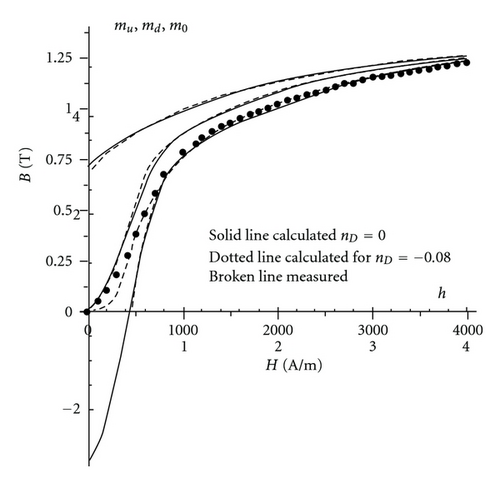
Following the calculation of the intrinsic parameters, the measured commutation curve was modelled with nD = −0.08 (ND = −333.3 A/Tm or −4.1.10−4), which yielded the best result, giving an excellent fit to the measured curve.
5. Nd as a Function of Coercivity
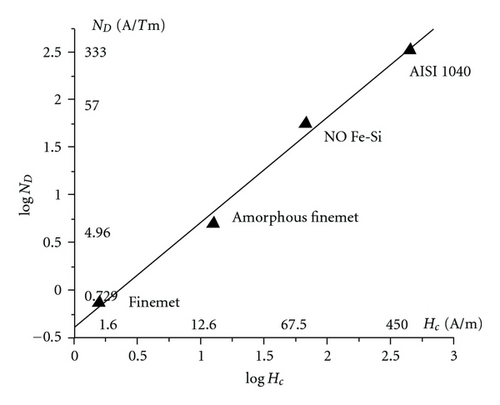
The experimental results have indicated that ND is greatly dependent on the coercivity of the sample. To verify this dependency, four samples, listed under Section 4, were tested for this purpose, with coercivity Hc ranging between 1.6 A/m and 450 A/m. Figure 5 depicts the relationship between ND and Hc.
-
Finemet: Hc = 1.6 A/m, ND = −0.729 A/Tm or −0.9·10−6,
-
Finemet in amorphous state: Hc = 12.6 A/m, ND = −4.96 A/Tm or −6.2·10−6,
-
NO Fe-Si: Hc = 67.5 A/m, ND = −57 A/Tm or −7·10−5,
-
Low carbon steel (AISI 1040): Hc = 450 A/m, ND = −333 A/Tm or −4·16. 10−4.
6. Conclusions
The relation between the intrinsic (ND = 0) and the measured (ND ≠ 0) loci of the vertices of the minor loops was investigated. By using the effective field, this relationship was formulated. The method was subjected to tests on four magnetic materials with widely ranging magnetic properties. The test results show that the mathematical approach, presented here, describes the relation well. The ND factor linear dependence on coercivity, based on empirical evidence, was also demonstrated. The paper shows that magnetic parameters (Hc and Bm) ND can be estimated very close to the real value.
The proposal’s aim is to recover the intrinsic magnetization properties from the measured commutation curves.
Appendix
The parameters are calculated by changing the model parameters until the best fit to the measured curve is achieved. When the iteration gives the best fit, the normalized and the equivalent physical values can be read from the two coordinate systems (normalized and measured), as shown in Figures 1, 2, and 3.


