Combined Visibility and Surrounding Triangles Method for Simulation of Crack Discontinuities in Meshless Methods
Abstract
In this paper a combined node searching algorithm for simulation of crack discontinuities in meshless methods called combined visibility and surrounding triangles (CVT) is proposed. The element free Galerkin (EFG) method is employed for stress analysis of cracked bodies. The proposed node searching algorithm is based on the combination of surrounding triangles and visibility methods; the surrounding triangles method is used for support domains of nodes and quadrature points generated at the vicinity of crack faces and the visibility method is used for points located on the crack faces. In comparison with the conventional methods, such as the visibility, the transparency, and the diffraction method, this method is simpler with reasonable efficiency. To show the performance of this method, linear elastic fracture mechanics analyses are performed on number of standard test specimens and stress intensity factors are calculated. It is shown that the results are in good agreement with the exact solution and with those generated by the finite element method (FEM).
1. Introduction
Conventional finite element method (FEM) is usually used for solving fracture mechanics problems. This method has some drawbacks in calculation of fracture mechanics parameters. One of the major drawbacks is that singularity cannot be captured correctly and therefore the results at the vicinity of the crack tip are not reliable [1]. Another problem with FEM is simulation of crack growth. FEM requires remeshing to update the mesh in each step of the crack growth process and so this is a time consuming phenomena. Although there are some methods such as node release method [2–5] to overcome this drawback, but still some problems exist. The above drawbacks as well as other shortcomings that exist in FEM such as discontinuous results at the element faces, have caused the researchers to seak for other computational methods. Extended finite element method (XFEM) and meshfree method are two different approaches that can be a good alternative for FEM in solving fracture mechanics problems. In recent years many articles have been published in this field. In [6] combination of FEM and meshfree method is used for determination of crack tip fields. Partition of unity methods is employed for three dimensional modeling of crack growth [7]. In [8] generalized Gaussian quadrature rules are used for discontinuities in XFEM. Simulation of fatigue crack growth using XFEM is another article in this field [9]. A variational approach for evaluation of stress intensity factors using the element free Galerkin method is used in [10].
Among the above-mentioned methods, meshless methods in recent years have developed rapidly as a computational technique. This method has some advantages over traditional methods such as FEM and the boundary element method (BEM). In meshless methods, the resulting derivatives of meshfree interpolations are smooth leading in general to very desirable properties, like smooth stresses, but in FEM the results at the element faces have discontinuity and some extra efforts have to be done for smoothing the strains and stresses [1]. Simulation of crack propagation and large deformation analysis are typical areas that meshless methods have better performance than FEM [1]. Besides these advantages of meshless methods, there are some disadvantages for meshless methods. Complex shape functions, difficulties in implementation of essential boundary conditions, and extra effort for simulation of crack discontinuities are the major disadvantages in meshless methods [1]. In stress analysis of cracks, the major disadvantage is simulation of crack discontinuity.
Different techniques are used for simulation of discontinuities in meshless methods. There are four approaches which can be implemented to model discontinuities in meshless methods [12]. First method consists of modification of the weight function such as the visibility method, the diffraction method, and the transparency method [13–16]. Second approach is based on modification of the intrinsic basis [17] to consider special functions. Third approach includes the methods based on an extrinsic MLS enrichment [17]. The last approach is the methods based on the extrinsic PUM enrichment [18–20]. Morever, augmented lagrangian method is used to model crack problems and material discontinuity [21, 22]. All of these approaches employ relative complicated algorithms. Most popular methods for simulation of crack discontinuity in meshless methods are the visibility method, the transparency method and the diffraction method [11].
In this paper a node searching algorithm for simulation of crack discontinuities in meshless methods is proposed. This approach follows a simple and effective trend to capture better construction of support domain at the vicinity of crack faces. Using this method, support domains of nodes and quadrature points generated at the vicinity of crack faces, are based on the surrounding triangles method and for points located on the crack faces are based on the visibility method. Despite the other conventional methods, the proposed method does not need any special formulation for modification of support domain. It works mainly with the surrounding triangles and the major modification is done on the crack faces. This method can be used when the background cells are triangular elements.
2. EFG Formulation
Consider a two-dimensional problem of solid mechanics in a domain Ω bounded by Γ. The strong form of system equation is given by (2.1)~(2.3) [1].
Standard Gauss quadrature is used for integrations in the penalty stiffness matrix and the penalty force vector. The integration is performed along the essential boundary, and hence matrix Kα will have entries only for the nodes near the essential boundaries, Γu which are covered by the support domains of the Gauss quadrature points on Γu.
3. Description of the Proposed Method
This method is a technique for construction of support domain in cracked bodies. The proposed method is based on the combination of the surrounding triangles algorithm and the visibility method. The resulting support domain using this method is almost the same as the transparency method and the diffraction method.
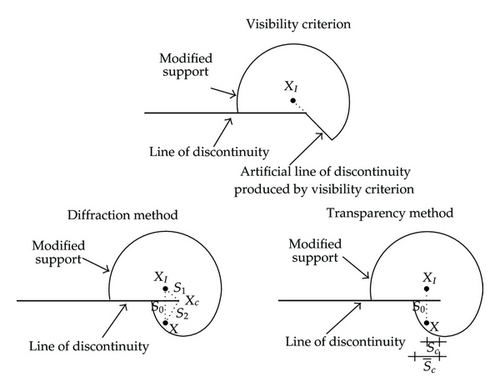
The visibility criterion can easily be understood by considering the discontinuity opaque for rays of light coming from the nodes [25]. That is, for the modification of a support of node I, one considers light coming from the coordinates of node I and truncates the part of the support which is in the shadow of the discontinuity. This is depicted in Figure 1 and the discontinuity at the crack faces can be simulated in meshless methods. A major short coming with this method is that at the discontinuity tips; an artificial discontinuity inside the domain is constructed as shown in Figure 1 [26].
The surrounding triangles algorithm is used for node searching when the background cells are triangular meshes. The construction of interpolation domains is slightly different for nodes (vertices) and Gauss points. The procedure for node selections is as follows. First, it is determined which node is a vertex of triangles (a node can belong to 6 different triangles). The vertices of these surrounding triangles are added to the interpolation domain of the node under consideration. These vertices can be referred to as the inner ring of selected nodes. In case a node is close to or on a boundary, the surrounding triangles do not always form a ring, but a string. For the construction of the interpolation domain for a Gauss point only the first selection step is different from that in the procedure for a node. The inner ring of nodes simply consists of the three vertices from the triangle in which the Gauss point is situated. The expansion step further more is the same as that for nodes. In Figure 2(a) the support domain of a sample node generated by this method is shown for nodes attached to three layers of neighboring elements of the sample node. This procedure for construction of interpolation domain, works well for regions far from the crack faces but it is not a proper method for regions near the crack faces.
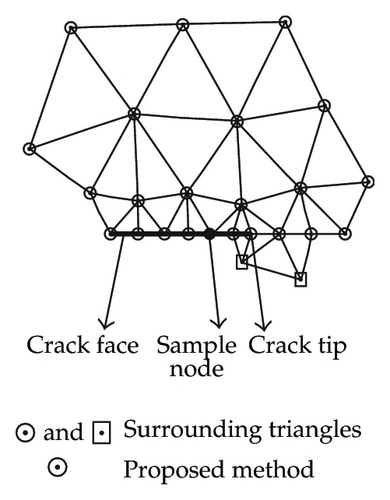
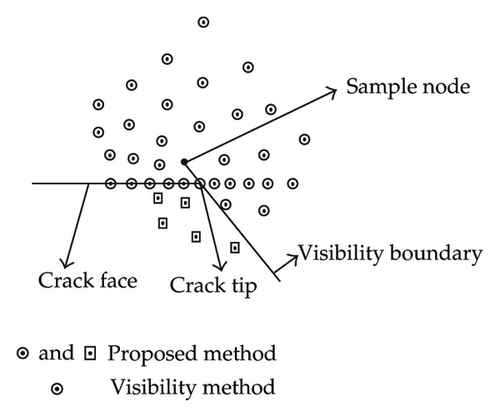
The proposed node searching algorithm is the same as surrounding triangles method, for nodes and quadrature points not located on the crack faces. But for nodes and quadrature points located on the crack faces, the visibility method is employed. In Figure 2(a) a comparison of the support domain generated by the surrounding triangles method and the proposed method is made for a sample node located on the crack face. Hollow inside circles plus hollow inside squares are nodes that make support domain of the sample node by the surrounding triangles method and hollow inside circles are nodes that make support domain of the sample node by the proposed method. As it is shown in the figure, two extra nodes marked by hollow inside squares are selected as supporting nodes in the surrounding triangles method. In the next section it will be shown that these two extra nodes cause virtual crack closure at the crack tip. Also in Figure 2(b) a comparison of the visibility method and the proposed method is made. A node near the crack tip is chosen as sample node. Hollow inside circles are nodes that make support domain of the sample node by the visibility method and hollow inside circles plus hollow inside squares are nodes that make support domain of the sample node by the proposed method. As it is shown in the figure, an artificial discontinuity is generated by the visibility method; but using the proposed method this artificial discontinuity is removed by selecting four extra nodes as supporting nodes for the sample node shown by the filled circle in the figure. According to Figure 2, it can be seen that five extra nodes are selected in the support domain of the sample node in comparison with the support domain generated by the visibility method. These extra nodes help to eliminate virtual crack closure at the crack tip as shown in Figure 3.
In the proposed method, number of layers of supporting elements are very important and affect the results. If few nodes are selected for support domain, there might be some problems for making inverse of moment matrix, and if more nodes are selected, the accuracy will be decreased. For the proposed method, nodes attached to three layers of neighboring elements of the sample node are selected for support domain of that node. For quadrature points, nodes attached to two layers of neighboring elements of the sample quadrature point are used. Also the number of nodes located in the support domain is limited to eight nodes for getting the optimum results.
4. Simulation of Crack Discontinuity Using the Proposed Method
For implementation of the proposed method, a 2D meshless code has been developed. This meshless code has 3 major modules. First module is the preprocessor. Preprocessing is done in ANSYS software and using a specific macro the information is transmitted to the processing module. Processing module is a FORTRAN program which solves the governing equations. The last module is after processing. TECPLOT software has been chosen for postprocessing. The results obtained can be shown in TECPLOT software.
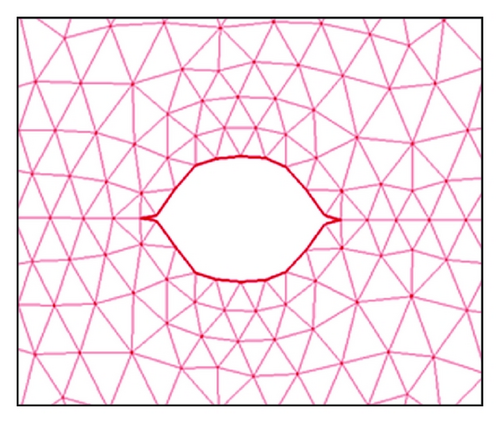
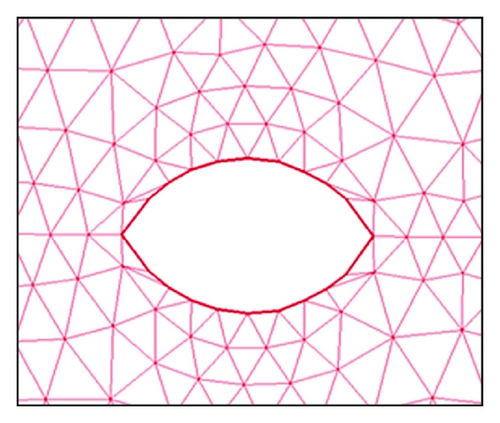
To show improper construction of support domain near the crack faces, first the surrounding triangles method is used for construction of support domain for a cracked body; and a virtual crack closure occurred near the crack tip as shown in Figure 3(a). Using the proposed technique, virtual crack closure will be removed. In the second step, the proposed method has been implemented. In Figure 3(b), the results of this procedure are shown for the Middle tension (MT) specimen and it can be seen that the above-mentioned problem has been resolved.
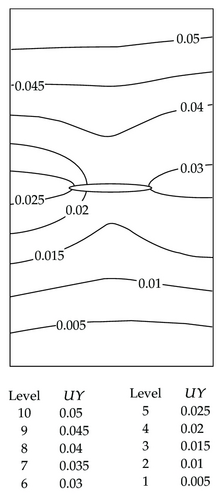
In Figure 4 vertical displacement of the MT specimen is compared with the result of ANSYS software. It can be seen that the results are in good agreement with each other.

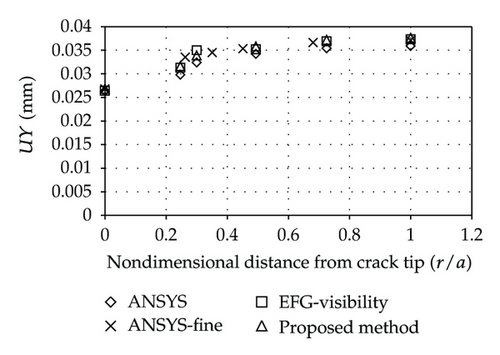
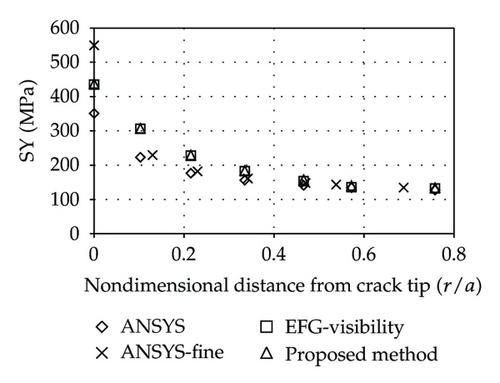
In Figure 5(a) opening of crack face for the MT specimen is calculated with different approaches. As shown in the figure the results obtained with the proposed method is almost the same as the results achieved with the visibility method. Finer mesh results for FEM analysis gave closer agreement with the proposed method. In Figure 5(b) plot of vertical stresses is illustrated. The proposed method and ANSYS results are with the same nodal density. As it is shown in the figure, results obtained with the proposed method are between the ANSYS results with two different nodal densities; the ordinary nodal density and the high nodal density. It can be concluded that if the same nodal density is used, then the proposed method gives better results.
5. Numerical Results for Benchmark Specimens
In Figure 6 specimens used for analyses are shown. These specimens are divided into two categories. Specimens shown at the right hand side of Figure 6 are subjected to concentrated load P and specimens shown at the left hand side of Figure 6 are subjected to uniform surface load σ. Parametric dimensions of specimens are illustrated in Figure 6 and also geometrical dimensions for present work are listed in Table 1. Material properties and load applied to the specimens are presented in Table 2. These specimens are analyzed in plane strain condition.
| W (mm) | 20 |
| B (mm) | 10 |
| L (mm) | 80 |
| r1 (mm) | 15 |
| r2 (mm) | 35 |
| X (mm) | 10 |
| P (KN) | σ (MPa) | E (GPa) | Nu |
|---|---|---|---|
| 10 | 100 | 150 | 0.3 |
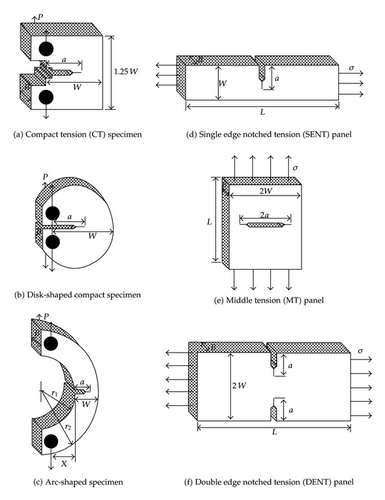
| Compact tension (CT) specimen | |
|---|---|
| Disk-shaped compact specimen | |
| Arc-shaped specimen |
| Single edge notched tension (SENT) panel | |
|---|---|
| Middle tension (MT) panel | |
| Double edge notched tension (DENT) panel |
It should be noted that in the proposed procedure the number of nodes located in support domain of quadrature points was limited to 8 for obtaining reasonable results.
In EFG meshless method, stresses and strains are continuous so any arbitrary path can be selected for integration. For simplicity a circle centered at crack tip and radius equal to a is selected as integrating path as shown in Figure 7. This path is divided to small segments and J integral is calculated at each segment. At the end, J integrals are added together to obtain the total J integral [24].
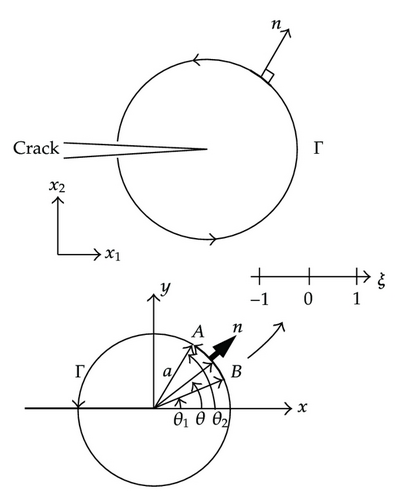
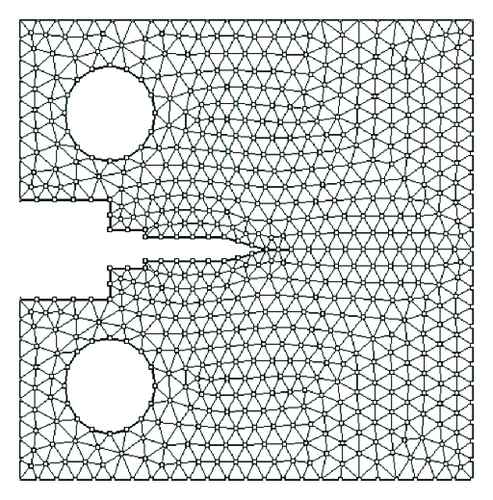
Finally (5.3) is used to calculate the stress intensity factors. Linear elastic fracture mechanics analyses are performed for standard test specimens and stress intensity factors are calculated. As shown in the results, in each test specimen, several a/W ratios are analyzed but for a sample demonstration, scattered nodes and triangular background cells and finite element mesh for uniform surface loaded specimens and point loaded specimens with a/W = 0.4 are presented in Figures 8 and 9, respectively.
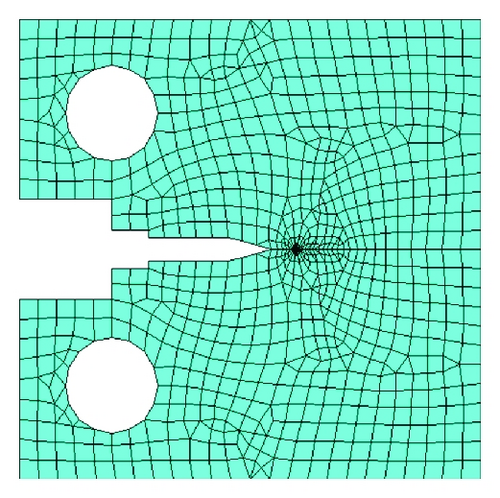
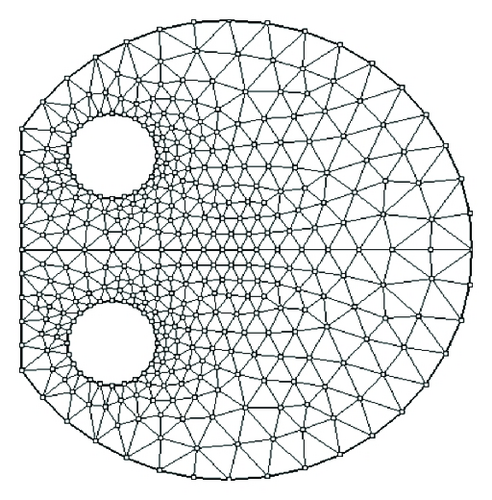
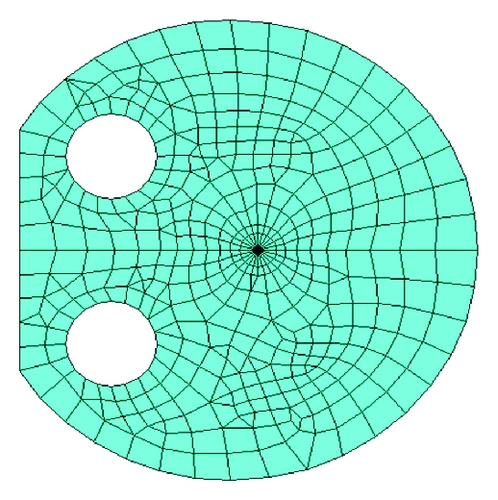
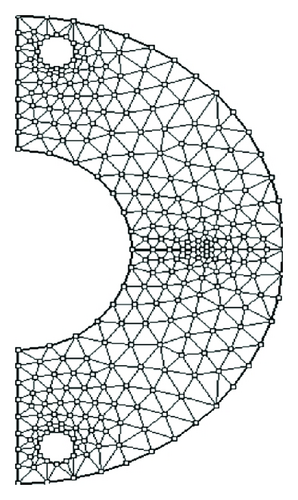
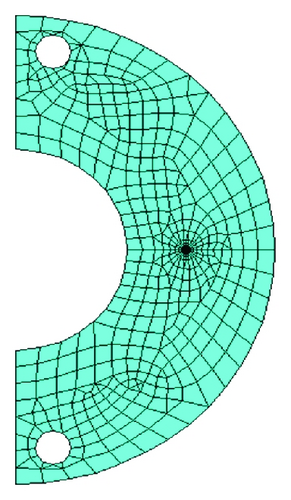


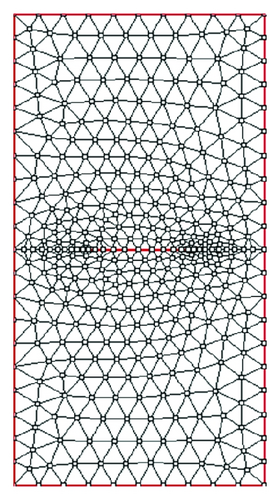
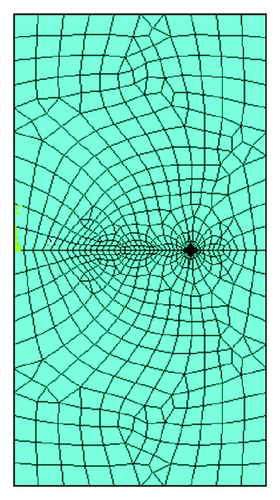
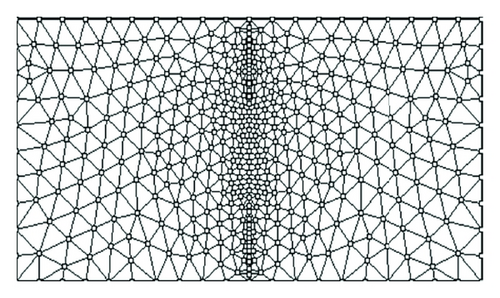
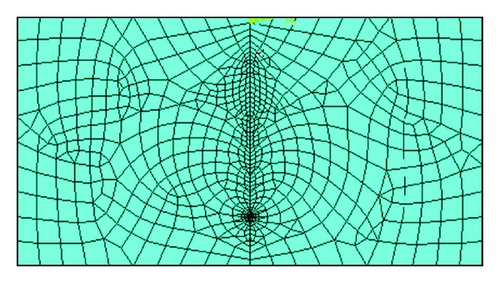
The results obtained by the proposed method, are compared with K-solutions obtained by ANSYS software and target values [23, 28]. Figure 10 shows that there is a good agreement for the achieved results by different methods.
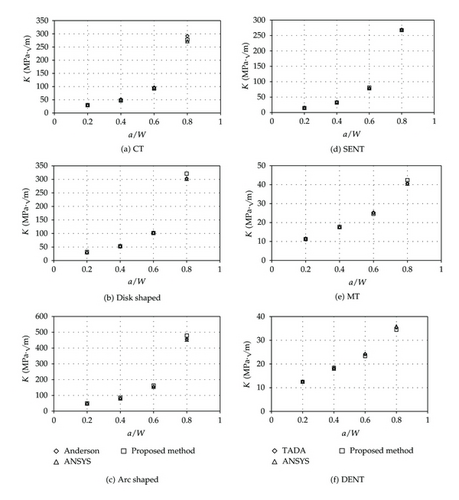
The percentage errors of calculated stress intensity factors between the new method and exact solution for number of geometries with surface loading are shown in Table 5. As it can be seen there is a close agreement between the results.
| a/W | MT | DENT | SENT |
|---|---|---|---|
| 0.2 | 1.8 | 0.9 | 3.3 |
| 0.4 | 0.6 | 1 | 3.5 |
| 0.6 | 2.7 | 3.7 | 3 |
| 0.8 | 4.2 | 2.7 | 3.2 |
6. Conclusions
In this paper a node searching algorithm for simulation of crack discontinuities in meshless methods is proposed. This method can simply be implemented, without engagement of any mathematical relationships. The proposed method is based on the combination of surrounding triangles and visibility methods. If the visibility method is used solely, the node searching algorithm will be complex and on the other hand, if the surrounding triangles method is used, due to the virtual crack closure phenomena the errors for stress analysis increase. Results for calculated stress intensity factors showed that there is good agreement has been obtained between exact solution and the proposed method for different types of geometries and loading conditions with an average 2.5 percent of error. The proposed technique for simulation of crack discontinuity can be used as a simple and efficient way which can be employed in meshless methods when the background cells are triangular meshes.


