A Maximum Power Point Tracker with Automatic Step Size Tuning Scheme for Photovoltaic Systems
Abstract
The purpose of this paper is to study on a novel maximum power point tracking (MPPT) method for photovoltaic (PV) systems. First, the simulation environment for PV systems is constructed by using PSIM software package. A 516 W PV system established with Kyocera KC40T photovoltaic modules is used as an example to finish the simulation of the proposed MPPT method. When using incremental conductance (INC) MPPT method, it usually should consider the tradeoff between the dynamic response and the steady-state oscillation, whereas the proposed modified incremental conductance method based on extension theory can automatically adjust the step size to track the maximum power point (MPP) of PV array and effectively improve the dynamic response and steady-state performance of the PV systems, simultaneously. Some simulation and experimental results are made to verify that the proposed extension maximum power point tracking method can provide a good dynamic response and steady-state performance for a photovoltaic power generation system.
1. Introduction
The characteristic curves representing the output current-voltage (I-V) and output power-voltage (P-V) relations of PV modules will change in a nonlinear fashion, due to differing irradiation and ambient temperature conditions. Thus, maximum power tracking control must be imposed on the PV modules to make sure that power output stays at maximum any time of the day. For this reason, many experts and scholars have put forward all manner of proposals for a variety of MPPT mechanisms [1–17].
One of the existing MPPT methods is the Perturb and Observe (P & O) method [1, 2], which has a simple structure and requires very little parameter measurements. The direction of the next perturbation is determined by periodically increasing or decreasing the size of the output voltage of the PV module, and comparing it with the previous output voltage and power prior to any change. This is the most popular MPPT method used to track maximum power. However, even after P & O tracking approaches MPP, its perturbation does not stop there but oscillates around the MPP, resulting in the loss of energy. Though this phenomenon may be compensated for by setting a smaller perturbation with a smaller oscillation magnitude, if significant irradiation change takes place, it will cause the transient response time of the newly tracked MPP to increase. Yet, even if a larger perturbation can accelerate the response speed of tracking, it will result in a large increase in the amount of steady-state oscillation. Therefore, perturbation quantity needs to be appropriately selected as a performance trade-off between steady-state and transient responses. The maximum power tracking logic formula for the Incremental Conductance Method (INC) [3, 4] is dI/dV = −I/V, where V is the output voltage, I is the output current, dI/dV is the dynamic conductance, and I/V is the static conductance. Traditional INC uses a fixed value for step adjustment of perturbation quantity during the tracking process. Similar to the P & O method, when the perturbation quantity is set to a smaller amount, the oscillation magnitude near the vicinity of the MPP will be smaller, making it easier to track the actual MPP. However, the tracking time will become relatively long. If perturbation quantity increases, the tracking speed will accelerate. But that would increase the steady-state oscillation, resulting in a loss of energy and a reduction in the PV module′s power output. Therefore, perturbation quantity depends on the equilibrium value between tracking accuracy and speed. Due to the complexity of the tracking process of INC method, the cost of the system will increase. Additionally, quantity measurement errors of the sensing element can further prevent the MPP from being tracked. However, to mitigate the defects of INC method, some experts and scholars have proposed a modified version of INC method [5] that uses a variable step size method of tracking and adds a fixed voltage tracking method to the tracking process. Thus, this method can be based on the characteristic curve of the PV module array to automatically adjust the size of each step. But the process involved in this method is highly complex, thus increasing the cost of the system. Factors such as switching the tracking system from a fixed-voltage tracking method to a modified INC method, or wrongfully setting the starting point of tracking, can result in system instability. Though the building of an intelligent fuzzy method for MPPT [6–9] can provide better performance for maximum power tracking of PV modules, these algorithms must be based on the output characteristics of PV modules to create rules for maximum power tracking control. For this reason, adaptive fuzzy logic [10] and parameter optimization techniques such as genetic algorithm [11] and particle swam optimization [12, 13] have been applied to overcome the problem in MPPT algorithm. Due to the extremely complex nature of the computation process, the practicality of these control rules is quite limited.
A number of studies on MPPT have concentrated on the application of artificial neural network (ANN) [14, 15]. In most of these ANN-based methods, large number of field data considering atmospheric conditions are required to train the ANN. Moreover, the main problem of ANN-based methods is that it is system dependent and cannot be implemented for PV arrays with different characteristics. The combined use of fuzzy logic and ANN to track maximum power point in PV systems can be found in [16, 17]. In this method, ANN is trained offline using experimental data to desfine a reference voltage, which is the voltage at the maximum point according to the PV array characteristic. The reference voltage is then compared to the instantaneous array to generate a signal error. The signal error and change of the error are considered as the fuzzy logic controller (FLC) inputs. The FLC generates a duty cycle value for the pulse width modulation (PWM) generator. The PWM trigger signal is then applied to the switching of the boost converter connected to a PV array. A drawback of this method is that it needs much data for offline training.
In this paper, a novel intelligent technique based on extension theory is proposed and used together with INC based MPPT controller in a PV system. The proposed MPPT controller can adaptively tune the tracking step size of tradition INC MPPT method to obtain superior dynamic response and steady-state performance, simultaneously. The less constructed data utilized, no learning procedures needed, and easy implementation are the good features of the proposed MPPT method.
2. Extension Theory
In 1983 Professor Cai, a scholar from China, first proposed the concept of extension theory, which was designed to study things in terms of their extensity. This theory explores qualitative and quantitative solutions for contradictions among things [18]. In addition, matter-element theory and extension mathematics are two core areas of extension theory. Matter-element theory mainly describes the extensity and transformation characteristics of matter-elements, while extension mathematics mainly focuses on the core calculus of the extension set and the correlation function [18].
Extension theory expresses information about things through the matter-element model, using the matter-element transformation to represent the changing correlation between the quality and quantity of the characteristics of matter. Then, the results from this correlation function are used to better understand the effects that these qualities and quantities have on the matter, so as to clearly express the level of impact from the characteristics of the matter.
2.1. The Concept of Extension Matter Element
In extension matter-element theory, when a characteristic of matter element is one of many, it is expressed as the xth characteristic and the xth corresponding characteristic value, respectively.
2.2. Distance and Rank Value
2.3. Correlation Function
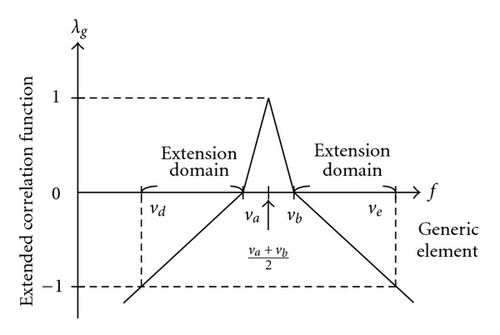
In addition, when λg(f) < −1, it means that point f is outside the interval F; when λg(f) > 0, it means that point f is inside the interval F0; when −1 < λg(f) < 0, it means that point f falls within the extension domain.
3. Extension Theory-Based MPPT Method
This study proposed an extension theory-based MPPT method designed to analyze the I-V characteristic curve of a photovoltaic module array using variation in slope errors as the characteristic of the proposed extension MPPT method and established 12 categories in the construction of the matter-element model. Calculations of degree of correlation related to the 12 categories were used to adjust the duty cycle of the MPPT boost converter circuit by category, to achieve maximum power tracking.
3.1. Characteristic Selection for the Proposed MPPT Method
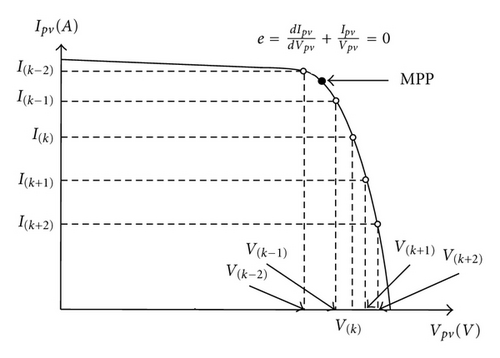
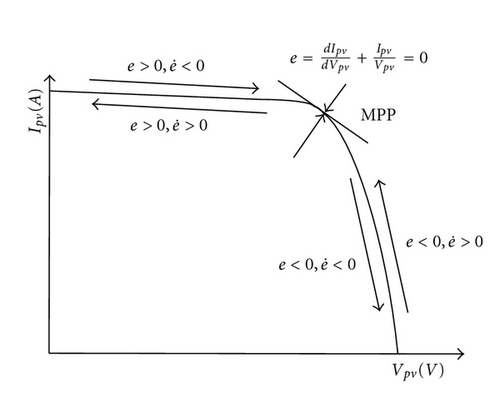
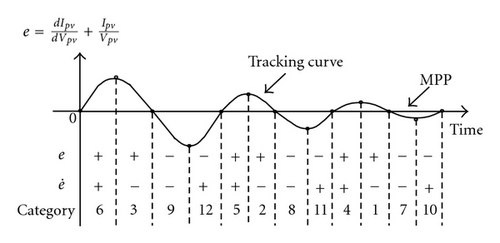
In this paper, to let the MPPT method possess adaptive capability, the step size of the INC MPPT method of the PV arrays is adaptively tuned by extension error tuning scheme. The tuning scheme is driven by a sum of static conductance Ipv(k)/Vpv(k) and dynamic conductance dIpv(k)/dVpv(k) which are defined as with at kth sampling interval, respectively. The major purpose of this MPPT controller is to let the resulting dIpv/dVpv + Ipv/Vpv closely follow the reference dIpv/dVpv + Ipv/Vpv = 0 as shown in Figure 3 for driving the operation point toward the maximum power point. Thus, the general model e and trajectory can be predicted and plotted in Figure 4.
3.2. Establishment of a Matter-Element Model for the Characteristics of the Proposed MPPT Method
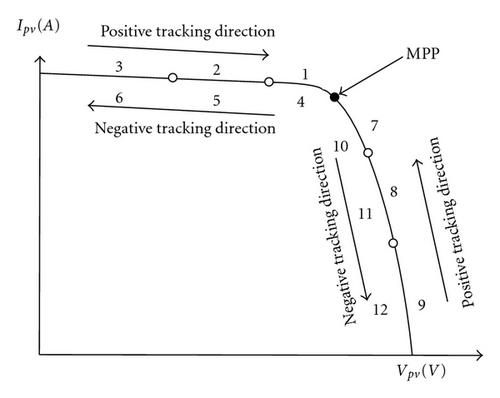
Figure 4 further expanded on Figure 3 and divided the I-V characteristic curve into 12 regions (categories) using rules of thumb. In each category, the slope error e, change in the slope error , and change in the duty cycle ΔD were as shown in Table 1. In addition, the proximity between each category and the MPP was converted into a wave form to express the relationship between the 12 categories and the MPP; the results are displayed in Figure 5. As learned from Figures 4 and 5, Category numbers 3, 6, 9, and 12 showed larger amplitude swings because they were furthest away from the MPP. Category numbers 2, 5, 8, and 11 were closer to the MPP; category numbers 1, 4, 7, and 10 were closest to the MPP, so their swings in amplitude were smaller.
| Category number | Slope error category e | Slope error change category | Duty cycle step size ΔD |
|---|---|---|---|
| 1 | 0 < e ≤ 0.00488 | −0.01 | |
| 2 | 0.00488 < e ≤ 0.03016 | −0.02 | |
| 3 | 0.03016 < e ≤ 150 | −0.05 | |
| 4 | 0 < e ≤ 0.00488 | −0.01 | |
| 5 | 0.00488 < e ≤ 0.03016 | −0.02 | |
| 6 | 0.03016 < e ≤ 150 | −0.05 | |
| 7 | −0.00446 < e ≤ 0 | 0.02 | |
| 8 | −0.01095 < e ≤ −0.00446 | 0.03 | |
| 9 | −0.1 < e ≤ −0.01095 | 0.05 | |
| 10 | −0.00446 < e ≤ 0 | 0.02 | |
| 11 | −0.01095 < e ≤ −0.00446 | 0.03 | |
| 12 | −0.1 < e ≤ −0.01095 | 0.05 |
| Category | Classical domain | Category | Classical domain |
|---|---|---|---|
| 1 | 7 | ||
| 2 | 8 | ||
| 3 | 9 | ||
| 4 | 10 | ||
| 5 | 11 | ||
| 6 | 12 |
The following is the tracking control procedure using the proposed extension MPPT method.
Step 1. From slope error e and the amount of change in slope error in each category, construct a matter-element model:
Step 2. Entering the to-be-classified slope error e and the amount of change in slope error , the matter-element model is
Step 3. Based on the slope error e and the amount of change in slope error Δe, use (7) to calculate the correlation function between them and each individual category.
Step 4. Select weights W1 and W2 for each characteristic to represent the significance level of each characteristic. This study used a rule of thumb to select W1 = 0.85 and W2 = 0.15.
Step 5. Calculate the degree of correlation with each category:
Step 6. Select the maximum value from the calculated degree of correlation to identify the classified slope error e and the amount of change in slope error Δe into their respective categories. Setting the duty cycle variation ΔD according to the category to which it belongs, recalculate the new value of the duty cycle:
4. Simulation and Experimental Results
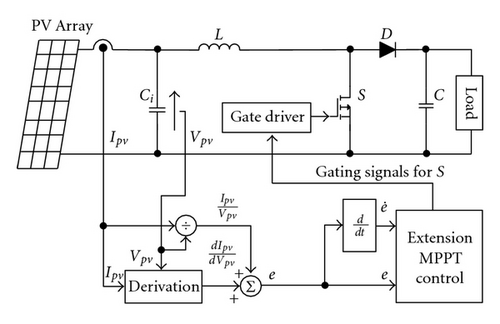
Figure 6 shows the system architecture of the proposed extension MPPT. Its maximum power tracking circuit architecture is a boost converter circuit; the design value of its circuit components is shown in Table 3 [19]. With respect to simulation, the PSIM simulation software [20] in this study used Kyocera KC40T [21] as a reference module to construct a 516 W PV power generation system that applies variation in irradiation to simulate the proposed extension MPPT method and the traditional MPPT method and carried out a performance comparison. In terms of measurements, the PSoC chip made by Cypress Company was used to achieve the proposed extension MPPT strategy and performed the actual testing of the physical MPPT circuit under variable irradiation conditions.
| Part name | Inductor L | Output capacitor C | Input capacitor Cin |
|---|---|---|---|
| Value | 2.4 mH | 46 uF | 460 uF |
4.1. Simulation Results
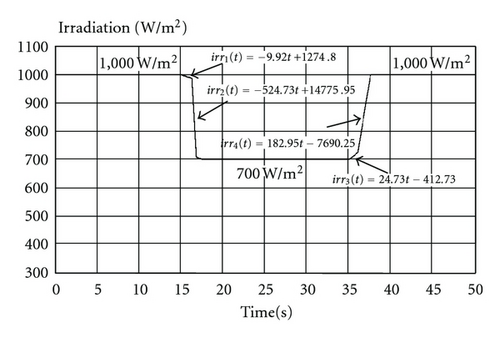
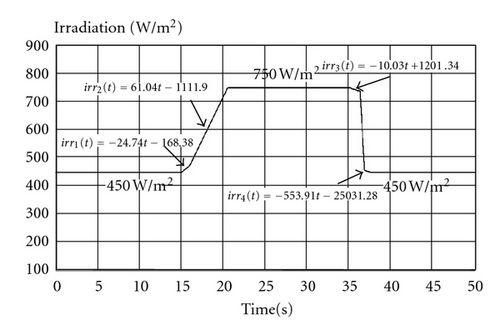
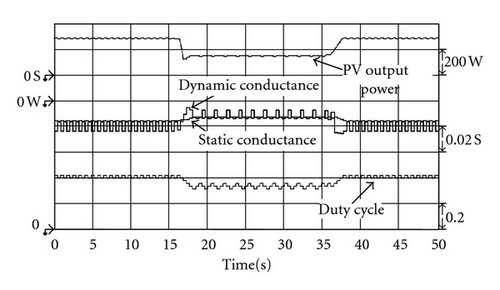
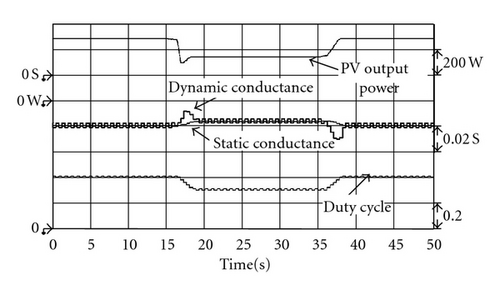
This study carried out simulations under two different linear variations in irradiation conditions: one with an irradiation that dropped from 1,000 W/m2 to 700 W/m2, then increased back to 1,000 W/m2; and another with a irradiation that increased from 450 W/m2 to 750 W/m2 and then dropped back to 450 W/m2. These linear variations in irradiation are shown in Figures 7 and 8. Then, the proposed extension MPPT, traditional INC, and variable step size INC methods were simulated and compared in terms of performance. The step variation (ΔD) of the traditional INC method was fixed at a value of 0.02, while the step variation of the variable step size INC method was set to 0.02 during the MPPT process. But when the power tracking was close to the MPP, step size variation changed from 0.02 to 0.01 to reduce the amount of steady-state oscillation. The change in the amount of step size change was based on the calculated value; whether or not it was lower than the set value of 0.005 S formed the basis for changing the step variable quantity. The step changeability of the extension INC method was adjusted automatically based on the position of the working point as shown in Table 1.
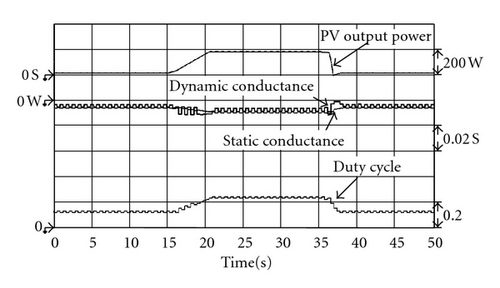
Figures 9, 10, and 11 show the output waveforms of a PV module array using the traditional INC, variable step size INC, and proposed extension MPPT methods. As can be observed from Figures 9 to 11, the steady-state oscillation amplitude of the proposed extension MPPT method was the smallest of the three tracking methods. In addition, when irradiation changed from the linear interval to the constant value interval or changed from constant interval to linear interval, the proposed extension MPPT method has better dynamic response than the traditional INC and variable step size INC methods. It can be seen that in addition to the good steady-state response of the proposed extension MPPT method, its transient response also has a good speed. Though the variable step size INC method can improve the amount of change in the steady-state response, its transient response slowed down.

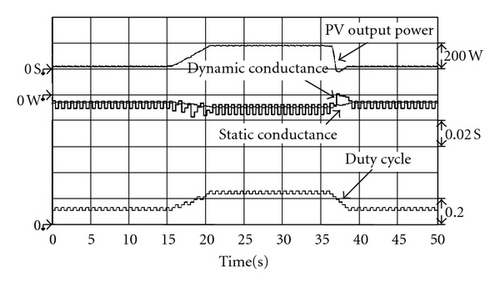
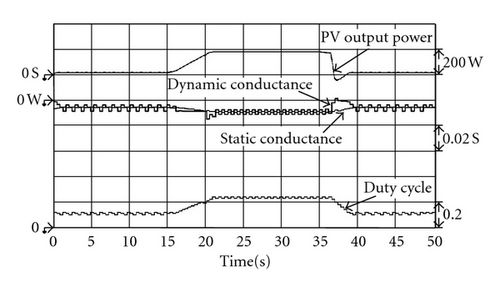
In addition, to display excellence in maximum power tracking performance of the proposed extension MPPT method under various conditions of irradiation, this study followed a linear change in irradiation that increased from 450 W/m2 to 750 W/m2 and then dropped back down to 450 W/m2 (irradiation changes as shown in Figure 8) to simulate the proposed tracking method. As can be seen from Figures 12, 13, and 14, regardless of whether it is under steady-state or transient response, the proposed extension MPPT method possesses similarly impressive performance, proving that the proposed tracking method has high robustness.
4.2. Measurement Results
The PV module array used during the measurement was a solar simulator [22] made by KERNEL to simulate a Kyocera KC40T solar module-based PV array with output voltage of 208 V, output current of 2.48 A, and output power of 516 W. The irradiation was changed by turning the irradiation spin button on the solar simulator to adjust the variable irradiation during measurement.
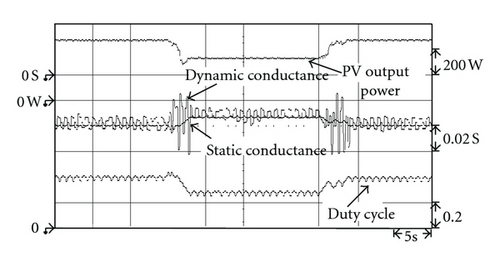
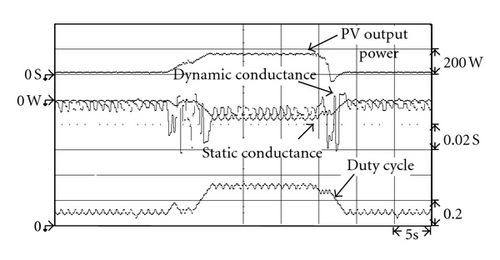
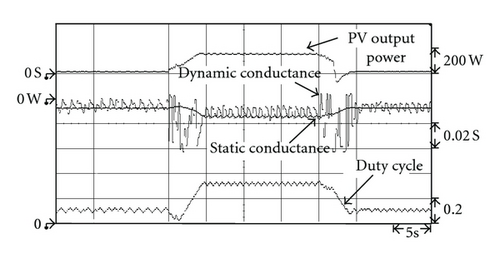
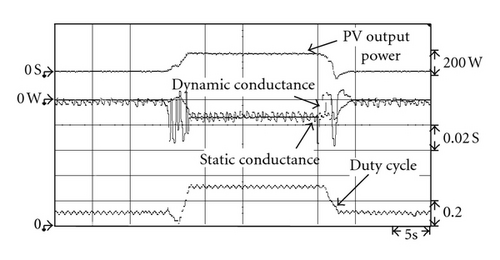
Figures 15 to 17 show the measured output power waveform under irradiation that drops from 1,000 W/m2 to 700 W/m2, then rises again to 1,000 W/m2, as simulated by the solar simulator. As can be seen in Figures 15 to 17, at the 15 s mark, the irradiation began to change. The proposed extension MPPT method can achieve tracking of the new maximum power point (MPP) after about 1.1 s. As can be seen in Figures 15 and 16, the tradition INC method and the variable step size INC method required 1.4 s and 1.6 s, respectively, to achieve tracking of the new MPP. This shows that the proposed extension MPPT method has better performance in transient response in terms of tracking speed than the tradition INC and variable step size INC methods. In addition, the amount of steady-state oscillation is at a minimum after the proposed extension MPPT method has tracked the MPP. Thus, it also has a better steady-state performance than the traditional INC and the variable step size INC methods. That is, the power loss of the proposed extension MPPT method at the MPP is the least of the three MPPT methods. The output waveforms of the three tracking methods still oscillate upon achieving the MPP, due to maximum power tracking control still tracking back and forth in the vicinity of MPP.
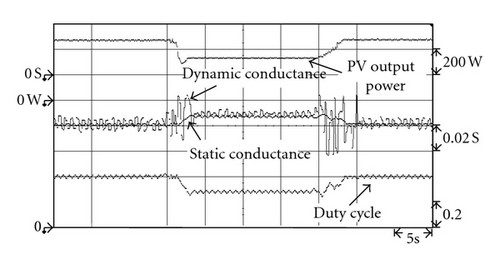
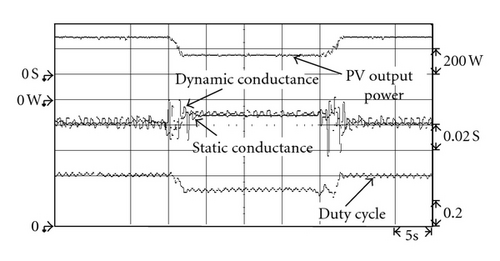
In addition, to verify that the proposed extension MPPT method conforms with the simulated results, such that it still has good tracking performance for maximum power under various conditions of irradiation, the developed maximum power tracking circuit was used to carry out experimental testing under levels of irradiation that rose linearly from 450 W/m2 to 750 W/m2 and then dropped back down to 450 W/m2. As can be seen in Figures 18, 19, and 20, the results of the proposed extension MPPT method were the same as those of the simulation results shown in Figures 12 to 14. During the maximum power tracking process, it had better performance, regardless of transient or steady-state response. Table 4 shows the steady-state output power under various irradiation conditions using the extension MPPT method, the tradition INC method, and the variable step size INC method. To more clearly show that the steady-state performance of the proposed extension MPPT method is superior to that of the traditional INC and variable step size INC methods, this study postulated a single day irradiation of 1,000 W/m2, 800 W/m2, and 450 W/m2 at sunshine times of 2 hrs, 3 hrs, and 4 hrs, respectively, for a comparison of the output power values from the three MPPT methods; the results of which are shown in Table 5. Table 5 shows that the output power value of the extension MPPT method was the highest of the three MPPT methods, which means that the power loss of the proposed extension MPPT method at the MPP was the least of the three MPPT methods.
| Irradiation | Method | ||
|---|---|---|---|
| Traditional INC method | Variable step size INC method | Extension INC method | |
| 1,000 W/m2 | 512 W | 514 W | 516 W |
| 800 W/m2 | 411 W | 412 W | 413 W |
| 450 W/m2 | 229 W | 230 W | 231 W |
| Irradiation (Operation hours) | Method | ||
|---|---|---|---|
| Traditional INC method | Variable step size INC method | Extension INC method | |
| 1,000 W/m2 (2 hrs) | 1024 Wh | 1028 Wh | 1032 Wh |
| 800 W/m2 (4 hrs) | 1644 Wh | 1648 Wh | 1652 Wh |
| 450 W/m2 (6 hrs) | 1374 Wh | 1380 Wh | 1386 Wh |
5. Conclusion
This paper proposed an intelligent extension theory-based maximum power point tracking method for a 516 W PV power generation system. This study carried out simulation and measurement of maximum power tracking performance under variable irradiation conditions to verify the effectiveness of the proposed method. The simulated and measured results show that the proposed extension MPPT method possesses quick dynamic response to rapidly changing irradiation conditions. Its steady-state response at the MPP also has better performance than the traditional INC and variable step size INC MPPT methods. Meanwhile, the power loss of the proposed extension MPPT method at the MPP is far less than the traditional INC and variable step size INC MPPT methods. Thus, it can improve the overall power generation efficiency of the PV power generation system.
Acknowledgments
This study is grateful for the support provided by the research grants from the Bureau of Energy of the Ministry of Economic Affairs and for the technical assistance received from the Green Energy and Environment Research Laboratories, Industrial Technology Research Institute, Taiwan.


