Novel Chromatic Technique Based on Optical Absorbance in Characterizing Mineral Hydraulic Oil Degradation
Abstract
A low cost, compact, real-time, and quick measurement optical device based on the absorbance of white light, which comprised of photodiodes in a 3-element color-sensor, feedback diodes, water and temperature sensing element, and so on, was developed and tested in low absorption mineral oil. The device, a deviation from conventional electrical, mechanical, and electrochemical techniques, uses color ratio (CR) and total contamination index (TCI) parameters based on transmitted light intensity in RGB wavelengths for oil condition monitoring. Test results showed that CR corroborated CIE chromaticity (X-Y Coordinates) and increased with oil degradation unlike Saturation S and Hue H. CR was found to be independent of the particulate contaminants of oil, but dependent on chemical degradation. TCI depended on both chemical degradation and particulate contaminants in oil, being most sensitive in the blue wavelength range and least in the green. Furthermore, results agreed with those of viscometry, total acid number (TAN), and UV-VIS photospectrometry. CR and TCI gave clearer indication of oil degradation than key monitoring parameters like TAN and were found to be effective criteria for characterizing the degradation of hydraulic mineral oils.
1. Introduction
1.1. Background
Oil contamination could be chemical (oxidative and thermal degradation [1], dissolved and emulsified water) or physical (from wear particles, dust, free water, and air). Besides, oil can also degrade by photodegradation (from exposure to the sun ultraviolet rays) [2, 3]. As oils degrade in service, chemical and physical changes inevitably occur. These include change in acidity due to oxidation and additive depletion, viscosity change due to formation of higher molecular weight components, and increased interfacial wear of mating pairs. These changes affect the oil performance.
Oil performance characteristics can be detected by total acidity number (TAN), viscometry, UV-VIS photospectrometry, and so forth. However, these methods mainly measure a single parameter and assume no machinery malfunctions during the measurements. Single parameter sensors only provide a narrow view of a lubricant quality. Hence, finding a set of measurands that unambiguously identifies the emergence of oil degradation is important. This set of measurements must satisfy statistical criteria so that rational limits can be set on deviations. Subsequently, development of reliable sensor to quantify these measurands becomes imperative. To increase measured data adequacy and reliable estimation of tribocondition, development of online integrated system is strongly desirable.
Recently, various oil monitoring sensors have been proposed. Kumar et al. [4] developed an online optical color sensor which could transform oil darkness during degradation into electrical resistance. Light intensity passed through the oil from one end is recorded at the opposite end. Change in oil opacity derived from degradation is detected as change in light absorbance which is converted to electrical resistance. Similarly, Turner and Austin [5] proposed an electrical technique for online condition monitoring of lubricating oils, by tracking oils dielectric constants, the ratio of the permittivity of oil to the permittivity of free space, using interleaved-disc capacitors. Khandaker et al. [6] used chromatic modulation technique to detect change in oil condition not by detecting intensity changes at particular wavelengths but by monitoring the sum of the contributions of relative changes at all wavelengths within a spectral power distribution. Electrical inductance techniques based on change in inductance of transducer coils due to the presence of metallic particles had been proposed by Whittington et al. [7] and Flanagan et al. [8]. Such devices are more sensitive to wear particles, compared to oil chemical degradation which usually precedes wear particle generation at tribo-interfaces. Besides, the ≤100 micron size particles detected with their devices pose lesser problems to hydraulic oils due to filtration. Other conventional oil sensors such as Delphi sensor [9] and Conti-Temic sensor [10] are based on dielectric constant principle. Lubrigard [11] and Kittiwake [12] based on dielectric/Tan-delta measurement, Flowtonics/Impact sensor [13] based on electrochemical impedance measurement, whereas the Voelker sentinel sensor [14] is based on conductivity measurement of polymeric bead matrix. Another current trend in the art of oil monitoring is the development of miniaturized devices based on optical absorption spectroscopy [15, 16]. Also, Chen et al. [17] used multi-RGB (7-nos RGB) color sensors for the measurement of LED ceiling light in air, not oil. The results of these state-of-the-arts sensors could be masked by the presence of wear particles and polar contaminants in oil. Hence, there is need for a paradigm shift.
In this work, a multiparameter detector based on optical absorption in a 2 cm thick oil-column and integrating 3 sensors to quantify 4 measurands (chemical degradation, total contamination, water content, and temperature) is proposed. With the device, oil chemical degradation was evaluated by color ratio (CR), and total contamination was measured by optical density in RGB wavebands. Water content was measured as relative saturation (%RS) by using air-humidity sensor-element (HIH-3610, Honeywell Inc., USA) modified for oleoapplications. Temperature was measured by a temperature sensor-element (TC1047, Microchip Inc., USA). Analyses of various oil samples from machines and artificially aged samples were performed, and results compared with other conventional techniques.
1.2. Sensor Measurement Principle
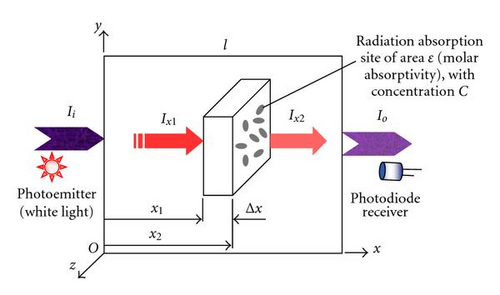
2. Experimental Details
2.1. Sensor Probe Description
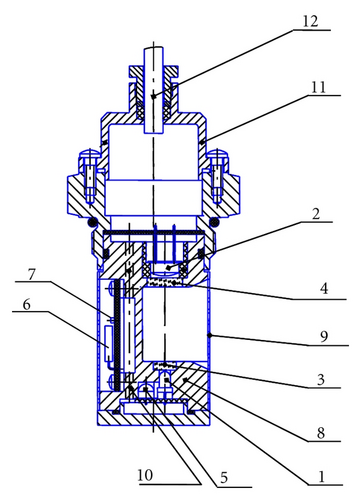
Figure 2 shows a design of the oil degradation detector probe developed (Kong et al. [19]—USA Patent application number 20080024761). The probe comprises the housing (8) in which oil chemical degradation and total contamination, water content and temperature sensors are mounted. Optical radiation from the white LED (1) in Figure 2 enters into a 2 cm thick oil-column through the optical window (3) and is incident on the RGB color sensor (2) through the optical window (4). Feedback photodiode (5) is used to stabilize the optical power of the emitter. The emitter (1) and color sensor (2) are connected to a preamplifier PCB under cover (11) by electrical wires (10). The entire detector probe is connected by cable (12) to a microcontroller (not shown in Figure 2). Water sensor (6) and temperature sensor (7) are glued to housing (8) by epoxy. Protective mesh (9) is also mounted on the housing (8) to isolate air bubbles and secure optical windows from mechanical damage.
2.2. Materials and Methods
Three mineral hydraulic oils, T100, DTE-24 (#1, #2), and DTE25 oils (Exxon-Mobil) were obtained from the hydraulic systems of a steel factory (POSCO, Korea), were used for calibration and testing. Bulk oil operational temperatures of the hydraulic systems were 20–30°C and 50–65°C in winter and summer, respectively. For these oils, A sample is the fresh oil sample, while C samples are degraded more than B samples. For DTE25, B, C, and D samples were sampled on August 23, October 30, and January 10, respectively. Different levels of particulate contamination were created in fresh T100 oil by Fe-particles (Yakuri Chemicals, Japan) inclusion (using black-to-gray carbonyl Iron powder Grade-L, mean particle size 7.6 μm). Different levels of oil-ageing were created by thermal degradation (ASTM D2070) in an electric gravity oven.
Viscometry (ASTM D445) was performed using Cannon viscometers in a viscometer bath (KV-8, Stanhope-Seta, UK), and TAN tests were performed using kittiwake kits (FG-K25196-KW, FG-K2-006-KW, Kittiwake, UK) configured to ASTM D974/D664. UV-VIS spectrometry (ASTM D275) was performed with photospectrometer (Opron-3000, Republic of Korea).
The detector probe was connected-up to a microcontroller and computer after cleaning; then power was turned on and probe optical windows were immersed in oil sample contained in a vessel. CR, TCI, temperature, and water content (%RS) measurands were recorded. Detector output display range accuracy was ±0.01 for CR and TCI, ±1% for RS and ±1°C for temperature.
3. Results and Discussion
3.1. Calibration and Chromatic Processing

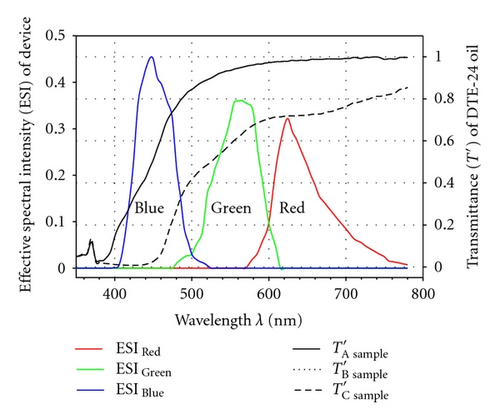
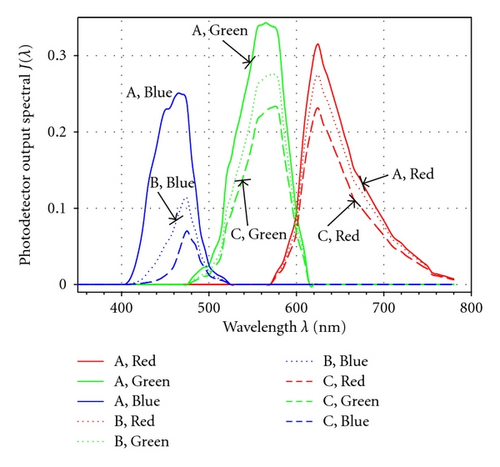
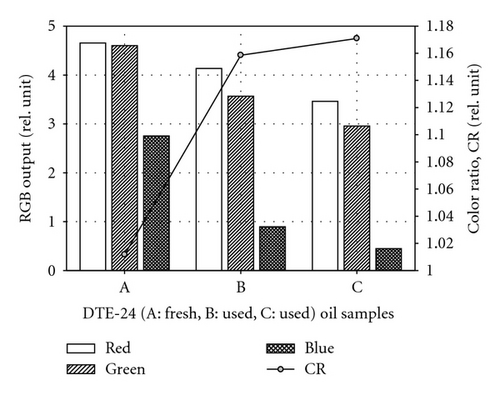
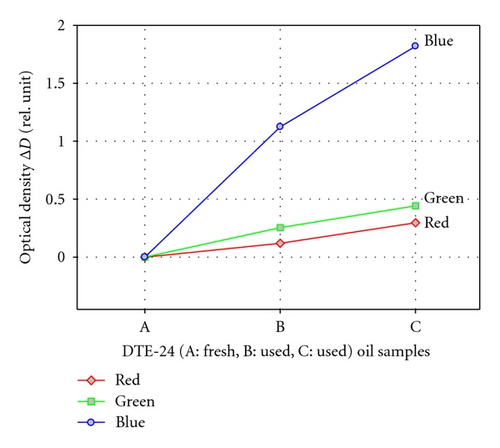
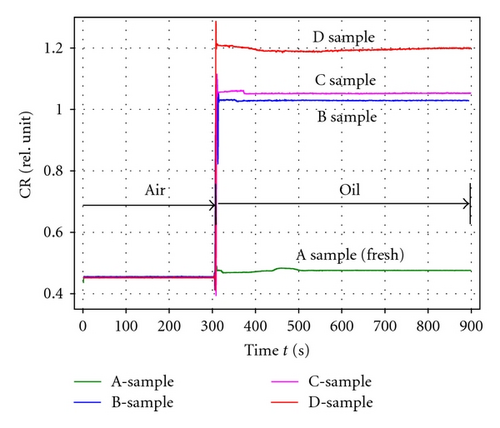
| Samples | CR | CIE coordinates | Saturation S | Hue H | |
|---|---|---|---|---|---|
| x | y | ||||
| DTE25 oil | |||||
| Air | 0.453 | 0.195 | 0.430 | 0.376 | 165.9 |
| A sample | 0.470 | 0.280 | 0.596 | 0.658 | 79.9 |
| B sample | 1.028 | 0.471 | 0.458 | 0.737 | 58.04 |
| C sample | 1.051 | 0.476 | 0.454 | 0.745 | 56.55 |
| D sample | 1.200 | 0.507 | 0.422 | 0.753 | 48.39 |
| DTE24 #2 oil | |||||
| Air | 0.453 | 0.195 | 0.430 | 0.376 | 165.9 |
| A sample | 1.012 | 0.388 | 0.383 | 0.257 | 58.3 |
| B sample | 1.159 | 0.481 | 0.415 | 0.644 | 49.5 |
| C sample | 1.171 | 0.504 | 0.431 | 0.771 | 49.9 |
3.2. Artificially Degraded Oils
3.2.1. Color Ratio (CR) and Total Contamination Index (TCI)
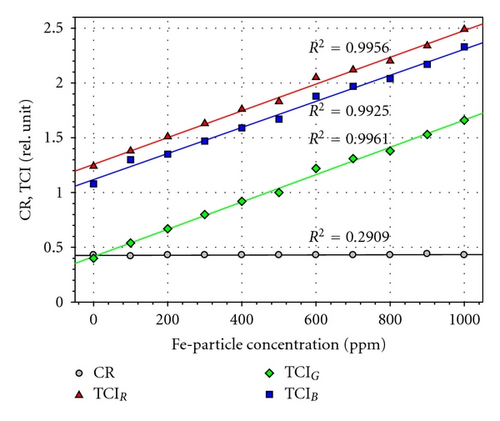
In particle-contaminated T100 oil, CR values were practically constant and independent of physical particle concentration as shown in Figure 9. The samples in the figure were purely Fe-particle/oil mixtures without chemical reaction. TCI in the 3 wavelengths linearly increased with particle concentration in T100 samples with R2 = 0.9956, 0.9925, and 0.9961 for the red, green, and blue, respectively. Standard error and sum of square residuals for the regressions were 0.0284, 0.0273, 0.0361 and 0.0073, 0.0067, 0.0117 for the red, green, and blue wavelengths, respectively. Using one-tail t-test, the P value of this regression was P value = 3.294 × 10⁻¹², 1.917 × 10⁻¹² and 3.519 × 10⁻¹¹ for the red, green and blue waveband respectively; that is a statistical significance of 3.294 × 10⁻¹⁰%, 1.917 × 10⁻¹⁰%, and 3.519 × 10⁻⁹% in the red, green, and blue wavelength correspondingly. Hence, the null hypothesis of TCI independence on physical or particulate contamination in oil is therefore rejected based on less than 0.001% highly statistical significance.
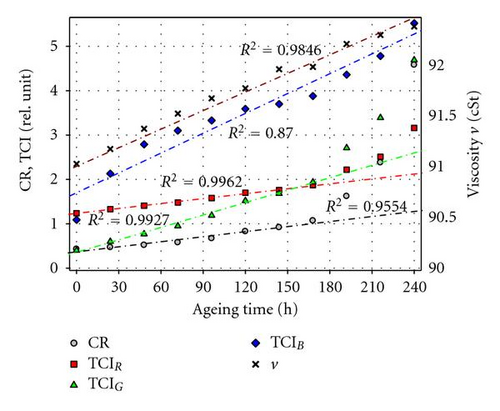
In the thermally degraded T100 samples, TCI increased linearly with increasing ageing time as shown in Figure 10. However, from the 192 h degraded-oil, samples became very dark with CR, TCIR, TCIG, TCIB, and ν40 values of 1.62, 2.22, 2.71, 4.36, and 92.24 cSt, respectively; showing a shift from the linearity assumptions of Lambert-Beer’s law.
3.2.2. Viscosity and Total Acid Number (TAN)
Kinematic viscosity ν (Figure 10) of the thermally degraded oil in this study varied linearly with ageing time, due to the buildup of insolubles and evaporative loss of more volatile components observed by Kaleli and Yavslioli [24]. This variation pattern of viscosity with ageing agrees with the results of Singh et al. [25]. These higher molecular weight insoluble components increase the oil viscosity in the course of oil degradation.
The TAN-values showed little change during thermal degradation, decreasing from 0.20 to 0.15 mgKOH/g after 240 h probably due to the additive depletion either by evaporative loss or decomposition of organic acidic-additive in oil, verifiable by molecular spectroscopy [26]. These degraded samples showed CR, TCIR, TCIG, TCIB and ν40 values of 4.58, 3.16, 4.69, 5.52, and 92.41 cSt, respectively, for the 240 h sample, and 0.43, 1.23, 0.40, 1.05, and 90.79 cSt, respectively, for 0 h sample. Comparing the change ranges indicates that the CR and TCI were more sensitive to degradation than viscosity and TAN in these samples.
3.2.3. UV-VIS Photospectrometry
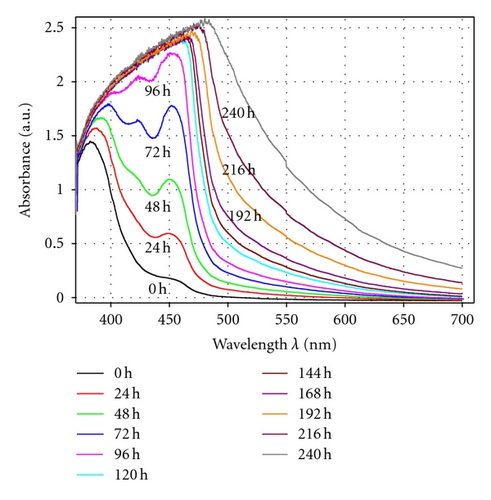
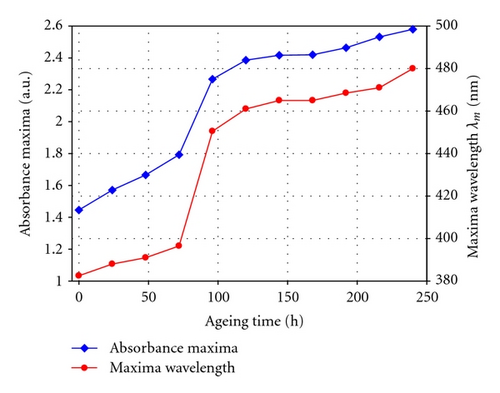
The UV-VIS photospectrometry of the artificially degraded samples shown in Figure 11 indicate a steady absorbance increase with increase in ageing time; and a spectral shift from short to longer wavelength in the course of oil ageing by thermal degradation. Optical maximum-absorbance (absorbance maxima) of the samples and its wavelength of occurrence also increased with ageing time as in Figure 12. Hence, the shift in the absorbance spectra is associated with a shift in maximum-absorbance wavelength from short to longer wavelength. The results of Figures 11 and 12 provide good background support for the measurement principle of the detector.
4. Conclusion
CR and TCI parameters results of the detector were comparable to other color processing parameters of color theory like CIE chromaticity X-, Y-coordinates; and hence, found to be effective criteria for the characterization of the degradation of hydraulic mineral oils. CR depended on oil chemical degradation, while TCI depended on both chemical and physical degradation. TCI was most sensitive in blue waveband and least in the green for the mineral oils. CR and TCI results conform to results of other analyses techniques, such as viscometry, TAN, and UV-VIS photospectrometry.
Nomenclature
-
- Ab:
-
- Absorbance
-
- C:
-
- Concentration of absorption sites
-
- CR:
-
- Color ratio
-
- D:
-
- Optical density
-
- f:
-
- Preucil Hue error
-
- H:
-
- Hue
-
- :
-
- Effective spectral intensity
-
- I:
-
- Light intensity of emitter
-
- J:
-
- Output light intensity of photodiode
-
- k:
-
- Sector number
-
- kλ:
-
- Absorptivity coefficient
-
- LED:
-
- Light Emitter Diode
-
- l:
-
- Optical path length
-
- RS:
-
- Relative saturation
-
- S:
-
- Saturation
-
- S′:
-
- Spectral sensitivity
-
- TAN:
-
- Total acid number
-
- TCI:
-
- Total contamination index
-
- U:
-
- Output voltage of the photodiode
-
- X, Y:
-
- Chromaticity CIE Coordinates
-
- ε:
-
- Molar absorptivity
-
- ν:
-
- Kinematic viscosity.
Subscripts
-
- i:
-
- Input
-
- o:
-
- Output
-
- R, G, B:
-
- Red, green, blue wavelengths.
Superscripts
-
- f:
-
- Fresh oil
-
- u:
-
- Used oil.


